Medical Imaging Management Market Size and Share
Market Overview
| Study Period | 2020 - 2031 |
|---|---|
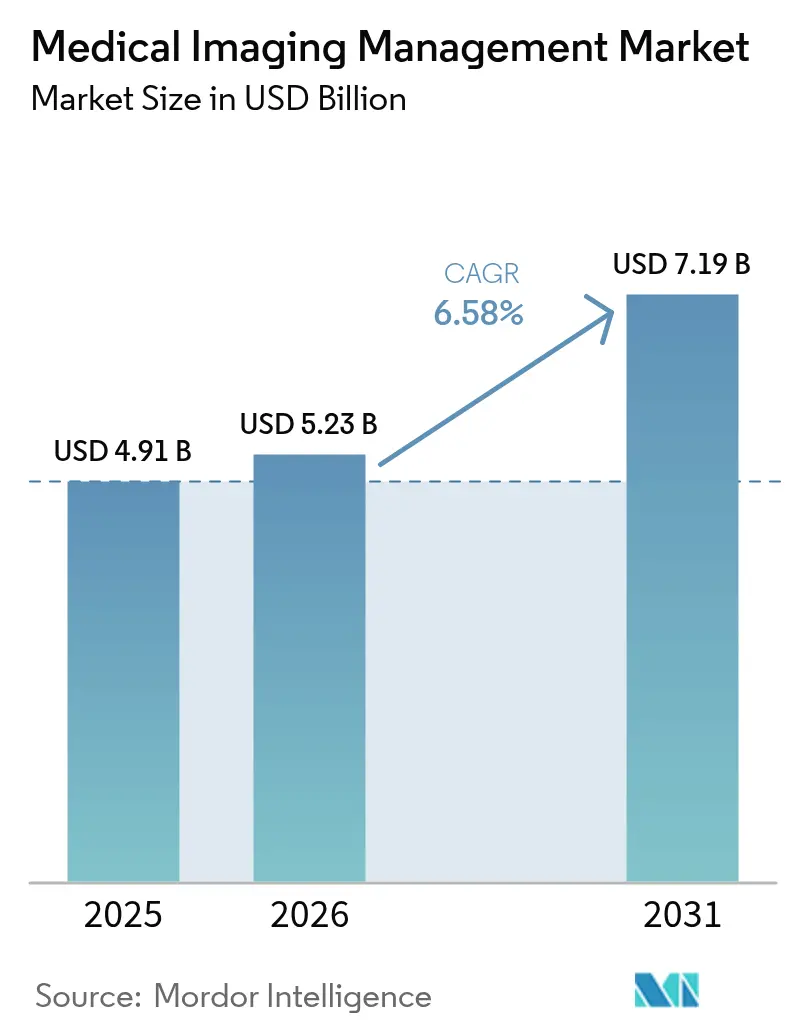
| Market Size (2026) | USD 5.23 Billion |
| Market Size (2031) | USD 7.19 Billion |
| Growth Rate (2026 - 2031) | 6.58% CAGR |
| Fastest Growing Market | Asia Pacific |
| Largest Market | North America |
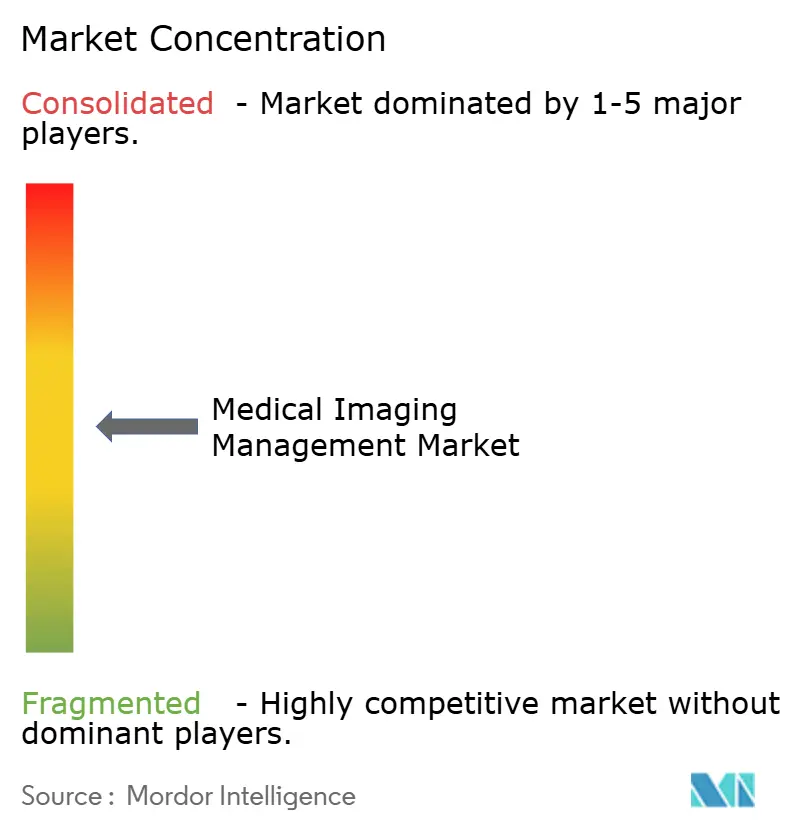
| Market Concentration | Medium |
Major Players *Disclaimer: Major Players sorted in no particular order Image © Mordor Intelligence. Reuse requires attribution under CC BY 4.0. | |
Medical Imaging Management Market Analysis by Mordor Intelligence
Medical Imaging Management market size in 2026 is estimated at USD 5.23 billion, growing from 2025 value of USD 4.91 billion with 2031 projections showing USD 7.19 billion, growing at 6.58% CAGR over 2026-2031. Demand rises because hospitals, imaging centers and outpatient facilities are moving from siloed, on-premise image archives to cloud-ready enterprise platforms that support artificial-intelligence-driven diagnostics, workflow automation and value-based care reimbursement. Cloud-native architectures, vendor-neutral archives and application-independent clinical archives together transform the storage and exchange of multi-modal imaging data, yet cybersecurity concerns and proprietary data models remain friction points for many buyers. Generative AI systems already deliver measurable productivity gains; Northwestern Medicine cut radiology report time by 15.5% and mitigates an expected shortfall of 19,500 radiologists. [1]Source: Yuta Desai et al., “Efficiency and Quality of Generative AI–Assisted Radiograph Reporting,” JAMA Network Open, jamanetwork.com
Key Report Takeaways
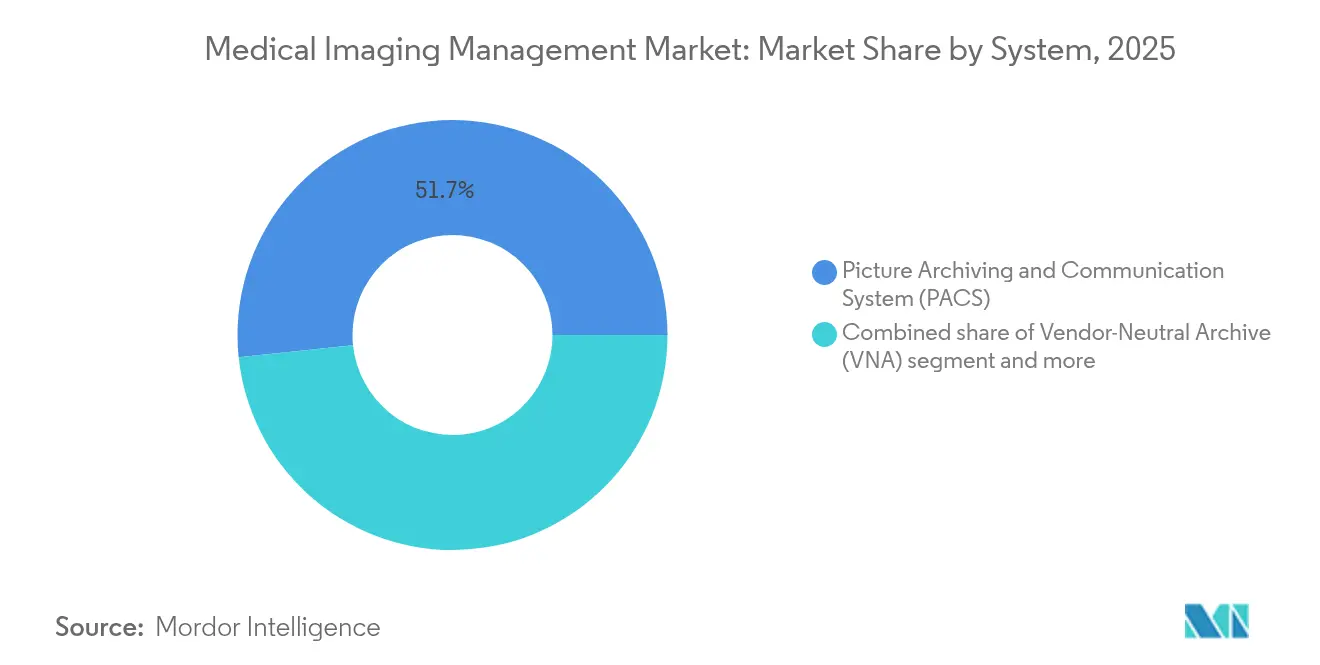
- By system, Picture Archiving & Communication Systems led with 51.65% revenue share in 2025; Vendor-Neutral Archives are projected to grow at an 7.86% CAGR through 2031.
- By deployment mode, on-premise installations accounted for 70.35% of the medical imaging management market share in 2025, while cloud-based platforms are advancing at a 7.42% CAGR to 2031.
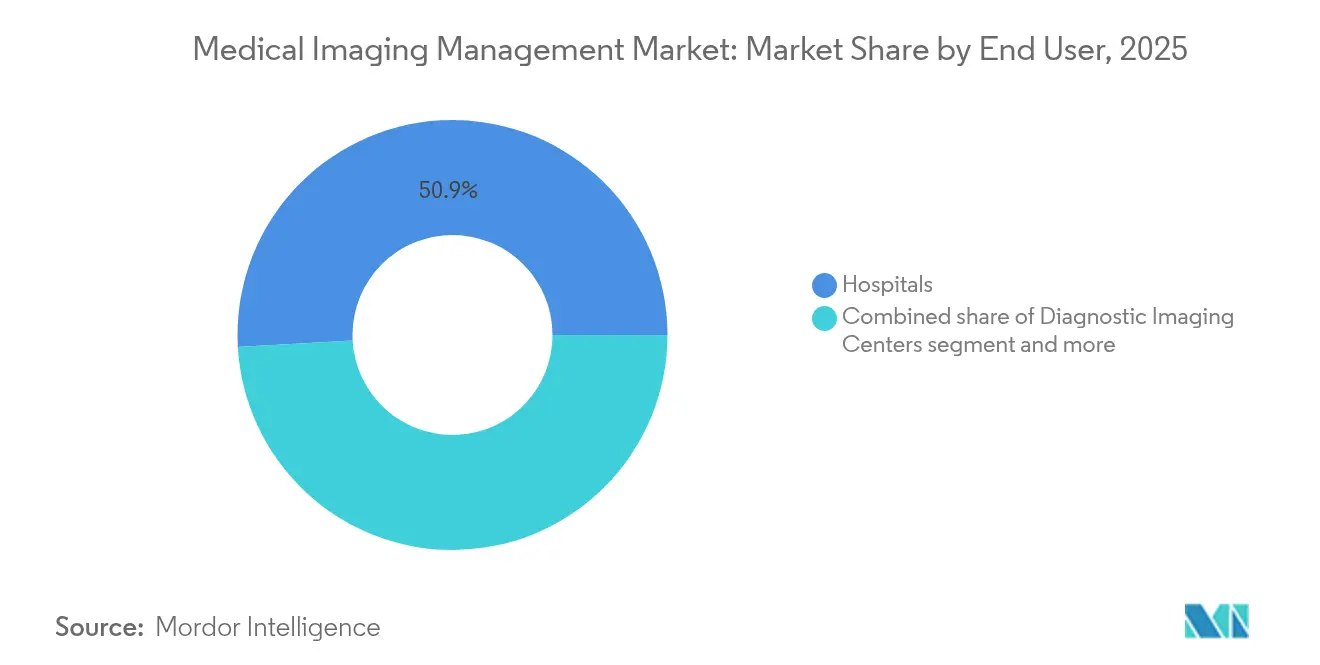
- By end user, hospitals held 50.88% share of the medical imaging management market size in 2025 and diagnostic imaging centers are expanding at an 8.11% CAGR through 2031.
- By region, North America captured 38.95% of 2025 revenue; Asia Pacific is forecast to expand at a 8.74% CAGR through 2031.
Note: Market size and forecast figures in this report are generated using Mordor Intelligence’s proprietary estimation framework, updated with the latest available data and insights as of 2026.
Global Medical Imaging Management Market Trends and Insights
Drivers Impact Analysis*
| Driver | (~) % Impact on CAGR Forecast | Geographic Relevance | Impact Timeline |
|---|---|---|---|
| Technological innovations in diagnostic imaging & image IT | +1.8% | Global, with concentration in North America & EU | Medium term (2-4 years) |
| Rising prevalence of chronic diseases | +1.2% | Global, with higher impact in aging populations of developed markets | Long term (≥ 4 years) |
| Big-data & AI integration into imaging workflows | +1.5% | North America & EU leading, APAC catching up rapidly | Short term (≤ 2 years) |
| Government incentives for healthcare IT adoption | +0.9% | North America, EU, and select APAC markets with national health programs | Medium term (2-4 years) |
| Rapid shift toward cloud-native enterprise imaging platforms | +1.3% | Global, with faster adoption in developed markets | Short term (≤ 2 years) |
| Value-based-care push for longitudinal imaging archives | +0.7% | North America primarily, expanding to EU | Long term (≥ 4 years) |
| Source: Mordor Intelligence | |||
Technological Innovations in Diagnostic Imaging & Image IT
Advanced photon-counting CT, whole-body MRI and AI-powered workflow tools are redefining how the medical imaging management market handles large image sets. The FDA cleared Ezra Flash AI for MRI noise reduction, proving that algorithmic post-processing can raise throughput without harming diagnostic integrity.[2]Source: Michael Walter, “FDA Clears Updated Ezra Flash AI Software for MRI Scans,” Diagnostic Imaging, diagnosticimaging.com Northwestern Medicine’s generative AI pilot cut average report time from 573 seconds to 435 seconds with no accuracy loss. Vendors now bundle AI deployment frameworks directly inside enterprise archives, enabling real-time inference while radiologists read studies. As a result, platforms must ingest multi-modal data streams, orchestrate AI models and archive results in longitudinal patient records. These capabilities strengthen the competitive edge of cloud-native firms that promise elastic compute and rapid algorithm updates, accelerating growth across the medical image management market.
Rising Prevalence of Chronic Diseases
Imaging utilization is climbing 3-4% yearly, whereas radiologist supply grows only 2.5%, tightening capacity constraints. Chronic cardiovascular, oncologic and neurologic conditions require repeat imaging to track disease progression. Hospitals now seek archives that collate multi-year image histories and integrate with population-health analytics. Vendor-neutral designs reduce data silos and let clinicians collaborate across organizations, a necessity for accountable-care models. Consequently, chronic-care pressures stimulate sustained adoption momentum across the medical imaging management market.
Big-Data & AI Integration into Imaging Workflows
Hospitals are pairing imaging archives with data lakes and AI orchestration layers that deliver predictive analytics at scale. Intelligent worklist balancing improved study distribution by 34% and generative AI boosted lung-nodule tracking efficiency 23% in controlled pilots. LILAC, a Weill Cornell model, now orders longitudinal CT slices with 99% accuracy, automating change detection over time. Such results convince C-suites to prioritize systems that embed algorithm marketplaces, GPU resources and audit trails. This data-centric mindset keeps the medical image management market on a rapid innovation curve.
Government Incentives for Healthcare IT Adoption
Policy drives technology upgrades. U.S. Promoting Interoperability Programs require hospitals to earn at least 60 points across e-prescribing, health information exchange and public-health reporting metrics. ONC allocated USD 86 million in 2024 for Leading-Edge Acceleration Projects focused on AI data quality and behavioral-health IT. President Biden’s FY25 budget requests USD 1.3 billion to reward hospitals that harden cybersecurity. Similar incentives in Europe and APAC reinforce spending on interoperable, secure platforms, broadening the addressable base of the medical image management market.
Restraints Impact Analysis*
| Restraint | (~) % Impact on CAGR Forecast | Geographic Relevance | Impact Timeline |
|---|---|---|---|
| High implementation & integration costs | -1.1% | Global, with higher impact on smaller healthcare providers | Short term (≤ 2 years) |
| Shortage of radioisotopes curbing SPECT / PET upgrades | -0.8% | Global, with acute impact in Europe and North America | Medium term (2-4 years) |
| Escalating cyber-attacks on imaging archives | -0.9% | Global, with higher vulnerability in under-resourced institutions | Short term (≤ 2 years) |
| Proprietary data models causing vendor lock-in | -0.6% | Global, affecting multi-vendor healthcare environments | Long term (≥ 4 years) |
| Source: Mordor Intelligence | |||
High Implementation & Integration Costs
Enterprise-grade PACS or VNA rollouts often exceed forecast budgets. One incremental-cost analysis showed that a department-wide PACS deployment struggled to deliver positive savings for high-volume specialties. Children’s Hospital of Philadelphia did save nearly USD 3 million over five years after migrating to a VNA, yet smaller providers lack the scale to absorb up-front conversion fees. Subscription cloud models reduce capital expenditure but introduce new line items such as egress charges and long-term archive fees. Cost pressure may postpone procurement among rural hospitals and independent practices, tempering short-run expansion of the medical image management market.
Escalating Cyber-Attacks on Imaging Archives
In 2024, 90% of healthcare organizations reported a data breach, with average daily ransomware losses of USD 2 million targeting diagnostic systems.[3]Source: College of Healthcare Information Management Executives, “CHIME Cheat Sheet on President’s FY25 Budget Request,” chimecentral.org The Change Healthcare incident forced payers and providers offline for weeks, spotlighting systemic risk inside centralized image exchanges. Legacy archives lack zero-trust defenses or immutable backups, making them attractive entry points. A Pennsylvania system paid USD 65 million after an attack leaked cancer-patient scans. To mitigate risk, buyers are adding multi-factor authentication, segmentation and real-time threat monitoring, steps that raise implementation cost and lengthen sales cycles for the medical image management market.
*Our forecasts treat driver/restraint impacts as directional, not additive. The impact forecasts reflect baseline growth, mix effects, and variable interactions.
Segment Analysis
By System: PACS Dominance Faces Cloud-Native Disruption
Picture Archiving & Communication Systems held 51.65% of the medical image management market share in 2025, confirming the installed base advantage of traditional radiology workstations and DICOM routers. The medical image management market size tied to PACS is forecast to grow more slowly than the overall market as vendor-neutral archives accelerate at an 7.86% CAGR. Vendor-neutral designs decouple the archive from the viewer, letting organizations cut licensing costs and integrate AI algorithms without modifying core storage.
Cloud-first providers are rewriting the competitive script. Application-independent clinical archives add a governance layer that surfaces imaging to cardiology, pathology and surgical planning apps on equal terms. Together these trends reshape the medical image management market as health systems reevaluate data-sovereignty, AI integration and disaster-recovery priorities.


By Deployment Mode: Cloud Migration Accelerates Despite Security Concerns
On-premise installations retained 70.35% of 2025 revenue, buoyed by sunk server investments and local-control preferences of large teaching hospitals. Yet cloud platforms are advancing at a 7.42% CAGR, reflecting mounting confidence in HIPAA-compliant infrastructure offered by hyperscalers. The medical image management market size for cloud deployments is projected to double by 2030 as organizations seek opex models, instant scalability and built-in analytics.
Hybrid strategies dominate transitional phases. Ambra Health relies on Google Cloud to facilitate encrypted study routing, enabling radiologists to read from anywhere while sensitive identifiers stay on-site. COVID-19 remote-reading mandates proved cloud viability, and executive teams now cite disaster-recovery strength as a leading reason to migrate archives. Even so, board-level anxiety over breach liability sustains demand for local fail-safe copies, moderating the near-term pace of full migration across the medical image management market.
By End User: Imaging Centers Drive Growth Through Outpatient Trends
Hospitals generated 50.88% of 2025 demand thanks to comprehensive modality fleets and enterprise-wide imaging initiatives. Diagnostic imaging centers, however, are tracking the fastest-growing 8.11% CAGR as payers steer non-acute scans toward lower-cost outpatient venues. The medical image management industry experiences heightened deal activity: RadNet invested more than USD 54 million on acquisitions in 2024 and continued to pick up AI startups in 2025.
Regulatory relaxations amplify that growth. States easing certificate-of-need rules now welcome new outpatient imaging builds in suburban and rural zip codes. Ambulatory surgery centers invest in lightweight VNA solutions that integrate intra-operative ultrasound, endoscopy and fluoroscopy images into same-day discharge workflows. These patterns sustain robust expansion within the medical image management market.
Geography Analysis
North America leads with 38.95% of global revenue, underpinned by mature reimbursement, robust broadband and aggressive AI pilots. Federal grants such as the USD 86 million LEAP program catalyze hospital spending on interoperable platforms that embed algorithm assurance features. Canadian provinces deploy province-wide VNAs to enable cross-site oncology consults, reinforcing regional leadership in the medical image management market.
Asia Pacific delivers the steepest growth at 8.74% CAGR to 2031. China’s regulator approved 59 AI imaging devices by mid-2023 versus nine in 2020, opening commercialization channels for cloud PACS and AI reporting add-ons. India’s insurance expansion fuels electronic-record mandates that bundle imaging libraries with revenue-cycle systems. Thailand rolled out telemedicine kiosks linking rural clinics to central radiologists, boosting demand for lightweight web viewers. Collectively, these policy shifts and capacity investments accelerate the medical image management market across APAC.
Europe posts steady uptake. GDPR pushes encryption, audit trails and consent management inside archives, while the EU AI Act labels most imaging-AI tools “high-risk,” forcing vendors to build compliance modules by February 2025. Germany, France and the UK channel national-digitization budgets into enterprise imaging backbones that federate regional hospitals. GCC countries in the Middle East modernize diagnostics for medical-tourism goals, and Latin American providers adopt cloud VNAs to sidestep capex barriers. These diverse drivers and constraints sustain mid-single-digit growth for the medical image management market across EMEA and the Americas outside North America.


Competitive Landscape
The field is moderately consolidated yet intensifying. GE Healthcare, Philips and Siemens Healthineers still dominate modality-attached PACS but face competition from cloud-native firms. GE HealthCare agreed in 2024 to buy MIM Software, adding adaptive-therapy planning and deep-learning segmentation to its Edison platform.
Start-ups exploit white spaces. Core Sound Imaging raised USD 80 million to scale Studycast, a cloud archive optimized for cardiology and point-of-care ultrasound. AIATELLA secured EUR 2 million to commercialize multi-modal vascular AI, betting on niche depth over broad modality coverage. ONRAD acquired Direct Radiology from Philips in January 2025, forming the largest independent teleradiology network in the United States.
Competitive strategy concentrates on three axes: full-stack enterprise imaging, AI workflow orchestration and cybersecurity differentiation. Vendors combining all three—plus flexible deployment—gain traction as health systems retire legacy PACS. This alignment positions them to capture incremental share in the medical image management market over the forecast horizon.
Medical Imaging Management Industry Leaders
Fujifilm Holdings Corporation
IBM Corporation
Siemens Healthineers
GE Healthcare
Koninklijke Philips N.V
- *Disclaimer: Major Players sorted in no particular order

Recent Industry Developments
- June 2025: Aiatella secured EUR 2 million to accelerate cardiovascular imaging AI for CT, MRI and ultrasound analyses in Europe and the US.
- May 2023: Nandico launched a multi-modal cloud PACS that streams CT, MRI, PET and DSA images on any device.
- February 2023: Medical imaging company Avicenna.AI launched the AI solution CINA-iPE, a CE-marked AI tool that analyzes images from chest CT scans for the presence of incidental pulmonary embolism. CINA-iPE is the first tool in CINA Incidental, a new suite of medical imaging solutions from Avicenna.AI that detect unsuspected pathologies on CT scans.


Research Methodology Framework and Report Scope
Market Definitions and Key Coverage
Our study defines the medical imaging management market as every software platform that captures, archives, indexes, routes, and displays diagnostic images for single departments or entire health systems, covering picture archiving and communication systems (PACS), vendor-neutral archives (VNA), application-independent clinical archives, enterprise viewers, and allied workflow modules.
Scope Exclusion: Imaging hardware and stand-alone AI algorithms sold without a viewing or storage layer are out of scope.
Segmentation Overview
- By System
- Picture Archiving & Communication System (PACS)
- Vendor-Neutral Archive (VNA)
- Application-Independent Clinical Archive (AICA)
- Other Systems
- By Deployment Mode
- On-premise
- Cloud-based
- Hybrid
- By End User
- Hospitals
- Diagnostic Imaging Centers
- Ambulatory Surgery Centers
- Other End Users
- By Geography
- North America
- United States
- Canada
- Mexico
- Europe
- Germany
- United Kingdom
- France
- Italy
- Spain
- Rest of Europe
- Asia Pacific
- China
- Japan
- India
- Australia
- South Korea
- Rest of Asia Pacific
- Middle East and Africa
- GCC
- South Africa
- Rest of Middle East and Africa
- South America
- Brazil
- Argentina
- Rest of South America
- North America
Detailed Research Methodology and Data Validation
Primary Research
Our analysts interviewed hospital CIOs, radiology IT heads, cloud integrators, and channel partners across North America, Europe, and Asia-Pacific. Insights on license prices, renewal triggers, and cloud migration timelines refined desk-research assumptions.
Desk Research
We began by mapping demand with WHO hospital statistics, OECD health-IT spend, Eurostat exam dashboards, and US CMS claims. FDA 510(k) filings and DICOM committee releases signposted refresh cycles. Company 10-Ks, investor decks via D&B Hoovers, and news from Dow Jones Factiva revealed revenue splits and price shifts. These sources are illustrative; many others also informed the work.
Market-Sizing & Forecasting
The 2025 baseline came from a top-down chain: regional exam volumes multiplied by digital-archive penetration multiplied by blended annual license price. Supplier roll-ups for major vendors gave a bottom-up cross-check before reconciliation. Five key drivers, including exam growth, cloud PACS uptake, VNA replacement cadence, price erosion, and targeted funding programs, powered a multivariate regression with light ARIMA smoothing to 2030. Data gaps were filled with interview midpoints.
Data Validation & Update Cycle
Mordor analysts run variance checks against customs shipment tables, Questel patent filings, and quarterly earnings. Reports refresh every twelve months, with interim updates after any material event.
Why Mordor's Medical Imaging Management Baseline Commands Unmatched Reliability
Published estimates often diverge because firms adopt different scopes, currency bases, or refresh cadences. According to Mordor Intelligence, grounding values in verified exam counts and validated price points keeps drift contained.
Key gap drivers include some publishers counting only radiology PACS, others folding hardware or RIS service fees into software totals, and a few projecting rapid cloud migration without field checks.
Benchmark comparison
| Market Size | Anonymized source | Primary gap driver |
|---|---|---|
| USD 4.91 B (2025) | Mordor Intelligence | N/A |
| USD 7.05 B (2024) | Global Consultancy A | Combines PACS with RIS and hardware fees |
| USD 3.27 B (2024) | Industry Bulletin B | Excludes enterprise viewers and AICA |
| USD 3.40 B (2024) | Trade Journal C | Focuses on specialty PACS only |
These contrasts show why our disciplined scope selection, primary validation, and annual refresh give decision-makers a balanced, repeatable baseline.


Key Questions Answered in the Report
What is the current size of the medical imaging management market?
The market is valued at USD 5.23 billion in 2026 and is projected to reach USD 7.19 billion by 2031.
Which system type holds the largest share?
Picture Archiving & Communication Systems account for 51.65% of 2025 revenue.
Why are diagnostic imaging centers growing faster than hospitals?
Outpatient cost advantages, payer steering and relaxed certificate-of-need regulations are driving an 8.11% CAGR for imaging centers.
Which region is expanding most rapidly?
Asia Pacific is expected to grow at a 8.74% CAGR through 2031 on accelerating digitization and supportive government policies.
What role does artificial intelligence play in this market?
AI improves workflow efficiency, supports predictive diagnostics and drives demand for cloud-ready archives that can deploy and monitor algorithms at scale.
Page last updated on:


