Artificial Intelligence In Healthcare Market Size and Share
Market Overview
| Study Period | 2020 - 2031 |
|---|---|
| Market Size (2026) | USD 53.61 Billion |
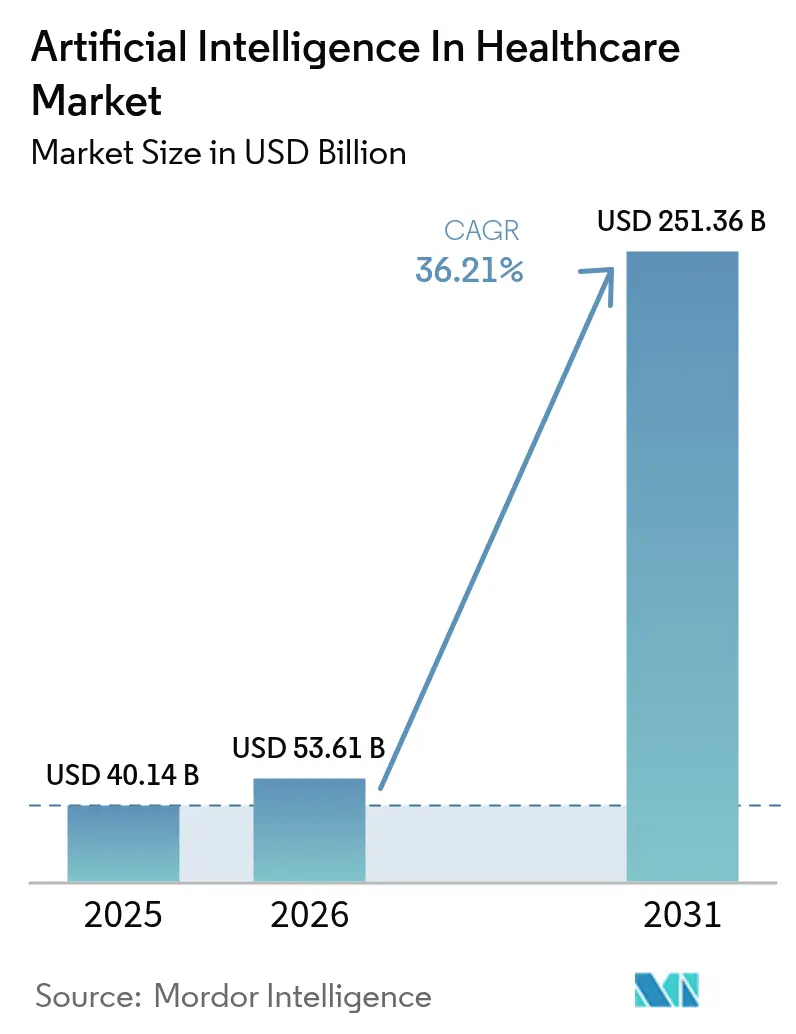
| Market Size (2031) | USD 251.36 Billion |
| Growth Rate (2026 - 2031) | 36.21% CAGR |
| Fastest Growing Market | Asia-Pacific |
| Largest Market | North America |
| Market Concentration | Low |
Major Players *Disclaimer: Major Players sorted in no particular order Image © Mordor Intelligence. Reuse requires attribution under CC BY 4.0. | |
Artificial Intelligence In Healthcare Market Analysis by Mordor Intelligence
The Artificial Intelligence In Healthcare Market size is projected to expand from USD 40.14 billion in 2025 and USD 53.61 billion in 2026 to USD 251.36 billion by 2031, registering a CAGR of 36.21% between 2026 to 2031.
Rapid scale-up signals a decisive pivot from episodic, reactive care toward algorithm-guided, preventive workflows that compress diagnostic timelines and cut per-encounter costs. North America continues to anchor demand by combining dense cloud-GPU clusters with early reimbursement pilots for AI-based radiology triage, while Asia-Pacific is moving faster on regulatory clearance and federated data-sharing frameworks that monetize fragmented datasets. Software still dominates, yet a surge in integration, retraining, and support services indicates that real-world performance hinges on long-term workflow redesign rather than one-off model deployments. Competitive intensity remains low because the artificial intelligence in healthcare market spans dissimilar use cases—from surgical robotics to fraud detection—that call for distinct data, clearances, and go-to-market strategies. Vendors that pair vertically integrated hardware with cloud-native inference pipelines are shortening deployment cycles and establishing higher switching costs.
Key Report Takeaways
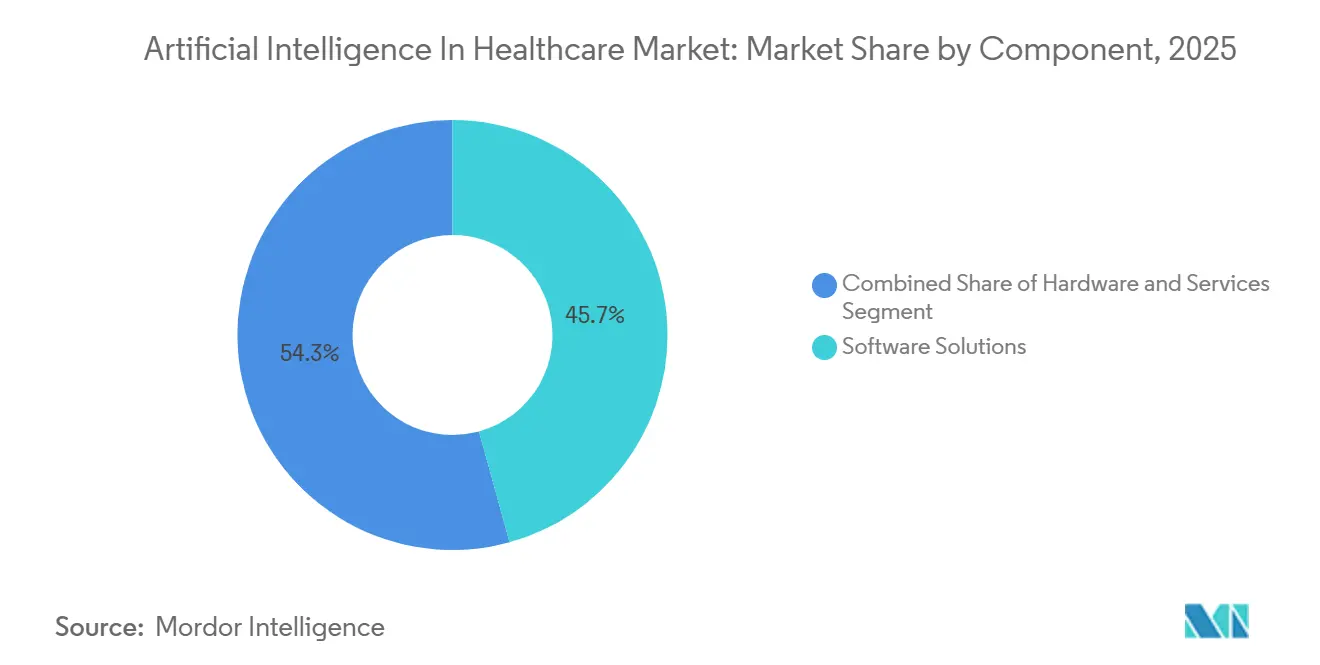
- By component, software solutions held 45.73% of artificial intelligence in healthcare market share in 2025, whereas services are projected to expand at a 39.25% CAGR to 2031.
- By technology, machine learning led with 36.82% share of the artificial intelligence in healthcare market size in 2025, but context-aware computing is forecast to post the fastest 40.62% CAGR through 2031.
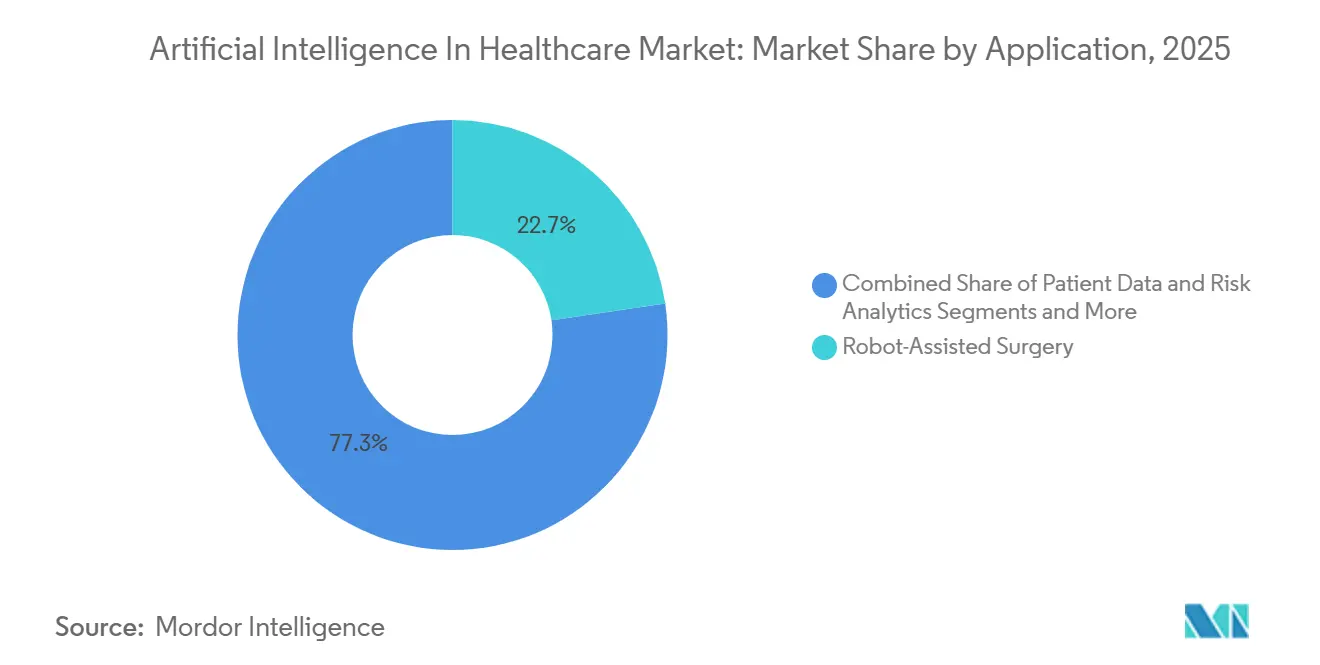
- By application, robot-assisted surgery commanded 22.66% share of the artificial intelligence in healthcare market size in 2025, while fraud detection and cybersecurity are advancing at a 38.34% CAGR to 2031.
- By end user, pharmaceutical and biotechnology companies accounted for 32.57% artificial intelligence in healthcare market share in 2025, whereas patient and consumer platforms are set to grow at a 40.67% CAGR toward 2031.
- Geographically, North America led with 52.15% artificial intelligence in healthcare market share in 2025, yet Asia-Pacific is projected to register the quickest 39.73% CAGR through 2031.
Note: Market size and forecast figures in this report are generated using Mordor Intelligence’s proprietary estimation framework, updated with the latest available data and insights as of 2026.
Global Artificial Intelligence In Healthcare Market Trends and Insights
Driver Impact Analysis*
| Driver | (~) % Impact on CAGR Forecast | Geographic Relevance | Impact Timeline |
|---|---|---|---|
| Explosion of multi-modal healthcare data fuels demand for AI platforms | 6.8% | Global, with early concentration in North America and Western Europe | Medium term (2–4 years) |
| Need to cut clinical & administrative costs amid clinician shortages | 7.2% | Global, acute in rural North America, Southern Europe, and tier-2/3 cities in India and China | Short term (≤2 years) |
| Cloud-native GPU availability lowers cap-ex barriers | 5.4% | North America, Western Europe, urban APAC hubs (Singapore, Seoul, Tokyo) | Short term (≤2 years) |
| Government reimbursement pilots for AI-radiology triage unlock adoption | 4.9% | United States (CMS), Germany, Japan, South Korea | Medium term (2–4 years) |
| Generative-AI copilots slash documentation time | 6.1% | North America, United Kingdom, Australia, early pilots in Gulf Cooperation Council | Short term (≤2 years) |
| Federated-learning consortia monetize cross-border datasets | 3.8% | European Union (GDPR-compliant frameworks), North America pharma hubs, emerging in APAC | Long term (≥4 years) |
| Source: Mordor Intelligence | |||
Explosion of Multi-Modal Healthcare Data Fuels Demand for AI Platforms
Health systems now capture genomic sequences, digital-pathology slides, wearable telemetry, and unstructured clinical notes at exabyte scale. Legacy analytics stacks cannot mine these multimodal troves, so providers are adopting tensor-processing platforms that generate actionable insights in seconds. The FDA had cleared more than 1,000 AI-enabled devices by early 2025, and nearly three-quarters serve radiology, where convolutional models analyze CT and MRI volumes at sub-second latency.[1] U.S. Food and Drug Administration, “Artificial Intelligence and Machine Learning (AI/ML)-Enabled Medical Devices,” FDA, fda.gov Reimbursement agencies are even differentiating payment codes based on whether an FDA-approved algorithm aided interpretation, creating a two-tier market. NVIDIA and GE HealthCare have embedded real-time inference engines inside scanners to eliminate back-haul latency, making bedside insights feasible.[2]NVIDIA Newsroom, “NVIDIA Announces Financial Results for Fourth Quarter and Fiscal 2024,” NVIDIA, nvidia.com In turn, vendors that unify hardware and software are gaining pricing power because hospitals favor turnkey stacks over piecemeal solutions.
Need to Cut Clinical and Administrative Costs Amid Clinician Shortages
Physician deficits are widening; the AAMC projects a U.S. shortfall of 86,000 doctors by 2036.[3]American Association of Medical Colleges, “AAMC Report Reinforces Mounting Physician Shortage,” AAMC, aamc.orgAmbient clinical-intelligence tools record encounters, auto-draft SOAP notes within 30 seconds, and pre-populate billing fields, reducing after-hours charting by up to 70% across Kaiser Permanente rollouts. Savings manifest only when rosters and panel sizes expand to absorb freed capacity, a nuance that hospitals often overlook when budgeting. Rural sites lacking specialty coverage are piloting AI triage chatbots that divert low-acuity visits to telehealth, trimming avoidable ED throughput. In Europe, nurse-vacancy rates exceeding 10% are driving adoption of scheduling algorithms that re-balance shifts and predict absenteeism.
Cloud-Native GPU Availability Lowers Cap-Ex Barriers
On-premise GPU stacks once cost more than USD 500,000 per radiology service line, excluding maintenance. Hyperscalers now rent fractional H100 cores on per-minute terms; a 200-bed hospital can run inference for under USD 2,000 each month. Out-of-the-box services like Azure AI Health Bot combine language models with HIPAA-compliant storage, cutting time-to-production from 18 months to 90 days. Yet cloud latency still hurts rural deployments reliant on low-bandwidth links, inadvertently widening care disparities. To hedge, hardware vendors are shipping edge inference cards that execute billion-parameter models locally, ensuring service continuity during outages.
Government Reimbursement Pilots for AI-Radiology Triage Unlock Adoption
CMS has introduced provisional codes that pay radiologists for AI-assisted stroke and pulmonary-embolism triage, shaving 20–40 minutes off door-to-treatment times. Japan’s SAKIGAKE pathway grants six-month conditional approval to diagnostic algorithms that show non-inferiority to specialists, accelerating commercialization. Germany started covering AI-augmented mammography in select Länder during 2024, though at fees 15–20% below double-reading protocols, limiting uptake unless volumes exceed 10,000 studies annually. Vendors able to produce standalone diagnostic reports, rather than simple alerts, qualify for higher tariffs and win faster ROI for hospital buyers.
Restraints Impact Analysis*
| Restraint | (~) % Impact on CAGR Forecast | Geographic Relevance | Impact Timeline |
|---|---|---|---|
| Opaque "black-box" models raise liability & credentialing hurdles | -3.2% | Global, acute in United States (malpractice litigation), European Union (AI Act high-risk classification) | Medium term (2–4 years) |
| Poor-quality real-world data injects bias & hampers validation | -2.8% | Global, pronounced in low- and middle-income countries with incomplete electronic health record penetration | Long term (≥4 years) |
| Shortage of clinical-AI talent inflates deployment costs | -2.1% | North America, Western Europe, urban APAC; spill-over to MEA as demand rises | Short term (≤2 years) |
| GPU supply constraints lengthen project lead-times | -1.9% | Global, exacerbated in China and Russia by export controls; secondary impact in smaller APAC markets | Medium term (2–4 years) |
| Source: Mordor Intelligence | |||
Opaque “Black-Box” Models Raise Liability and Credentialing Hurdles
Deep networks rarely expose interpretable features, so assigning fault when a model misclassifies a malignant lesion is difficult. The EU AI Act labels most clinical algorithms “high-risk,” requiring conformity assessments, post-market surveillance, and human-oversight protocols that extend clearance by 12–18 months relative to U.S. pathways. Hospital credentialing boards lack unified standards, forcing each facility to define acceptable automation thresholds. The FDA’s 2024 draft guidance states that sponsors must document training-data pedigree, yet it leaves liability allocation vague, chilling adoption in high-litigation markets
Poor-Quality Real-World Data Injects Bias and Hampers Validation
Missing socioeconomic fields exceed 30% in many EHRs, impairing algorithm accuracy in populations that diverge demographically from the training set. Nature Medicine reported a sepsis model with 12-point lower sensitivity in Black patients than in white counterparts due to under-documented vitals in safety-net hospitals. Federated learning can broaden representation, but IP disputes and audit burdens have delayed go-live dates beyond initial milestones. Vendors must now layer ISO 13485 traceability requirements onto every data pipeline, raising costs for smaller firms.
*Our forecasts treat driver/restraint impacts as directional, not additive. The impact forecasts reflect baseline growth, mix effects, and variable interactions.
Segment Analysis
By Component: Services Surge as Enterprises Discover Integration Complexity
Services revenue is set to outpace software through 2031 because hospitals realize that pilot-phase accuracy rarely survives real-world noise without continuous recalibration. In 2025 software captured 45.73% artificial intelligence in healthcare market share, yet services are growing 39.25% annually as clients pay for workflow redesign, API mapping, and model retraining. Hardware purchases remain essential, but the shift toward cloud instances and edge accelerators blunts capital outlay.
The artificial intelligence in healthcare market size for services is projected to widen as integration projects now command 1.8× the initial license fee. Custom HL7-FHIR bridges, user-training programs, and change-management sprints stretch 12–24 months, making services indispensable. NVIDIA’s CUDA lock-in still props up GPU demand, yet Intel and AMD are grabbing cost-sensitive deals by bundling open-source inference libraries.


By Technology: Context-Aware Computing Overtakes Static Pattern Recognition
Machine learning held 36.82% share in 2025, but context-aware computing will advance 40.62% CAGR as edge sensors, EHR context, and ambient audio coalesce into real-time interventions. Deep learning and transformer models continue to dominate imaging and NLP pipelines, ensuring robust throughput for stroke and hemorrhage triage.
Artificial intelligence in healthcare market size momentum is migrating toward multimodal transformers that fuse tabular labs with imaging voxels. Context-aware stacks require on-device inference to meet sub-second latency, so demand is spiking for chipsets with onboard neural processing-units from Qualcomm and Apple. Vendors tying software licenses to proprietary edge boards are carving defensible niches as hospital buyers favor integrated field support over patch-work builds.
By Application: Fraud Detection Accelerates as Payers Deploy Anomaly Engines
Robot-assisted surgery delivered 22.66% of artificial intelligence in healthcare market share in 2025, driven by Intuitive Surgical’s 8,500-plus installed da Vinci units. Yet fraud-detection engines show the strongest growth, expanding 38.34% CAGR as Medicare Advantage plans mine claims graphs for upcoding and phantom providers.
Artificial intelligence in healthcare market size for fraud and cybersecurity will climb because payers now recoup billions in improper payments. Imaging AI still advances steadily; Siemens and Philips have embedded organ-specific companions that auto-segment and quantify biomarkers. Drug discovery platforms such as Tempus and Insilico harness foundation models to compress hit-to-lead timelines by up to two years.
By End User: Consumer Platforms Capitalize on Wearable Inference
Pharma and biotech entities owned 32.57% share in 2025, yet consumer health platforms will log the highest 40.67% CAGR as wearables embed arrhythmia and sleep-apnea detection on device. Providers remain heavy adopters of radiology and ICU triage, whereas payers automate prior authorizations with natural-language robots.
Artificial intelligence in healthcare market share is fragmenting as Apple Watch and Samsung Galaxy ecosystems pump out terabytes of telemetry. Hospitals lack equivalent volume but supply labeled outcomes, creating a barter economy where device makers swap data for clinical validation. Regulators now demand that large observational datasets back consumer algorithms, nudging platforms toward hybrid trials that straddle retail and hospital settings.
Geography Analysis
North America owned 52.15% artificial intelligence in healthcare market share in 2025 due to cloud-GPU density, USD 8 billion in 2024 venture funding, and CMS reimbursement pilots. Still, fragmented interoperability and malpractice exposure elongate deal cycles by up to 18 months. Canada’s Health Data Charter finalized in 2024 allows provincial federated learning, and Mexico deployed AI diabetic-retinopathy screening in 1,200 clinics, cutting referral backlogs 40%.
Europe ranks second by revenue. Germany, France, and the United Kingdom procure AI across national systems, although AI-Act conformity extends clearance by roughly 18 months, so many vendors commercialize in the United States first. Spain’s Madrid Health Service reported 25% shorter ED wait times after 2024 acuity-prediction deployments. Italy and Spain are scaling similar tools to offset pandemic-era backlogs.
Asia-Pacific is the fastest riser in the artificial intelligence in healthcare market at 39.73% CAGR. China approved 150-plus AI devices by mid-2025, Japan broadened SAKIGAKE coverage to diagnostics, and India’s Ayushman Bharat Digital Mission integrates clinical-decision support across a 1.4 billion-person network. Domestic GPU makers lag by 30–40% on throughput, but local edge accelerators mitigate export-control friction. Australia’s TGA aligned its software-change protocol with FDA guidelines, enabling continuous learning without resubmission.
The Middle East and Africa advance through sovereign-fund investments topping USD 2 billion since 2024. The UAE runs a national federated-learning platform linking hospitals across Dubai and Abu Dhabi, and South Africa’s TB-screening pilots reached 92% sensitivity in 500 clinics, trimming diagnostic delays by two weeks. Brazil integrated AI chatbots into its national telehealth backbone in 2024, and Argentina’s private networks use radiology AI to cover underserved provinces.
Mordor Intelligence provides coverage of the artificial intelligence in healthcare market across other key regional markets, including North America, each with their regulatory frameworks and demand patterns.


Competitive Landscape
The top vendors together hold under about quarter share, so the artificial intelligence in healthcare market scores low concentration. NVIDIA anchors the infrastructure stack through CUDA and tensor-core GPUs, yet export controls create openings for Intel and AMD to bundle accelerators with looser licensing. Imaging stalwarts—GE HealthCare, Siemens Healthineers, Philips—embed AI directly in scanners, shrinking deployment times, while hyperscalers wrap pretrained models inside HIPAA clouds that shorten pilots to 90 days.
White space remains in ophthalmology, dermatology, and post-acute care where data sparsity limits model performance. Tempus raised USD 410 million in its 2024 IPO and partners with Pfizer and AstraZeneca on companion diagnostics. Butterfly Network’s handheld ultrasound with onboard AI now serves 5,000 primary-care sites that lacked imaging capacity. Startups that fixate on accuracy without seamless workflow integration underperform, as radiologists reject multi-screen toggles and alert overload.
Regulatory compliance is now table stakes. EU AI-Act alignment plus ISO 13485 quality and IEC 62304 lifecycle protocols are raising the bar for early-stage entrants. Vendors investing early in audit trails and change-control documentation face higher upfront cost but accelerate multi-country launches, giving them an edge as regional regulations converge.
Artificial Intelligence In Healthcare Industry Leaders
Microsoft Corporation
IBM Corporation
Google LLC (Alphabet)
NVIDIA Corporation
Amazon Web Services
- *Disclaimer: Major Players sorted in no particular order

Recent Industry Developments
- February 2026: India’s public and private sectors rolled out AI-powered diagnostics, telemedicine, and surveillance tools to advance universal health coverage and improve care quality.
- January 2026: The U.S. FDA signaled plans to ease oversight of digital-health products so regulations can match Silicon Valley speed.
- January 2026: The FDA cleared Aidoc’s comprehensive ED triage suite with 14 total indications powered by its CARE™ foundation model, marking the first multi-condition AI triage clearance.


Research Methodology Framework and Report Scope
Market Definitions and Key Coverage
Our study defines the artificial intelligence in healthcare market as all revenue earned worldwide from software, hardware, and service solutions that apply machine learning, computer vision, natural language processing, or similar techniques to clinical decision support, diagnostics, drug discovery, hospital workflow, patient engagement, and payer analytics within regulated provider, payer, pharmaceutical, and patient settings. We include on-premise and cloud deployments and track vendor income from new sales, licensing, subscription, and related implementation services.
Exclusion: Consumer wellness apps without medical oversight or regulatory clearance are outside scope.
Segmentation Overview
- By Component
- Software Solutions
- Hardware (Processors, Memory, Network)
- Services (Deployment, Integration, Support)
- By Technology
- Machine Learning
- Deep Learning
- Natural Language Processing
- Computer Vision & Context-Aware Computing
- By Application
- Robot-Assisted Surgery
- Medical Imaging & Diagnostics
- Patient Data & Risk Analytics
- Virtual Nursing & Administrative Assistants
- Drug Discovery & Precision Medicine
- Fraud Detection & Cybersecurity
- Others
- By End User
- Healthcare Providers (Hospitals, Clinics)
- Pharmaceutical & Biotechnology Companies
- Payers
- Patients / Consumer Health Platforms
- By Geography
- North America
- United States
- Canada
- Mexico
- Europe
- Germany
- France
- United Kingdom
- Italy
- Spain
- Rest of Europe
- Asia-Pacific
- China
- Japan
- India
- South Korea
- Australia
- Rest of Asia-Pacific
- Middle East & Africa
- GCC
- South Africa
- Rest of Middle East & Africa
- South America
- Brazil
- Argentina
- Rest of South America
- North America
Detailed Research Methodology and Data Validation
Primary Research
Mordor analysts held structured interviews with chief medical information officers, radiologists, hospital CIOs, payer analytics heads, AI product leaders, and regional regulators across North America, Europe, and Asia Pacific. Their insights on budgets, average selling prices, integration timelines, and regulatory pacing tested and refined assumptions drawn from desk work.
Desk Research
We began with public sources such as US FDA 510(k) AI device clearances, European Commission digital health surveys, WHO Global Health Observatory datasets, OECD healthcare IT spending tables, and customs logs of advanced imaging equipment. Company filings, investor decks, and peer-reviewed journals provided technology cost curves and adoption triggers. Select paid databases, Dow Jones Factiva for deal flow and D&B Hoovers for vendor revenue splits, anchored baseline inputs. The sources named are illustrative; many additional open and paid references were consulted to verify facts and close gaps.
Market-Sizing & Forecasting
A top-down model converts national healthcare spending pools into the AI addressable slice using penetration ratios for imaging workstations, EHR installations, and cloud compute. These are trended with inputs such as annual FDA AI clearances, venture funding, and skilled talent headcount. Supplier roll-ups of reported AI revenue and sampled ASP times volume checks give a bottom-up reasonableness screen. Forecasts to 2030 employ multivariate regression with scenario analysis that ties growth to GPU price decline, approval cadence, and hospital capex cycles. Where disclosures were partial, averaged ASPs from primary interviews bridged the gaps.
Data Validation & Update Cycle
Outputs pass three-layer variance checks, senior analyst review, and a final refresh before publication. Models update annually, with interim revisions triggered by material events such as landmark reimbursement decisions or major regulatory guidance.
Why Our Artificial Intelligence In Healthcare Baseline Commands Trust
Published estimates differ because firms vary scope, constant currency rules, refresh cadence, and optimism levels.
By defining scope clearly and refreshing every year, Mordor reduces hidden adjustments that distort comparisons.
Benchmark comparison
| Market Size | Anonymized source | Primary gap driver |
|---|---|---|
| USD 39.92 B (2025) | Mordor Intelligence | |
| USD 14.92 B (2024) | Global Consultancy A | Excludes implementation services and drug discovery use cases |
| USD 29.01 B (2024) | Industry Tracker B | Uses list prices without regional ASP adjustments |
| USD 26.69 B (2024) | Market Observer C | Updates biennially; omits recent FDA data |
Taken together, these contrasts show that Mordor's regularly refreshed, variable-rich framework delivers a balanced, transparent baseline that decision makers can rely on with confidence.


Key Questions Answered in the Report
How large will artificial intelligence in healthcare spending be by 2031?
Spending is projected to reach USD 251.36 billion by 2031, rising at a 36.21% CAGR from 2026.
Which region is growing fastest for AI-driven healthcare solutions?
Asia-Pacific is forecast to post the quickest 39.73% CAGR through 2031 on the back of accelerated approvals and national data-sharing infrastructures.
Which application segment is expanding most rapidly?
Fraud detection and cybersecurity applications are advancing at 38.34% CAGR as payers deploy graph-based anomaly engines to stem improper claims.
Why are services outpacing software in revenue growth?
Hospitals pay for integration, retraining, and workflow redesign services because pilot-phase accuracy degrades without ongoing optimization, driving a 39.25% CAGR for the services segment.
How does the EU AI Act affect market entry?
The Act classifies most clinical algorithms as high-risk, adding 12–18 months of conformity assessments and boosting compliance costs, which favors vendors with robust regulatory teams.
What is the main supply-chain risk facing hardware vendors?
Export controls and limited advanced GPU fab capacity extend delivery times up to nine months, prompting buyers to seek edge alternatives or older boards.
Page last updated on:


