Bioinformatics Services Market Size and Share
Market Overview
| Study Period | 2020 - 2031 |
|---|---|
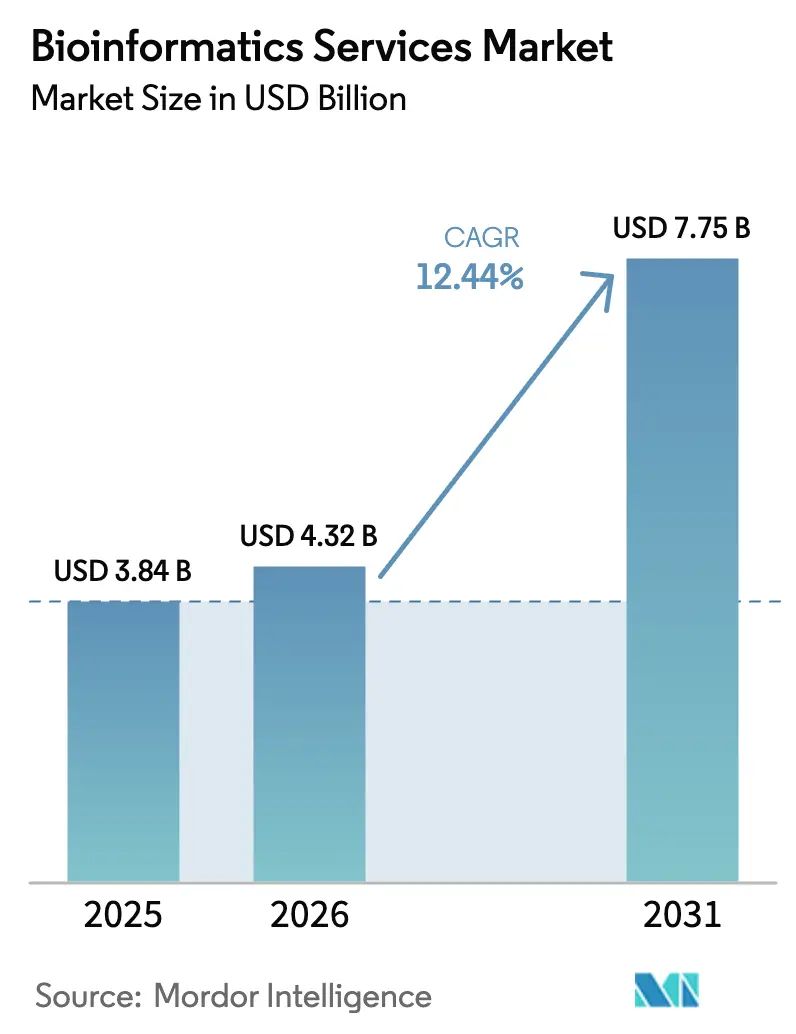
| Market Size (2026) | USD 4.32 Billion |
| Market Size (2031) | USD 7.75 Billion |
| Growth Rate (2026 - 2031) | 12.44% CAGR |
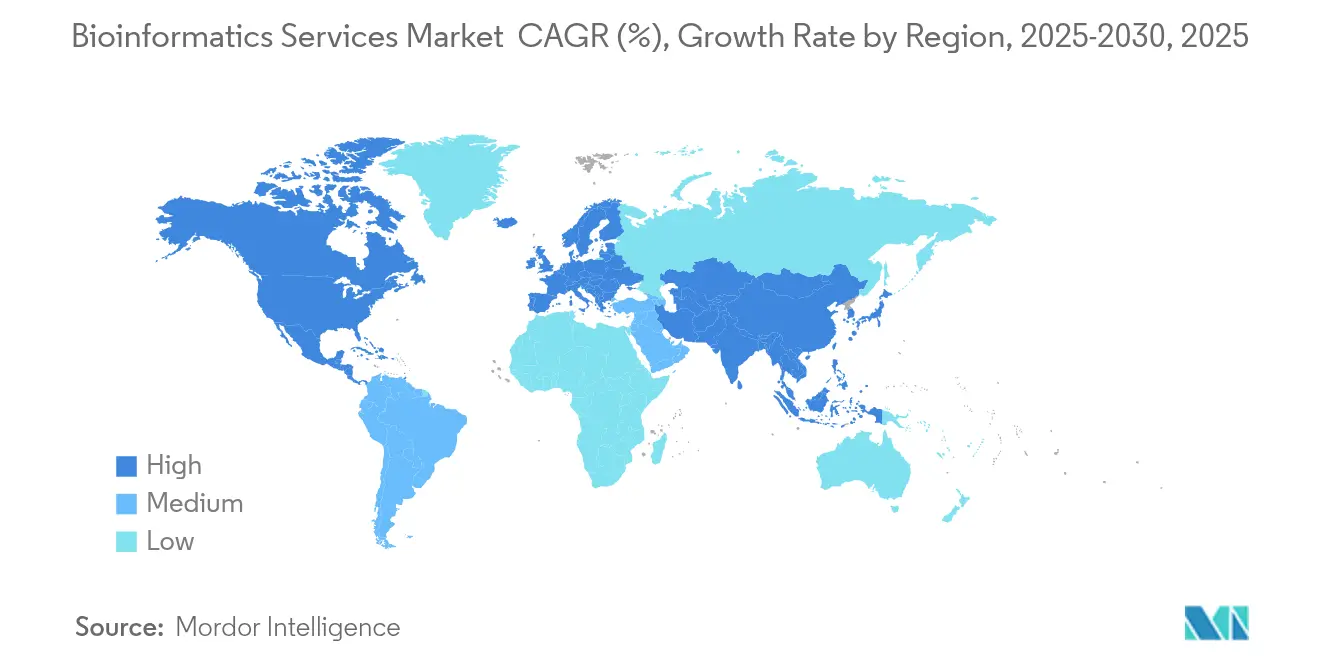
| Fastest Growing Market | Asia Pacific |
| Largest Market | North America |
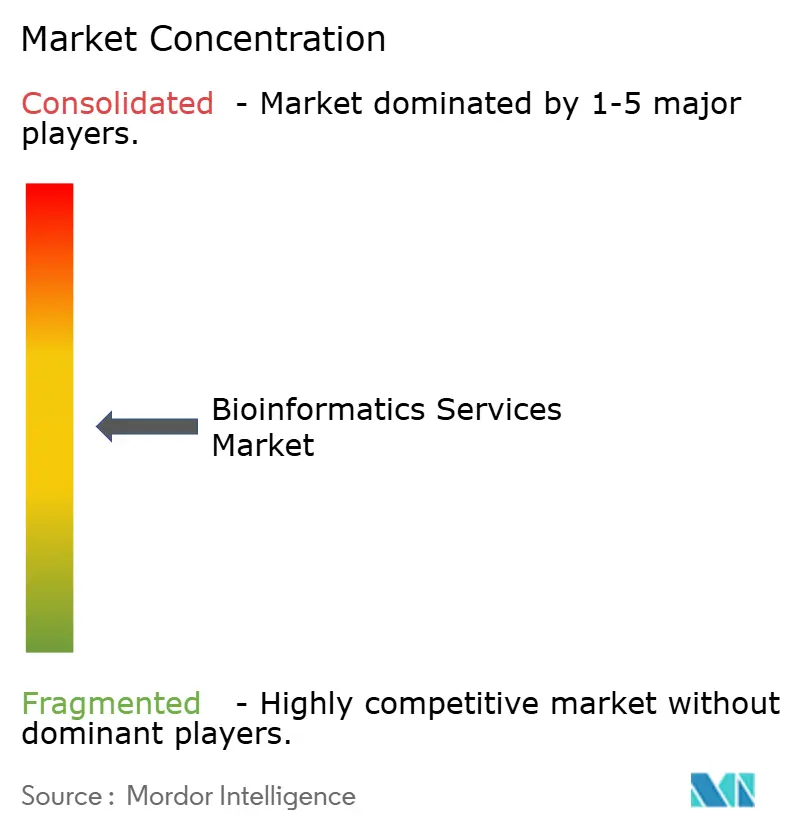
| Market Concentration | Medium |
Major Players *Disclaimer: Major Players sorted in no particular order Image © Mordor Intelligence. Reuse requires attribution under CC BY 4.0. | |
Bioinformatics Services Market Analysis by Mordor Intelligence
Bioinformatics Services Market size in 2026 is estimated at USD 4.32 billion, growing from 2025 value of USD 3.84 billion with 2031 projections showing USD 7.75 billion, growing at 12.44% CAGR over 2026-2031.
The expansion reflects a shift from conventional data processing toward AI-enabled, cloud-native platforms that deliver real-time genomic interpretation for drug discovery and clinical decision-making.[1]Teng Zhou, “Large Language Models in Genomics—A Perspective on Personalized Medicine,” MDPI, mdpi.com Pharmaceutical pipelines, national biobank releases, and multi-omics integration collectively keep analytical workloads on a steep growth curve. Governments are investing heavily in population-scale sequencing, which enlarges dataset volumes while democratizing data access for smaller firms. At the same time, escalating cloud egress fees and an acute bioinformatics talent shortage raise operating costs and slow project timelines. Providers that can embed automated AI workflows, reduce per-sample analytical cost, and navigate emerging data-sovereignty rules are capturing disproportionate demand. Early movers are also launching subscription platforms that combine analysis, storage, and compliance management, positioning the bioinformatics services market for sustained double-digit growth.
Key Report Takeaways
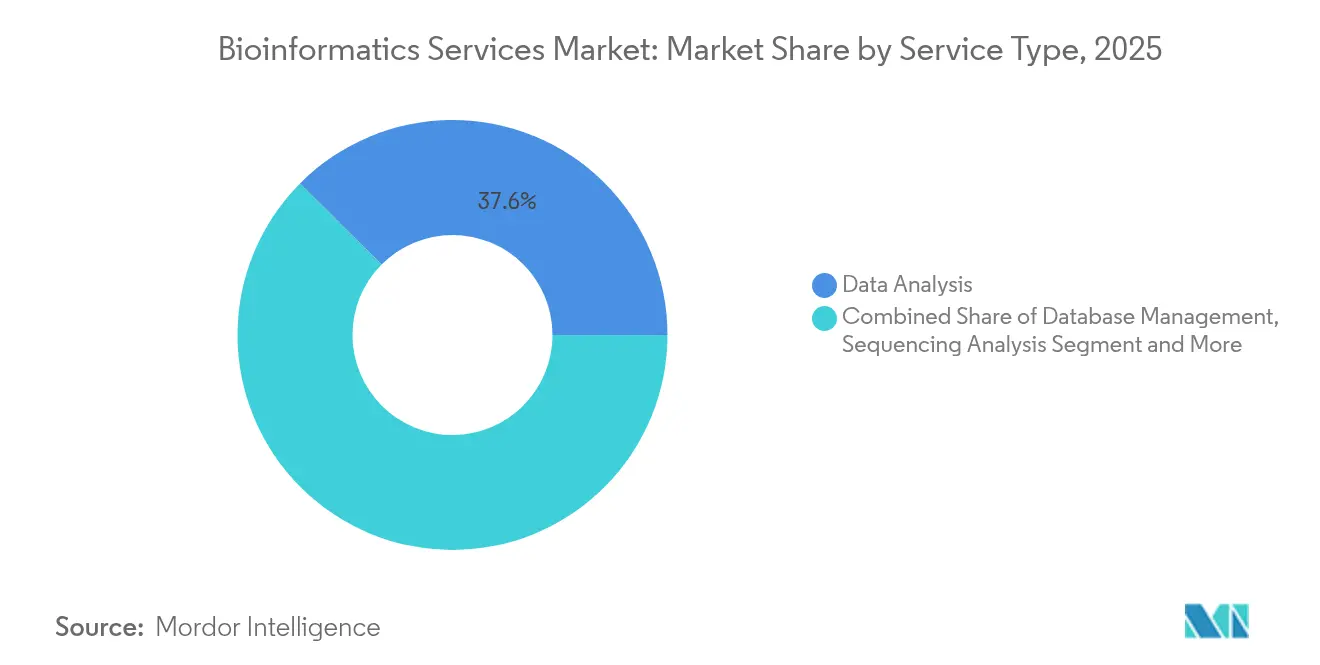
- By service type, data analysis held 37.55% of bioinformatics services market share in 2025, whereas integration & platform-as-a-service offerings are forecast to grow at an 18.08% CAGR through 2031.
- By application, genomics & proteomics commanded 41.90% revenue share in 2025; clinical diagnostics & precision medicine is projected to expand at a 19.25% CAGR to 2031.
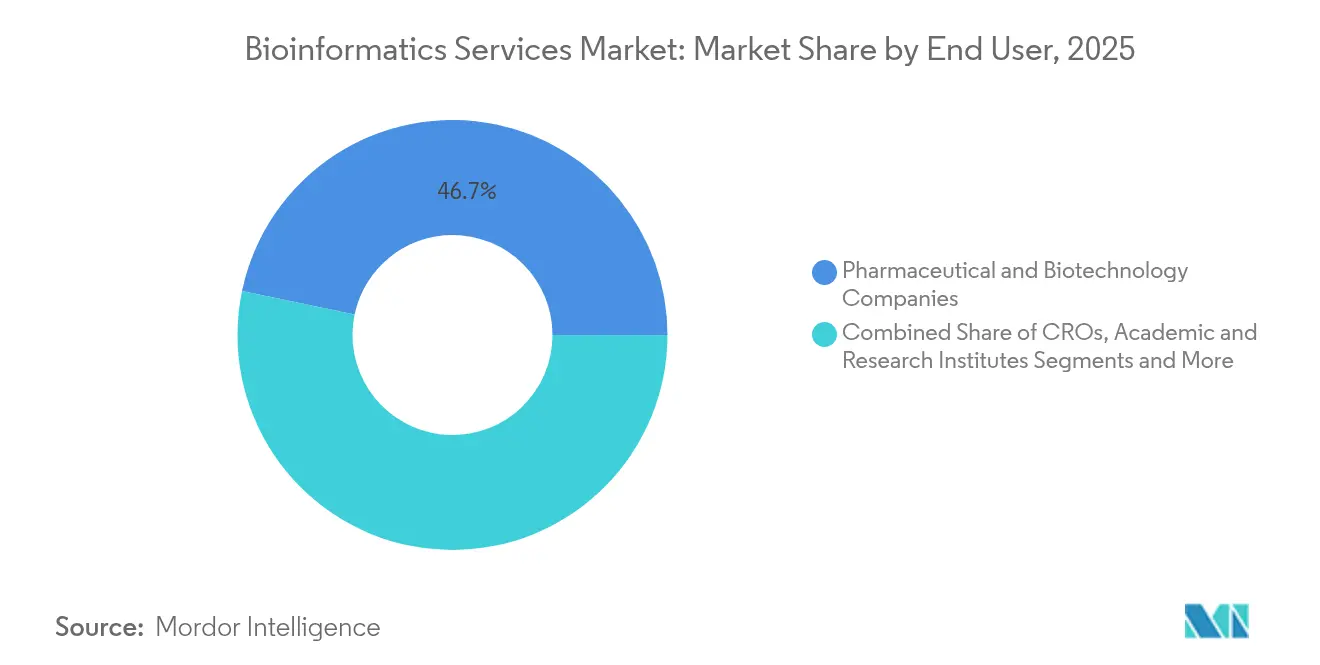
- By end-user, pharmaceutical & biotechnology firms accounted for 46.72% of bioinformatics services market size in 2025, while hospitals & diagnostic laboratories are rising at a 17.12% CAGR through 2031.
- By geography, North America led with 46.10% revenue share in 2025; Asia Pacific registers the fastest growth at a 16.62% CAGR to 2031.
Note: Market size and forecast figures in this report are generated using Mordor Intelligence’s proprietary estimation framework, updated with the latest available data and insights as of 2026.
Global Bioinformatics Services Market Trends and Insights
Drivers Impact Analysis*
| Driver | (~) % Impact on CAGR Forecast | Geographic Relevance | Impact Timeline |
|---|---|---|---|
| Rising demand for personalized medicine & precision healthcare | +2.80% | Global, led by North America & EU | Medium term (2-4 years) |
| Rapid advances in genomics & proteomics technologies | +2.10% | Global research hubs | Long term (≥ 4 years) |
| Growing use of AI/ML for large-scale multi-omics data analysis | +3.20% | North America, EU, Asia Pacific | Short term (≤ 2 years) |
| Expansion of national biobanks offering open API access to service providers | +1.90% | Europe, North America, select Asia Pacific | Medium term (2-4 years) |
| Increasing adoption of cloud-native, pay-per-use bioinformatics platforms | +1.70% | Developed markets worldwide | Short term (≤ 2 years) |
| Accelerating synthetic biology & gene-editing programs needing informatics support | +1.40% | North America, EU, China, Singapore | Long term (≥ 4 years) |
| Source: Mordor Intelligence | |||
Rising Demand for Personalized Medicine & Precision Healthcare
Global health systems are shifting from population-based regimens toward patient-specific therapy, expanding requirements for multi-omics analysis. The Human Proteome Project achieved 93% protein coverage in 2024, offering a proteomic complement to genomic stratification. Sweden’s PROMISE initiative blends omics data with real-world records, demonstrating how service providers must supply clinical-grade interpretation as well as computational pipelines.[2]Vanderbilt University Medical Center, “Genomic data in the All of Us Research Program,” nature.com Pharmaceutical sponsors increasingly demand turnkey workflows that link sequencing output to treatment recommendations, reinforcing platform-based models inside the bioinformatics services market.
Rapid Advances in Genomics & Proteomics Technologies
Sequencing cost curves continue to drop while throughput rises, generating petabyte-level datasets. Illumina’s 2025 partnership with NVIDIA places DRAGEN algorithms onto GPUs, shrinking whole-genome analysis times and broadening multi-omics adoption. Regulatory approvals such as the FDA’s 2024 clearance of the Kebilidi gene therapy highlight downstream clinical complexity that requires continuous informatics support.[3]Office of the Commissioner, “FDA Approves First Gene Therapy for Aromatic L-amino Acid Decarboxylase Deficiency,” fda.gov Single-cell and spatial omics further amplify data density, elevating demand for providers that can process millions of cell profiles with minimal latency.
Growing Use of AI/ML For Large-Scale Multi-Omics Data Analysis
Artificial intelligence is migrating bioinformatics from descriptive statistics to predictive modeling. EvolutionaryScale’s ESM3 model can simulate 500 million years of evolution to design novel proteins, illustrating how AI now generates biological hypotheses rather than merely testing them. Pharmaceutical alliances, such as NVIDIA’s 2025 collaboration with Novo Nordisk, embed bespoke AI agents into drug-discovery pipelines. Service vendors able to fine-tune large language models for specific therapeutic domains gain a differentiation edge in the bioinformatics services market.
Expansion Of National Biobanks Offering Open API Access To Service Providers
Biobank programs are converting static data repositories into dynamic research platforms. The All of Us Research Program released 245,388 clinical-grade genomes ~77% from minority cohorts, via a cloud-based workbench that reduces analysis costs and encourages global collaboration. UK Biobank now hosts over 30 petabytes of data with integrated Jupyter and RStudio environments, demonstrating a shift toward platform-only distribution that service vendors can leverage for custom analytics.
Restraints Impact Analysis*
| Restraint | (~) % Impact on CAGR Forecast | Geographic Relevance | Impact Timeline |
|---|---|---|---|
| Data Integration & Interoperability Challenges Across Heterogeneous Datasets | -1.80% | Global, with higher impact in regions with diverse data standards | Medium term (2-4 years) |
| Shortage Of Skilled Bioinformaticians And Data Scientists | -2.10% | Global, particularly acute in emerging markets | Long term (≥ 4 years) |
| Cross-Border Genomic Data Transfer Compliance Uncertainties | -1.40% | EU-US corridors, Asia Pacific cross-border collaborations | Short term (≤ 2 years) |
| Escalating Cloud-Egress Fees For Petabyte-Scale Omics Datasets | -1.20% | Global, with higher impact on cloud-dependent organizations | Medium term (2-4 years) |
| Source: Mordor Intelligence | |||
Data Integration & Interoperability Challenges Across Heterogeneous Datasets
Divergent file formats, nomenclatures, and sampling protocols often force analysts to spend more time on harmonization than on biological insight. Multi-omics integration studies report inconsistent outputs when source data vary by platform or time point, undermining clinical reproducibility. Semantic gaps inside electronic health records further impede linkage between genomic and phenotypic datasets. The European Health Data Space Regulation introduces common standards, yet simultaneously imposes new compliance audits, delaying cross-border projects during early rollout.
Shortage Of Skilled Bioinformaticians and Data Scientists
Industry estimates point to a 35% skills gap by 2030 as demand for interdisciplinary expertise outpaces academic output. Emerging markets suffer pronounced scarcity, inflating salary costs and turnover. Moreover, AI integration raises the competency bar: analysts now need fluency in Python, GPU computing, and regulatory informatics, a combination rarely found in single professionals. Smaller vendors in the bioinformatics services market struggle most, because limited cash reserves hinder aggressive hiring or up-skilling programs.
*Our forecasts treat driver/restraint impacts as directional, not additive. The impact forecasts reflect baseline growth, mix effects, and variable interactions.
Segment Analysis
By Service Type: Integrated Platforms Propel Future Growth
Data analysis services generated the largest revenue pool in 2025, capturing 37.55% of the bioinformatics services market. The segment’s dominance stems from the core requirement to convert raw FASTQ, mzML, or CEL files into interpretable biological signals. Yet platform-as-a-service offerings will outpace all other categories at an 18.08% CAGR, reflecting client preference for end-to-end, cloud-hosted workflows. Providers combining storage, AI-driven analytics, and compliance dashboards are lowering the total cost of ownership and widening the addressable demand, thereby enlarging the overall bioinformatics services market size. Database management and archival services maintain steady adoption because long-term data retention remains a regulatory necessity.
Consulting and custom workflow development record mid-single-digit growth as clients seek specialized interoperability fixes and validation documentation. The rise of subscription AI engines for drug discovery encourages smaller biotech startups to adopt pay-per-use models instead of hiring in-house data scientists, expanding the user base. As platform elasticity improves, marginal compute cost declines, enabling service vendors to bundle machine-learning pipelines that automatically recommend optimal alignment parameters. Such automation alleviates talent shortages and improves throughput across the bioinformatics services industry.


By Application: Diagnostics Surge Challenges Research-Heavy Segments
Genomics and proteomics retained 41.90% of the bioinformatics services market share in 2025, owing to heavy funding for target discovery. However, the clinical diagnostics & precision medicine niche is accelerating at 19.25% CAGR, driven by hospital adoption of next-generation sequencing panels for oncology and rare-disease screening. Every new diagnostic approval increases demand for compliant, high-confidence informatics. As a result, the bioinformatics services market size linked to clinical applications is projected to almost double by 2030.
Meanwhile, AI-assisted drug design workflows gain traction because machine learning can predict off-target effects before costly wet-lab validation. Metabolomics and transcriptomics are also climbing as researchers examine functional readouts to complement DNA sequence data. Agrigenomics and microbiome analysis provide diversification opportunities, especially in emerging economies seeking food-security solutions. Service vendors carving niches in microbiome informatics benefit from lower competitive intensity within the broader bioinformatics services industry.
By End-User: Hospital Laboratories Narrow the Gap
Pharmaceutical and biotech enterprises accounted for 46.72% of the bioinformatics services market size in 2025, reflecting continued outsourcing of sequence analysis during drug development. Yet hospital and diagnostic laboratories are advancing rapidly, supported by falling sequencing costs and value-based care initiatives. Point-of-care cancer tests now ship with built-in software that forwards raw reads to cloud pipelines and returns variant calls within hours, compressing clinical decision cycles.
Contract research organizations sustain a steady share by bundling wet-lab, in vivo, and informatics offerings. Academic institutes leverage grant-funded cloud credits to access enterprise-grade workflows without capital investment. Agricultural agencies adopt genomic selection data pipelines aimed at climate-resilient crops, a modest but expanding contributor to the bioinformatics services market. Collectively, these shifts reduce the historical dominance of pharmaceutical clients and diversify revenue.
By Deployment Model: Cloud Takes Center Stage Despite Egress Costs
Cloud-hosted configurations now underpin most new installations because elastic compute resources fit spiky, project-driven demand. The UK Biobank’s 30-petabyte, platform-only ecosystem proves that sensitive data can be managed securely at hyperscale while still complying with GDPR, encouraging similar migrations worldwide. Cloud growth also benefits from lower entry costs, bringing start-ups into the bioinformatics services market faster than on-premise procurement cycles allow.
Nevertheless, soaring egress fees for moving petabyte-scale datasets challenge budget planning, especially when multi-regional analyses require repetitive transfers. Hybrid architectures emerge as a practical compromise: raw data reside in region-locked object storage while derivative formats move to global compute zones. The European Health Data Space’s localization rules further motivate vendors to add regional availability zones, ensuring that bioinformatics services industry participants remain compliant without sacrificing analytic speed.
Geography Analysis
North America remained the largest regional contributor, holding 46.10% of global revenue in 2025. Deep pharmaceutical pipelines, ample venture funding, and an early embrace of AI-enabled bioinformatics underpin leadership. Federal projects such as the All of Us Research Program inject millions of clinically linked genomes into public clouds, sustaining service demand. Yet export-control debates and new laboratory-developed-test rules increase compliance overhead for cross-border studies.
Europe posts solid mid-teens growth aided by the EUR 45 million (USD 52 million) Genome of Europe reference-sequencing drive and the continent-wide Health Data Space framework. While strict privacy statutes raise upfront integration costs, they also create a premium for providers able to certify GDPR adherence. National initiatives like Sweden’s PROMISE demonstrate how embedded bioinformatics accelerates clinical adoption at scale.
Asia Pacific is the fastest-growing arena, clocking a 16.62% CAGR as China, Japan, and Singapore channel public funds into precision-medicine, synthetic-biology, and aging-research programs. China’s strategic focus on biotechnology rivalry with the United States keeps domestic demand elevated, though geopolitical frictions complicate overseas collaborations. Japan’s super-aged society funds multi-omics geriatric studies, whereas Singapore’s incentives lure multinational companies to regional headquarters. This diversity forces service vendors to tailor deployment models and compliance postures for each jurisdiction, yet the upside in population coverage and healthcare spending places Asia Pacific as a primary long-run engine for the bioinformatics services market.

Competitive Landscape
The vendor ecosystem is moderately fragmented, with global life-science conglomerates competing against agile specialists. Large players seek scale through mergers and platform integration; Thermo Fisher Scientific’s declaration that it could spend up to USD 50 billion on acquisitions illustrates accelerating consolidation. Strategic deals combine sequencing hardware, wet-lab reagents, and informatics into unified offerings that anchor customers in long-term ecosystems.
Technology leadership now hinges on proprietary AI pipelines capable of ingesting multi-omic data and delivering predictive biomarkers quickly. QIAGEN doubled its investment in its Digital Insights suite, committing to at least five new AI-enhanced releases in 2025. Emerging entrants harness cloud-native architectures, offering subscription plans that reduce upfront fees and speed onboarding. These challengers often partner with hyperscale clouds to access GPU clusters and global regions, allowing them to deliver enterprise-grade security without heavy capital.
White-space opportunities abound in niche verticals such as synthetic biology design tools, minimal residual disease monitoring, and microbiome analytics. Companies that couple domain-specific expertise with interoperable APIs can integrate seamlessly into pharmaceutical research pipelines, creating stickier revenue streams within the bioinformatics services market. As more petabyte-scale datasets shift to SaaS environments, integration providers able to aggregate and de-duplicate data across clouds gain strategic importance.
Bioinformatics Services Industry Leaders
CD Genomics
Charles River Laboratories
Illumina, Inc.
PerkinElmer Inc.
QIAGEN
- *Disclaimer: Major Players sorted in no particular order

Recent Industry Developments
- June 2025: NVIDIA and Novo Nordisk partnered to build AI agents for drug discovery on the Gefion supercomputer.
- May 2025: Charles River Laboratories agreed with Singapore General Hospital to supply CGMP master-cell banking and NGS testing for cord-blood CAR-T programs.
- April 2025: GeneDx acquired Fabric Genomics for up to USD 51 million, adding AI-powered interpretation for neonatal sequencing.
- January 2025: Illumina and NVIDIA integrated DRAGEN pipelines with GPU acceleration to democratize multi-omics analysis.


Research Methodology Framework and Report Scope
Market Definitions and Key Coverage
Our study treats the bioinformatics services market as all fee-based, third-party computational offerings, ranging from raw NGS read cleaning to complex multi-omics interpretation, sold to life-science, healthcare, and agri-genomic end users worldwide. Solutions bundled only as managed service layers over proprietary hardware are counted once the service component is billed separately.
Scope exclusion: internally developed in-house bioinformatics software licenses and standalone sequencing instrument sales are kept outside the sizing.
Segmentation Overview
- By Service Type
- Data Analysis
- Database Management
- Sequencing Analysis & Assembly
- Consulting & Custom Workflow Development
- Integration & Platform-as-a-Service (iPaaS)
- Others
- By Application
- Drug Design & Discovery
- Genomics & Proteomics
- Metabolomics
- Transcriptomics
- Clinical Diagnostics & Precision Medicine
- Agrigenomics & Animal Health
- Microbiome & Metagenomics
- Others
- By End-User
- Pharmaceutical & Biotechnology Companies
- Contract Research Organizations
- Academic Institutes & Research Centers
- Hospitals & Diagnostic Labs
- Agricultural & Environmental Agencies
- Others
- By Deployment Model
- On-premise
- Cloud-based
- Geography
- North America
- United States
- Canada
- Mexico
- Europe
- Germany
- United Kingdom
- France
- Italy
- Spain
- Rest of Europe
- Asia Pacific
- China
- Japan
- India
- South Korea
- Australia
- Rest of Asia Pacific
- Middle East & Africa
- GCC
- South Africa
- Rest of Middle East & Africa
- South America
- Brazil
- Argentina
- Rest of South America
- GCC
- North America
Detailed Research Methodology and Data Validation
Primary Research
We supplemented the desk work with structured discussions and short surveys covering service providers, pharmaceutical bioinformatics leads, clinical lab directors, and academic core-facility managers across North America, Europe, and Asia Pacific. These interviews clarified prevailing service mix ratios, sequencing-cost pass-throughs, and expected outsourcing intensity, helping us reconcile divergent secondary indicators.
Desk Research
We began with publicly available anchors, drawing year-base volumes and pricing cues from bodies such as the National Center for Biotechnology Information, the NIH Sequence Read Archive, Eurostat trade codes for sequencing reagents, and the World Bank's R&D expenditure tables. Patent analytics from Questel and company revenue splits accessed through D&B Hoovers let us gauge vendor exposure to outsourcing. Comparable growth signals were gathered from peer-reviewed journals and association portals like the Global Alliance for Genomics and Health, while press releases and 10-K filings provided near-term contract values and average selling prices. The secondary source list is illustrative; many additional references were examined to complete and cross-check the dataset.
Market-Sizing & Forecasting
A top-down construct converts global NGS output (in terabases) into a demand pool, applying region-specific outsourcing rates and blended service ASPs. Supplier roll-ups and sampled contract values serve as bottom-up checks to fine-tune totals. Key inputs include: average cost per whole-genome run, proportion of pharma R&D budgets allocated to external bioinformatics, cloud compute price trends, and regulatory milestones that trigger data-analysis demand spikes. Forecasts rely on multivariate regression, with sequencing cost trajectory and precision-medicine adoption indexed as leading variables; scenario analysis captures sudden shifts in public research funding. Where granular vendor data were missing, gaps were bridged with conservative proxy ratios vetted through expert calls.
Data Validation & Update Cycle
Modeled outputs face anomaly and variance screens before senior analyst review. We then benchmark against independent metrics such as cloud compute consumption reports and academic publication volumes. The model refreshes every twelve months, and interim updates are issued if material events, like a sub-USD 400 genome, alter our base case.
Why Mordor's Bioinformatics Services Baseline Earns Trust
Published figures often diverge because firms choose unequal service baskets, distinct currency bases, and inconsistent refresh cadences.
Key gap drivers here include narrower sequencing-only scopes, aggressive adoption curves untethered from funding realities, and one-off currency snapshots that obscure recent dollar strength.
Benchmark comparison
| Market Size | Anonymized source | Primary gap driver |
|---|---|---|
| USD 3.84 billion (2025) | Mordor Intelligence | - |
| USD 3.62 billion (2025) | Regional Consultancy A | counts only sequencing analytics, omits consulting and custom-workflow revenue |
| USD 6.51 billion (2025) | Global Consultancy B | bundles software license sales, applies optimistic uptake with no mid-cycle recalibration |
The comparison shows that our disciplined scope, annual refresh, and dual-track validation give decision-makers a balanced, reproducible baseline they can rely on for budgeting and strategy discussions.


Key Questions Answered in the Report
What is the projected size of the bioinformatics services market by 2031?
The market is forecast to reach USD 7.75 billion by 2031, growing at a 12.44% CAGR.
Which service type currently dominates spending?
Data analysis services lead with 37.55% revenue share, although integrated platform services are growing the fastest.
Why is Asia Pacific the fastest-growing region?
Government-backed precision-medicine programs, rising biotech investment, and expanding healthcare spending drive a 16.62% CAGR in Asia Pacific.
What is the main restraint on market growth?
A global shortage of trained bioinformaticians and data scientists is curbing scaling efforts and adding project delays.
How are AI technologies changing the competitive landscape?
Vendors integrating proprietary AI models for multi-omics interpretation offer faster, predictive insights, differentiating themselves and attracting pharmaceutical clients.
Which end-user segment is expanding most rapidly?
Hospitals and diagnostic laboratories are advancing at a 17.12% CAGR as genomic testing becomes routine in clinical care.
Page last updated on:


