Life Science Tools Market Size and Share
Market Overview
| Study Period | 2020 - 2031 |
|---|---|
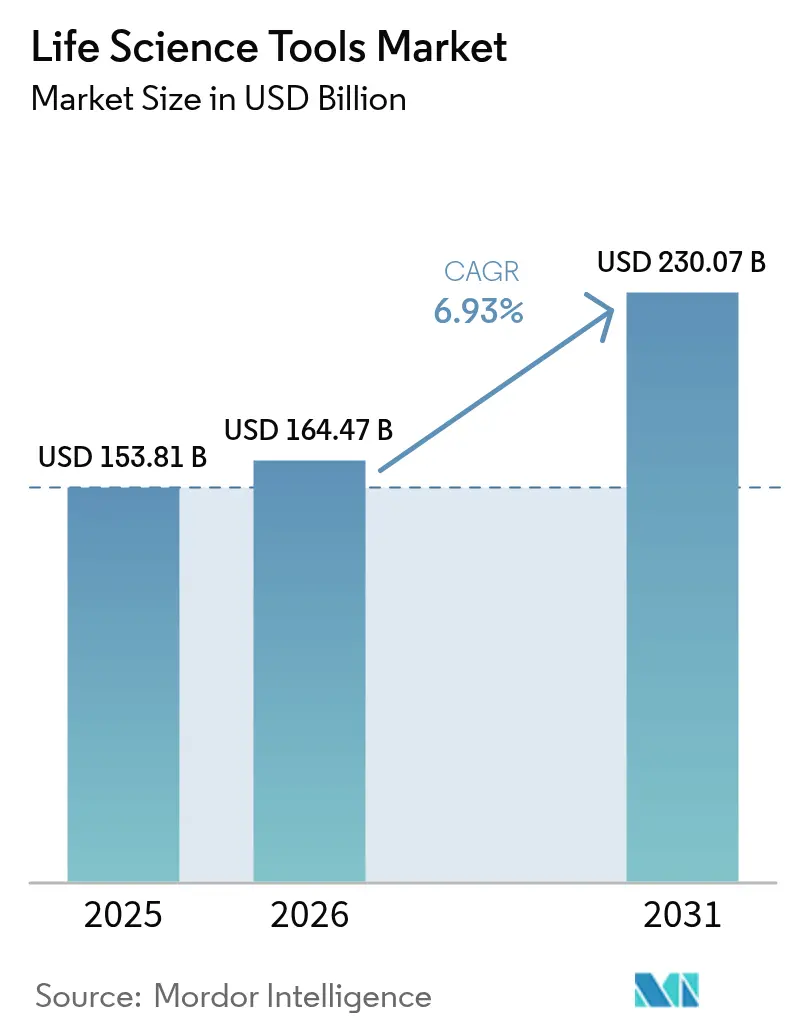
| Market Size (2026) | USD 164.47 Billion |
| Market Size (2031) | USD 230.07 Billion |
| Growth Rate (2026 - 2031) | 6.93% CAGR |
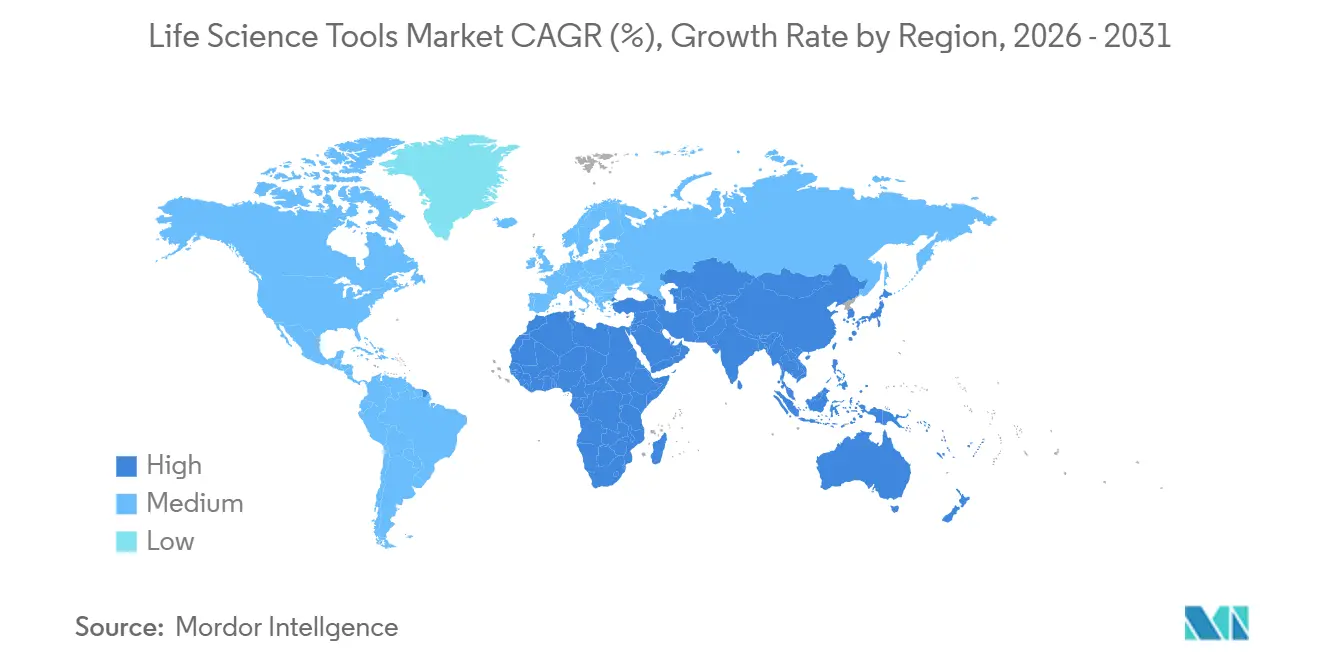
| Fastest Growing Market | Asia Pacific |
| Largest Market | North America |
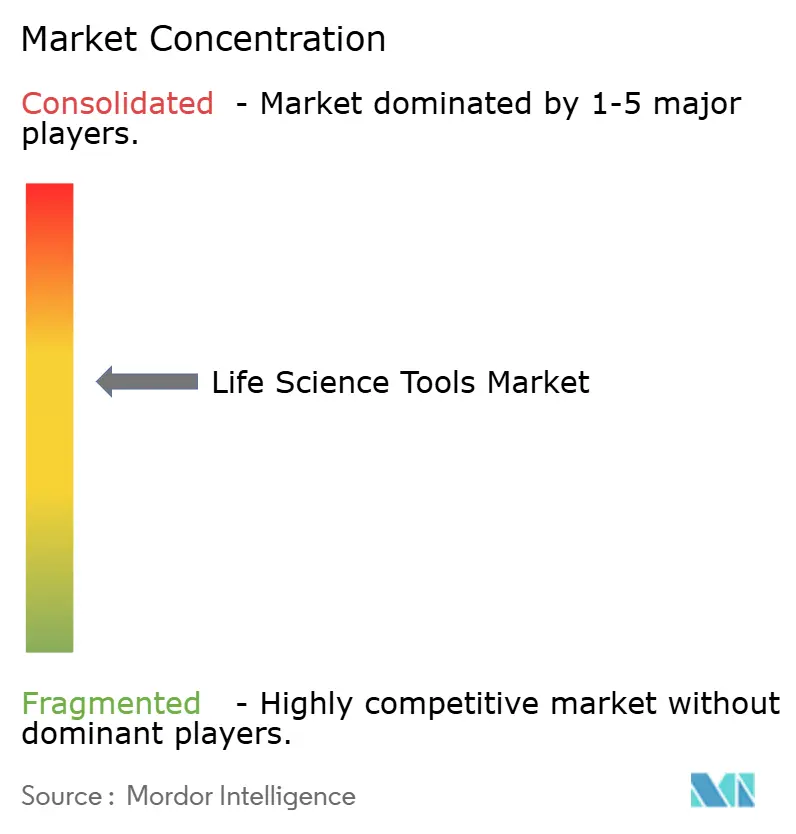
| Market Concentration | Medium |
Major Players *Disclaimer: Major Players sorted in no particular order Image © Mordor Intelligence. Reuse requires attribution under CC BY 4.0. | |
Life Science Tools Market Analysis by Mordor Intelligence
The Life Science Tools Market size is expected to grow from USD 153.81 billion in 2025 to USD 164.47 billion in 2026 and is forecast to reach USD 230.07 billion by 2031 at 6.93% CAGR over 2026-2031.
Government grants, regulatory tailwinds for lab-developed tests, and multi-omics adoption are steering capital toward automation, sequencing, and high-resolution analytical platforms. Services are expanding faster than instruments as laboratories pivot to outsourced, pay-per-use models that lower upfront costs and accelerate compliance-driven validation cycles. Falling per-genome prices have widened clinical access to next-generation sequencing, while sustained NIH and Horizon Europe budgets continue to underwrite large-scale equipment refreshes. Meanwhile, geopolitical export controls are prompting dual-sourcing strategies that favor vendors with regional manufacturing footprints.
Rising public-sector outlays, such as the United States Congress’ proposed USD 88 billion biotechnology package for 2025, coupled with stricter FDA oversight of lab-developed tests (LDTs), are reshaping compliance needs and driving fresh demand for validated instruments. Competitive momentum remains strong; established suppliers deploy mergers, acquisitions, and portfolio extensions to defend share and open new channels, yet lingering supply-chain fragilities and shortages of trained bioinformaticians temper the near-term outlook.
Key Report Takeaways
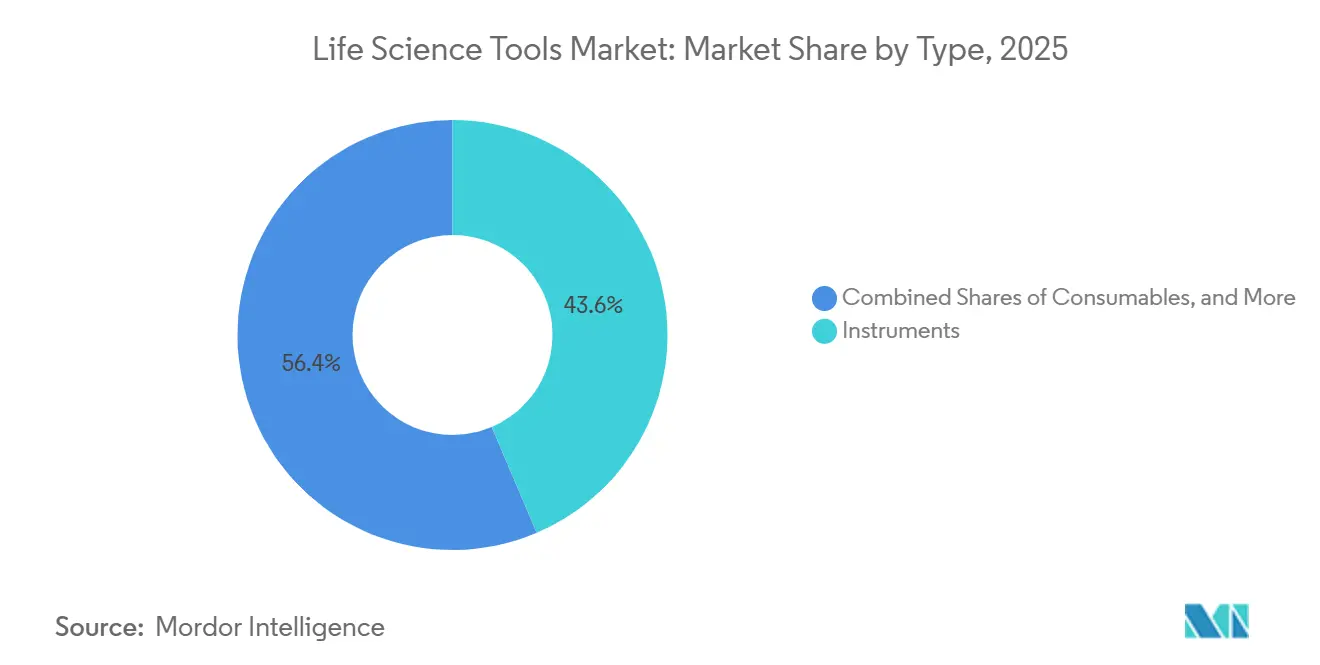
- By type, services recorded the fastest expansion at an 11.35% CAGR, while instruments retained 43.60% of the life science tools market share in 2025.
- By technology, next-generation sequencing expanded at a 16.9% CAGR; PCR & qPCR led with a 22.65% share of the life science tools market in 2025.
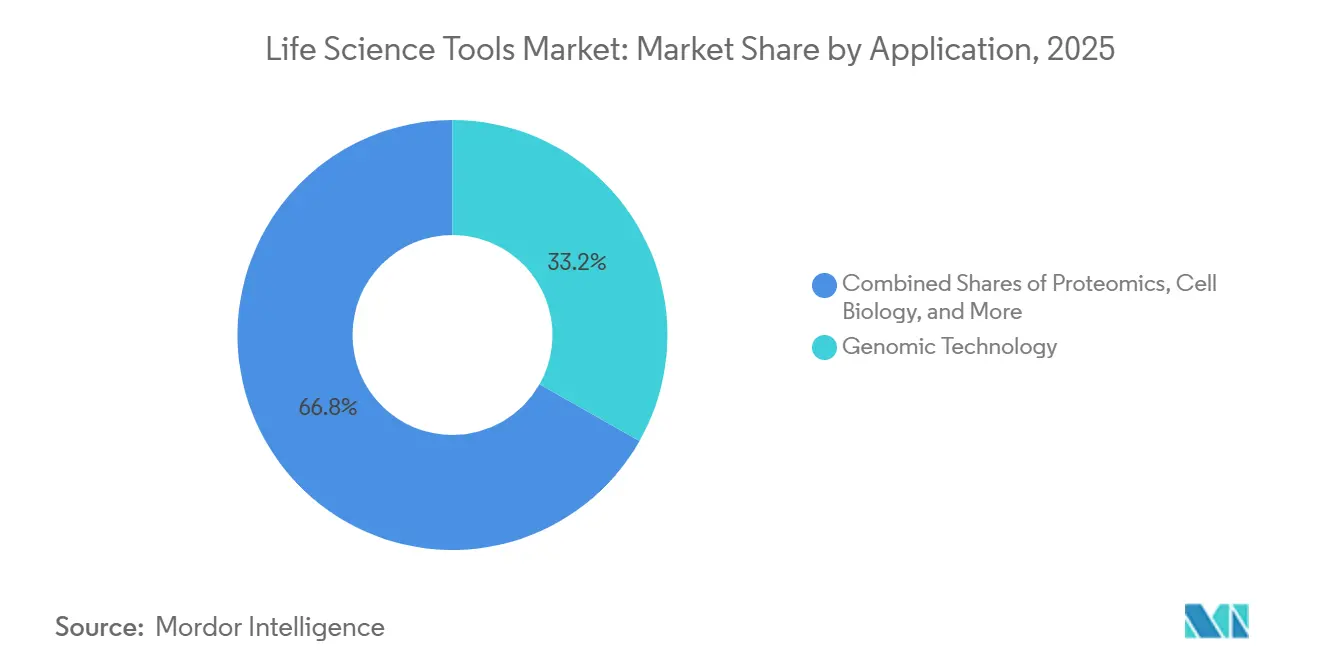
- By application, proteomics technology advanced at a 13.1% CAGR, whereas genomic technology accounted for 33.20% of the life science tools market in 2025.
- By end-user, diagnostic laboratories grew the fastest, with a 11.85% CAGR; research laboratories held 58.10% of the life science tools market share in 2025.
- Geographically, Asia-Pacific posted the highest regional CAGR of 10.95%, while North America remained the most significant regional contributor with a 40.10% share.
Note: Market size and forecast figures in this report are generated using Mordor Intelligence’s proprietary estimation framework, updated with the latest available data and insights as of 2026.
Global Life Science Tools Market Trends and Insights
Drivers Impact Analysis*
| Driver | (~) % Impact on CAGR Forecast | Geographic Relevance | Impact Timeline |
|---|---|---|---|
| Rise in demand for biopharmaceuticals & growing research funding | +1.80% | Global; strongest in North America & Europe | Medium term (2-4 years) |
| Rising incidence of infectious diseases & genetic disorders | +1.50% | Global; higher impact in APAC & Africa | Short term (≤2 years) |
| Increasing adoption of NGS & single-cell analysis platforms | +1.20% | North America & Europe core; expanding to APAC | Medium term (2-4 years) |
| Expansion of CRISPR-based core-facility workflows | +0.90% | North America & Europe; emerging in APAC | Long term (≥4 years) |
| AI-driven high-throughput automation for multi-omics prep | +0.80% | Global; led by North America | Medium term (2-4 years) |
| Emergence of decentralized bioprocess labs in LMICs | +0.60% | APAC, MEA, Latin America | Long term (≥4 years) |
| Source: Mordor Intelligence | |||
Rise in Demand for Biopharmaceuticals & Growing Research Funding
Escalating focus on large-molecule therapeutics pushes laboratories to secure advanced mass spectrometers for protein characterization and high-parameter flow cytometers for cell therapy research. The United States ARPA-H's USD 2.5 billion budget, earmarked for breakthrough health platforms, underscores the government's commitment to cutting-edge instrumentation.[1]ARPA-H, “Fiscal Year 2025 Budget Overview,” arpa-h.gov European venture funding also rose, fueling orders for contract research organizations that now handle specialized analytics that were once kept in-house. Together, these forces accelerate capital buys and recurring consumables spend, reinforcing the life science tools market growth outlook. FDA approvals of 55 novel therapeutics in 2024, 43% of which were biologics, elevated demand for upstream analytics, including high-resolution mass spectrometry and automated cell-line screening.[2]U.S. Food & Drug Administration, “Novel Drug Approvals 2024,” fda.gov Horizon Europe earmarked USD 10.3 billion for health research over 2024-2025, with 28% directed toward infectious-disease and personalized-oncology projects that procure sequencers and imaging systems.[3]European Commission, “Horizon Europe Health 2024-25,” ec.europa.eu
Rising Incidence of Infectious Diseases and Genetic Disorders
WHO surveillance flagged heightened monkeypox and avian influenza activity in 2024, compelling public health labs to expand PCR testing capacity and stock multiplex NGS panels.[4]World Health Organization, “Disease Outbreak News—Monkeypox and H5N1 Updates,” who.int In parallel, nationwide rare-disease screening in the United Kingdom expanded access to genomic testing by 25%, boosting demand for automated sample-preparation systems. The dual burden of infectious threats and hereditary conditions underscores the need for scalable, rapid-turnaround platforms, advancing the life science tools market across clinical and research environments alike. WHO confirmed 6.2 million mpox cases in 2024-2025, a 34.0% jump that spurred orders for rapid PCR diagnostics and viral genomics surveillance systems. Newborn-screening panels expanded to an average of 62 genetic conditions in 2025, up from 54 two years earlier, and increased tandem mass spectrometry utilization in metabolic panels. India allocated USD 144 million for district-level molecular diagnostic hubs, planning 1,200 real-time PCR systems and 180 benchtop sequencers by 2027. PerkinElmer’s NeoBase 2 kit, launched in 2024, reduced sample-to-result time by 22%, enabling higher newborn screening throughput.
Increasing Adoption of NGS and Single-Cell Analysis Platforms
With NovaSeq X and similar systems pushing whole-genome costs below USD 200, institutions can now pursue population-scale projects without compromising budgets. Single-cell innovations from 10x Genomics propelled instrument placements 40% higher in 2024, expanding applications in oncology and immunology. These shifts prompt facilities to reconfigure workflows around high-throughput, data-intensive approaches, spurring purchases of automated library builders and high-performance computing clusters. The United States National Cancer Institute earmarked USD 1.2 billion for single-cell atlases through 2026, which is translating into bundled cell-sorting and library-preparation purchases.
Expansion of CRISPR-Based Core-Facility Workflows
Universities and research institutes have institutionalized CRISPR services, running hundreds of edits monthly with robotic liquid handlers and GMP-grade bioreactors.[5]Broad Institute, “CRISPR Screening Core Facility Services,” broadinstitute.org Standardized protocols shorten project turnaround and escalate consumable pull-through, while therapeutic CRISPR pushes demand for purification columns and advanced analytics in regulated environments, bolstering long-term equipment sales. IDT’s Alt-R CRISPR-Cas12a Ultra, launched in March 2025, delivered 3x the editing efficiency in primary T cells, expanding cell-therapy workflows. Core facilities now bundle CRISPR kits with automated liquid handlers, trimming hands-on time by 60% and boosting reproducibility.
Restraints Impact Analysis*
| Restraint | (~) % Impact on CAGR Forecast | Geographic Relevance | Impact Timeline |
|---|---|---|---|
| High capital cost of advanced instruments | -0.40% | Global; smallest institutions hardest hit | Short term (≤2 years) |
| Stringent regulatory requirements for LDTs | -0.30% | North America & Europe; spreading worldwide | Medium term (2-4 years) |
| Shortage of skilled bioinformaticians | -0.20% | Global; most acute in APAC & emerging regions | Medium term (2-4 years) |
| Reagent supply-chain risks from export controls | -0.15% | Global; impact highest where China is primary supplier | Short term (≤2 years) |
| Source: Mordor Intelligence | |||
High Capital Cost of Advanced Instruments
Flagship mass spectrometry platforms surpass USD 1 million, placing acquisition out of reach for smaller laboratories. Academic budgets struggle to reconcile instrument upgrades with staffing needs, leading many to rely on fee-for-service core facilities. Such budget pressures slow adoption and dilute the near-term trajectory of life science tools market expansion. Thermo Fisher’s reagent-rental model allows zero upfront cost but still leaves smaller labs vulnerable to per-sample fees.
Stringent Regulatory Requirements for Lab-Developed Tests
The FDA’s 2024 LDT rule mandates extensive validation and documentation, lengthening assay launch timelines and increasing compliance expenses. Smaller diagnostic labs often retreat from innovative offerings or partner with larger networks, curbing immediate instrument purchases and dampening growth. FDA’s April 2024 rule requires high-risk LDTs to undergo pre-market review by 2027, adding document-control and validation costs. Europe’s IVDR requires a notified-body review that can cost up to EUR 150,000 per assay and take two years, pushing smaller labs to outsource. The compliance burden is concentrating testing volume at reference labs with the capacity to amortize.
*Our forecasts treat driver/restraint impacts as directional, not additive. The impact forecasts reflect baseline growth, mix effects, and variable interactions.
Segment Analysis
By Type: Services Accelerate Outsourcing Trends
Services rose fastest, with an 11.35% CAGR, as drug developers externalized analytics to control fixed costs and tap specialized expertise. Contract research organizations, now equipped with premium genomics and proteomics platforms, offer turnkey workflows that once demanded heavy in-house investment. Pharmaceutical clients value rapid capacity scaling and global site reach, propelling recurring fee income and enlarging the life science tools market.
Instruments maintained the largest share of the life science tools market at 43.60% in 2025. Capital expenditure patterns remained resilient among top-tier pharma firms and research universities, while consumables supplied roughly 60% of recurring revenue for leading vendors. Hybrid models that lease hardware bundled with services are taking hold, converting lump-sum equipment purchases into predictable operating expenses and deepening customer lock-in.


By Technology: NGS Surges While PCR Anchors Routine Workflows
Next-Generation Sequencing led technology expansion at a 16.9% CAGR. Clinical labs increasingly replace single-gene PCR assays with multi-gene NGS panels that consolidate testing and identify actionable variants. Population-scale genomics programmes from the United States to Singapore intensify instrument refresh cycles and spur upgrades to computational infrastructure, sustaining the life science tools market.
PCR & qPCR, despite ceding growth momentum, still accounted for 22.65% of the life science tools market in 2025. Its entrenched role in rapid pathogen detection and gene-expression analysis maintains a steady flow of consumables. Complementary technologies such as flow cytometry, mass spectrometry, and advanced separation systems broaden user options, ensuring diversified revenue pillars for suppliers.
By Application: Proteomics Gains Momentum
Proteomics posted the strongest 13.1% CAGR as drug discovery pivots toward functional protein readouts. Modern mass spectrometers, paired with refined sample-prep chemistries, now quantify thousands of proteins per run, fueling biomarker hunts and target-validation studies. The life science tools market benefits from elevated reagent usage and demand for high-resolution instruments optimized for intact protein and peptide analysis.
Genomic Technology accounted for 33.20% of the life science tools market in 2025. Clinical sequencing for rare diseases, oncology, and pharmacogenomics remains a consistent revenue generator. Cell biology solutions, including high-content imaging and stem-cell culture systems, complement genomic and proteomic insights, encouraging labs to build multi-omics suites that consolidate workflows and extend spending.
By End User: Diagnostic Labs Drive Clinical Adoption
Diagnostic laboratories expanded at a 11.85% CAGR as precision-medicine protocols entered routine practice. Laboratories upgraded their clinical-grade NGS rigs and installed AI-assisted interpretation software, shortening report turnaround time. Reimbursement frameworks covering genomic and proteomic tests accelerate instrument payback, energizing the life science tools market in healthcare settings.
Research laboratories accounted for 58.10% in 2025, underpinned by sustained public-sector grants and pharmaceutical R&D outlays. Core-facility consortia allow smaller departments to access premium equipment, spreading utilization and amortizing cost across investigators. Industry-academia partnerships funnel additional capital into shared instrumentation, anchoring long-term demand.
Geography Analysis
North America accounted for 40.10% of the life science tools market in 2025, buoyed by National Institutes of Health funding and a cluster of global tool makers headquartered in the United States. Robust venture capital flows into Boston and San Francisco biotech corridors reinforce equipment refresh cycles, though ageing campus infrastructure and intensifying grant competition may nudge growth toward mid-single digits.
Asia-Pacific, advancing at a 10.95% CAGR, is the fastest-growing region. China directed more than USD 15 billion to biotech programmes in 2024, while India’s USD 2.4 billion infusion supported distributed vaccine and biologics sites. South Korea and Singapore continue building world-class sequencing and cell-therapy hubs. These initiatives anchor long-run investments in high-capacity NGS, mass spectrometry, and automated bioprocessing, adding heft to the global life science tools market.
Europe posts stable, mid-single-digit gains amid macroeconomic uncertainties and rising energy costs, which weighed on new capital projects. Post-Brexit, the United Kingdom sought U.S. partnerships to maintain research momentum, while France and Switzerland remained strongholds for biologics analytics. Emerging centers in Poland and the Czech Republic adopted modular lab formats, providing fresh demand for compact instruments and entry-level consumables.

Competitive Landscape
Vendor concentration is moderate. Thermo Fisher Scientific, Danaher Corporation, and Agilent Technologies collectively hold sizable yet not dominant revenue positions, leveraging scale to invest in R&D and global distribution. Thermo Fisher’s USD 4.1 billion purchase of Solventum’s purification and filtration business in February 2025 broadened its bioprocessing suite and augmented cross-selling potential. Danaher folded Genedata’s bioinformatics stack into its portfolio in 2024, signalling a shift toward integrated hardware-software propositions.
Challengers such as Oxford Nanopore Technologies and Pacific Biosciences pursue differentiated sequencing chemistries that attract niche oncology and infectious-disease applications. AI-centric start-ups target data-analysis gaps by partnering with hardware vendors, aiming to bundle interpretation engines with instruments. Suppliers eye whitespace in decentralized manufacturing, field-deployable diagnostics, and full-workflow automation, areas where incumbents have limited penetration.
Strategic plays span technology licensing, region-specific manufacturing, and co-development alliances with pharma. For instance, Thermo Fisher partnered with the National Cancer Institute on the myeloMATCH trial, embedding its sequencing tools into a high-profile precision oncology study. Waters, Bruker, and BD launched application-specific columns, imaging profilers, and automated prep stations, respectively, sharpening competitive differentiation while expanding addressable spend.
Life Science Tools Industry Leaders
Illumina, Inc
Thermo Fisher Scientific Inc.
F. Hoffmann-La Roche Ltd.
Qiagen N.V.
Agilent Technologies Inc.
- *Disclaimer: Major Players sorted in no particular order

Recent Industry Developments
- February 2026: Ginkgo Bioworks and OpenAI demonstrated an AI platform that autonomously executed 36,000 cell-free protein-synthesis reactions, cutting costs by 40%.
- January 2026: Illumina unveiled the Billion Cell Atlas, the first tranche of a 5-billion-cell perturbation resource for AI-driven drug discovery.
- January 2026: MGI launched ATOPlex Fast NiV packages for Nipah virus whole-genome surveillance, offering both targeted and metagenomic workflows.
- January 2026: Synthego entered the molecular and clinical-diagnostic reagent market, expanding its CRISPR product portfolio for regulated testing environments.
- February 2025: Thermo Fisher Scientific acquired Solventum’s Purification and Filtration Business for USD 4.1 billion, adding roughly USD 1 billion in bioprocess revenue and targeting USD 125 million in year-five synergies.
- January 2025: Siemens Healthineers closed its USD 5.1 billion purchase of Dotmatics to integrate scientific informatics with laboratory automation.


Global Life Science Tools Market Report Scope
As per the scope, life science tools include consumables, instruments, reagents, and other services used to study various areas of biotechnology, genetics, molecular biology, and cell biology.
The life science tools market is segmented by product, technology, application, end-user, and geography. By product, the market is segmented into instruments, consumables, and services. By technology, the market is segmented into PCR & qPCR, sanger sequencing, separation technologies, flow cytometry, nucleic acid microarrays, mass spectrometry, and other technologies. By application, the market is segmented into proteomics technology, genomic technology, cell biology technology, and other applications. By end-user, the market is segmented into research laboratories, diagnostic laboratories, and other end users. By geography, the market is segmented into North America, Europe, Asia-Pacific, the Middle East & Africa, and South America. The market report also covers estimated market sizes and trends for 17 countries across major regions worldwide. The report offers the value (in USD) for the above-mentioned segment
| Instruments |
| Consumables |
| Services |
| PCR & qPCR |
| Sanger Sequencing |
| Next-Generation Sequencing (NGS) |
| Spatial-Omics & Single-Cell Platforms |
| Separation Technologies |
| Flow Cytometry |
| Mass Spectrometry |
| Nucleic-Acid Microarray |
| Automation & Robotics Platforms |
| Other Technologies |
| Genomic Technology |
| Proteomic Technology |
| Cell Biology Technology |
| Drug Discovery & Development |
| Clinical Diagnostics |
| Other Applications |
| Research Laboratories |
| Diagnostic Laboratories |
| Biopharmaceutical Companies |
| Other End-Users |
| North America | United States |
| Canada | |
| Mexico | |
| Europe | Germany |
| United Kingdom | |
| France | |
| Italy | |
| Spain | |
| Rest of Europe | |
| Asia-Pacific | China |
| India | |
| Japan | |
| Australia | |
| South Korea | |
| Rest of Asia-Pacific | |
| Middle East and Africa | GCC |
| South Africa | |
| Rest of Middle East and Africa | |
| South America | Brazil |
| Argentina | |
| Rest of South America |
| By Type | Instruments | |
| Consumables | ||
| Services | ||
| By Technology | PCR & qPCR | |
| Sanger Sequencing | ||
| Next-Generation Sequencing (NGS) | ||
| Spatial-Omics & Single-Cell Platforms | ||
| Separation Technologies | ||
| Flow Cytometry | ||
| Mass Spectrometry | ||
| Nucleic-Acid Microarray | ||
| Automation & Robotics Platforms | ||
| Other Technologies | ||
| By Application | Genomic Technology | |
| Proteomic Technology | ||
| Cell Biology Technology | ||
| Drug Discovery & Development | ||
| Clinical Diagnostics | ||
| Other Applications | ||
| By End-User | Research Laboratories | |
| Diagnostic Laboratories | ||
| Biopharmaceutical Companies | ||
| Other End-Users | ||
| By Geography | North America | United States |
| Canada | ||
| Mexico | ||
| Europe | Germany | |
| United Kingdom | ||
| France | ||
| Italy | ||
| Spain | ||
| Rest of Europe | ||
| Asia-Pacific | China | |
| India | ||
| Japan | ||
| Australia | ||
| South Korea | ||
| Rest of Asia-Pacific | ||
| Middle East and Africa | GCC | |
| South Africa | ||
| Rest of Middle East and Africa | ||
| South America | Brazil | |
| Argentina | ||
| Rest of South America | ||


Key Questions Answered in the Report
How big is the life science tools market in 2026?
The life science tools market stands at USD 164.47 billion in 2026 and is forecast to reach USD 230.07 billion by 2031 at a 6.93% CAGR.
Which segment shows the fastest growth?
Next-Generation Sequencing technology posts the top growth rate at 16.9% CAGR through 2031, driven by cost reductions and expanded clinical use.
Which region leads future expansion?
Asia-Pacific records the highest regional CAGR at 10.95%, supported by sizable public-sector biotechnology investments and manufacturing build-outs.
Why are services becoming so important?
Pharmaceutical and biotech companies outsource analytics to control fixed costs and access specialised expertise, pushing the Services segment to an 11.35% CAGR.
What regulatory changes affect market growth?
The FDA’s 2024 final rule on Lab-Developed Tests increases validation and documentation requirements, adding complexity and cost for clinical laboratories.
Page last updated on:


