Biotechnology Market Size and Share
Market Overview
| Study Period | 2020 - 2031 |
|---|---|
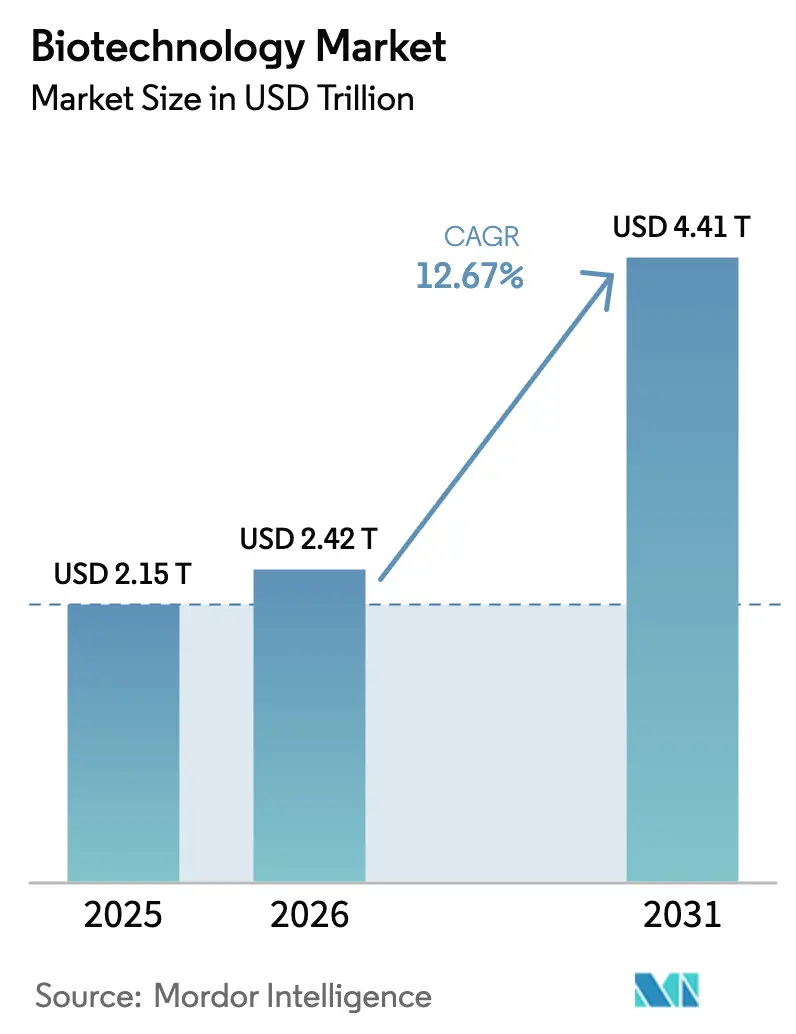
| Market Size (2026) | USD 2.42 Trillion |
| Market Size (2031) | USD 4.41 Trillion |
| Growth Rate (2026 - 2031) | 12.67% CAGR |
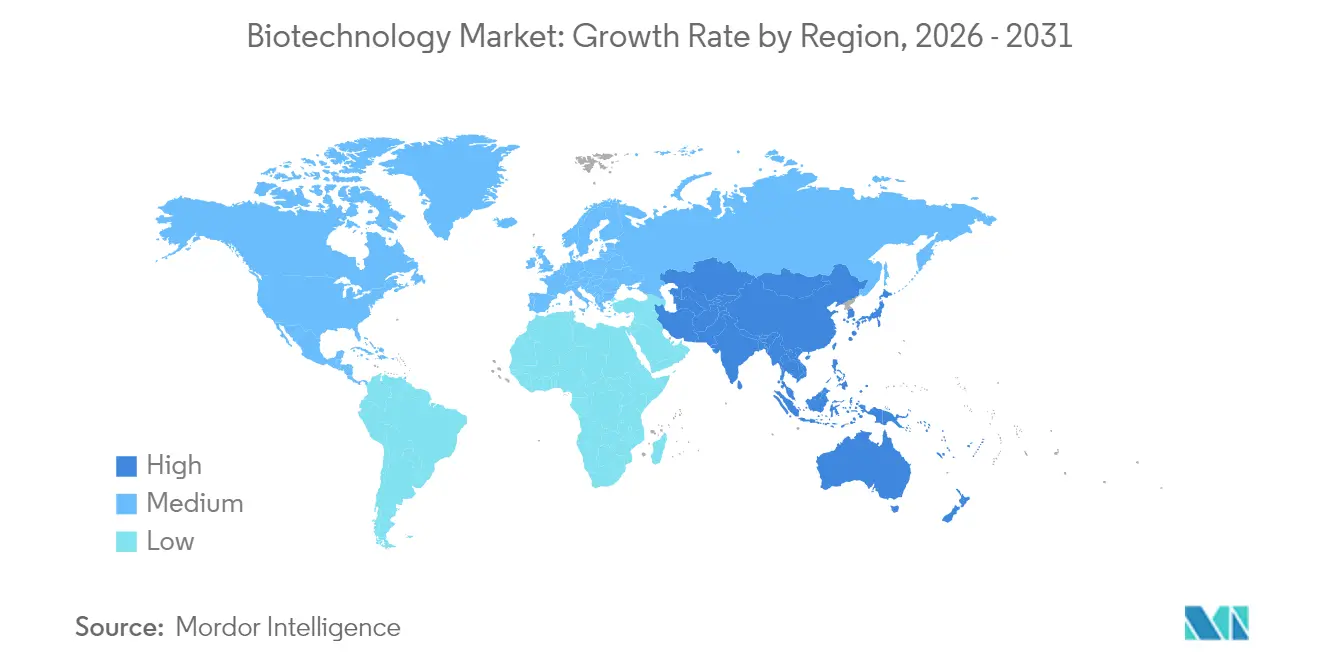
| Fastest Growing Market | Asia Pacific |
| Largest Market | North America |
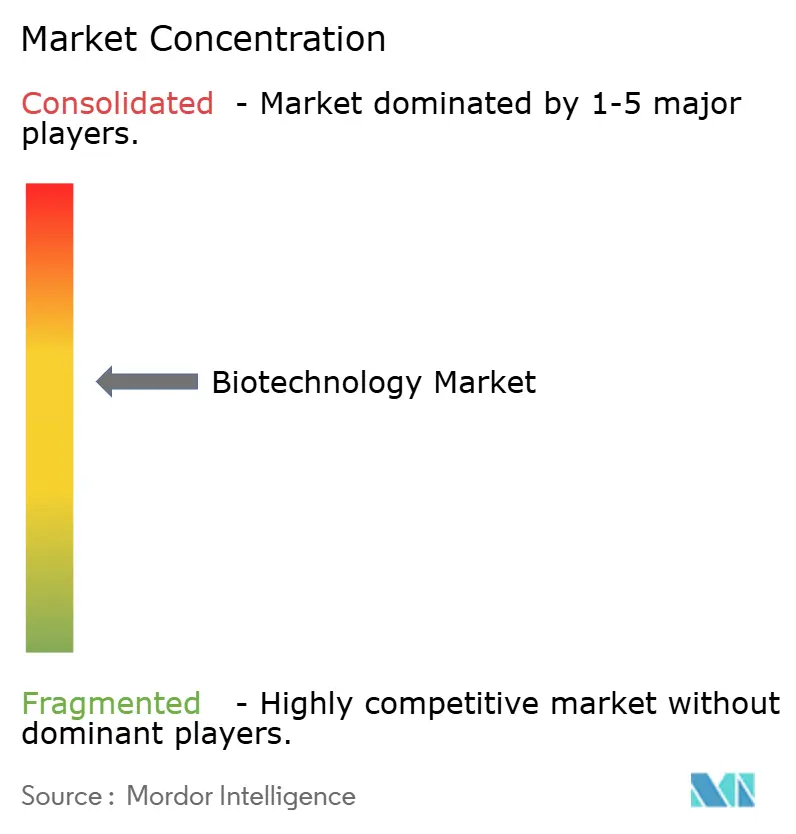
| Market Concentration | Medium |
Major Players *Disclaimer: Major Players sorted in no particular order Image © Mordor Intelligence. Reuse requires attribution under CC BY 4.0. | |
Biotechnology Market Analysis by Mordor Intelligence
The Biotechnology Market size is projected to expand from USD 2.15 trillion in 2025 and USD 2.42 trillion in 2026 to USD 4.41 trillion by 2031, registering a CAGR of 12.67% between 2026 to 2031.
Biotechnology Market Overview
The trajectory rooted in the sector’s evolution from conventional drug manufacturing to an AI-enabled precision-medicine ecosystem.[1]European Commission, “Building the Future with Nature: Boosting Biotechnology and Biomanufacturing in the EU,” research-and-innovation.ec.europa.eu Accelerated regulatory pathways, such as the FDA’s breakthrough-therapy approvals for gene and cell therapies in 2024-2025, continue to shorten commercialization timelines and strengthen revenue visibility. Governments are amplifying spending on bio-economy programs Japan alone allocated JPY 110 billion (USD 760 million) for regenerative-medicine research while the U.S. Department of Energy approved a USD 213 million loan to expand biochemical production capacity. Capital-intensive capacity expansions from Eli Lilly and Novo Nordisk, together exceeding USD 8.6 billion, underline manufacturers’ confidence in long-run product demand. Artificial-intelligence partnerships with OpenAI and similar providers are becoming table stakes for discovering, designing, and optimizing biologics pipelines, driving higher R&D efficiency across the biotechnology market.
Key Report Takeaways
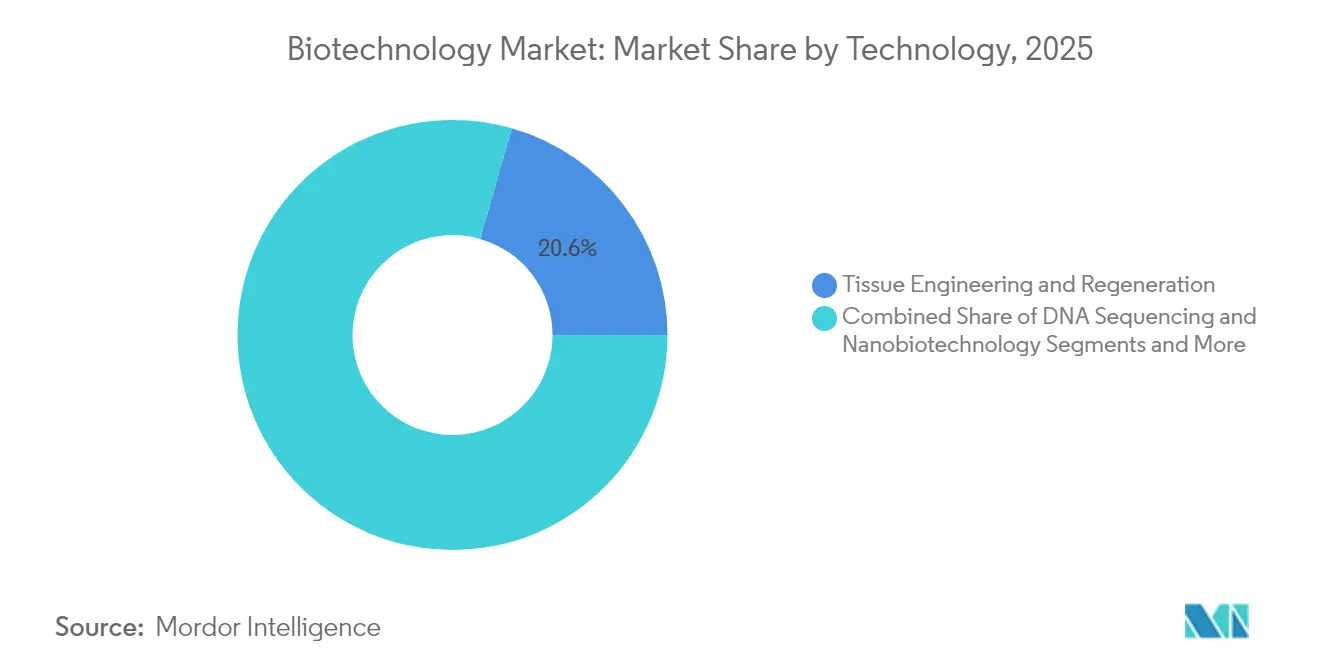
- By technology, Tissue Engineering & Regeneration held 20.55% of biotechnology market share in 2025, while Next-Generation Sequencing is projected to advance at a 21.4% CAGR through 2031.
- By application, Health biotechnology accounted for a 48.85% share of the biotechnology market size in 2025 and Bioinformatics & Omics applications are set to expand at a 22.1% CAGR to 2031.
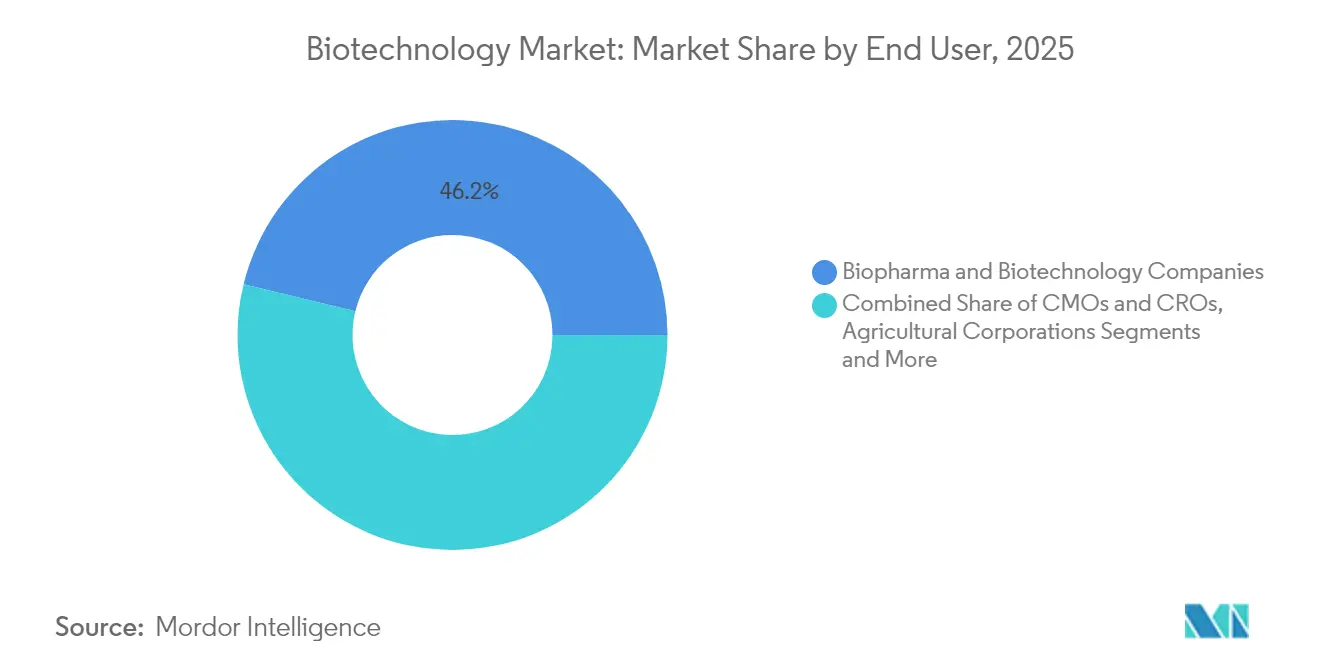
- By end user, Pharmaceutical & Biotechnology Companies commanded 46.20% of biotechnology market share in 2025; Academic & Research Institutes record the strongest growth at 17.6% CAGR through 2031.
- By product type, Biopharmaceuticals represented 45.35% of the biotechnology market size in 2025, whereas Bioinformatics Platforms are forecast to accelerate at a 16.2% CAGR between 2026-2031.
- Geographically, North America led with 44.90% revenue in 2025 and Asia-Pacific’s portion of the biotechnology market size is projected to grow at 16.95% CAGR over the same outlook.
Note: Market size and forecast figures in this report are generated using Mordor Intelligence’s proprietary estimation framework, updated with the latest available data and insights as of 2026.
Global Biotechnology Market Trends and Insights
Drivers Impact Analysis*
| Driver | ( ~ ) % Impact on CAGR Forecast | Geographic Relevance | Impact Timeline |
|---|---|---|---|
| Accelerated demand for novel biologics & gene-based therapeutics | +2.8% | Global, North America and EU concentration | Medium term (2-4 years) |
| Rapid cost decline in high-throughput sequencing | +2.1% | Global, strongest in APAC markets | Short term (≤ 2 years) |
| Government bio-economy stimulus and pandemic-era R&D tax credits | +1.9% | North America and EU primary, APAC secondary | Long term (≥ 4 years) |
| M&A race for AI-driven drug-discovery platforms | +1.7% | Global, major biotech hubs | Medium term (2-4 years) |
| Emergence of cell-free biomanufacturing micro-plants | +0.9% | North America and EU early adoption | Long term (≥ 4 years) |
| Synthetic biology-enabled carbon-negative materials | +0.8% | Global, EU regulatory leadership | Long term (≥ 4 years) |
| Source: Mordor Intelligence | |||
Accelerated Demand for Novel Biologics and Gene-Based Therapeutics
Recent approvals of first-in-class gene therapies for rare diseases validate genetic medicine’s transition into commercial practice, spurring manufacturers to scale continuous bioprocessing capacities and invest in single-use technologies that cut changeover times and reduce contamination risks.[2]Abeona Therapeutics, “FDA Approves Zevaskyn,” drugs.com Premium pricing for regenerative products Humacyte’s SYMVESS vessel sells for USD 29,500 per unit—illustrates the economic potential that attracts new entrants and capital. AI-powered patient stratification tools are boosting trial success, highlighted by Genmab’s epcoritamab combination achieving 87% response in refractory lymphomas. Together these factors raise the ceiling on the biotechnology market revenue pool and reinforce demand visibility across pipeline stages.
Rapid Cost Decline in High-Throughput Sequencing
Sequencing-cost freefalls underpin the sector’s shift into population-scale diagnostics and real-time pathogen surveillance. Illumina’s USD 425 million SomaLogic acquisition signals strategic intent to merge proteomic data streams with genomics for multi-omic analytics.[3]Illumina, “SomaLogic Acquisition,” biopharmadive.com Machine-learning-driven classifiers now surpass 90% accuracy in cancer subtype detection, propelling multi-omic integration into routine clinical workflows. Improved reagent yields and lab automation further cut per-sample cost, widening access for academic labs and smaller firms, thereby democratizing innovation within the biotechnology market.
Government Bio-Economy Stimulus and Pandemic-Era R&D Tax Credits
Public investment remains a cornerstone of long-term growth. The U.S. biomass-supply strategy outlines coordinated efforts across research, demonstration, and commercialization to de-risk scale-up for sustainable feedstocks.[4]U.S. Department of Agriculture, “Building a Resilient Biomass Supply,” usda.gov Europe’s proposed Biotech Act targets streamlined approvals and access to EUR 52 billion in trade surplus, supporting more than 900,000 jobs. Germany’s 78% rise in biotechnology financing to EUR 1.917 billion in 2024 points to capital availability aligned with government priorities. Such measures reduce early-stage risk, accelerating lab-to-market timelines across the biotechnology market.
M&A Race for AI-Driven Drug-Discovery Platforms
Platform consolidation is reshaping competitive dynamics. The USD 688 million Recursion-Exscientia merger assembled a unified computational-experimental drug-discovery engine that can iterate molecule design cycles rapidly. Eli Lilly’s USD 1.3 billion Verve Therapeutics buyout demonstrates Big Pharma’s appetite for gene-editing assets capable of single-dose cures. As AI reduces discovery timelines, access to proprietary algorithms and curated datasets becomes a strategic differentiator in the biotechnology market.
Restraints Impact Analysis*
| Restraint | ( ~ ) % Impact on CAGR Forecast | Geographic Relevance | Impact Timeline |
|---|---|---|---|
| Shortage of bioprocessing single-use-systems specialists | -1.4% | Global, acute in North America and EU | Short term (≤ 2 years) |
| Regulatory lag on multi-omic companion diagnostics | -1.1% | Global, complex in EU | Medium term (2-4 years) |
| Rising bio-geopolitical export controls on genetic data | -0.8% | Global, US-China tensions primary | Long term (≥ 4 years) |
| Volatility in venture funding for platform-only start-ups | -0.7% | Global, major biotech hubs | Short term (≤ 2 years) |
| Source: Mordor Intelligence | |||
Shortage of Bioprocessing Single-Use-Systems Specialists
Rapid facility build-outs have outpaced human-capital growth, producing acute shortages in single-use-technology operators despite Novo Nordisk’s 1,000-job expansion in North Carolina. The skills gap slows facility validation and jeopardizes on-time product launches, pushing firms to partner with universities for bespoke curricula and ramp up internal training programs. In emerging markets, limited educational pipelines exacerbate the constraint, tempering infrastructure utilization and near-term revenue realization within the biotechnology market.
Regulatory Lag on Multi-Omic Companion Diagnostics
Frameworks governing AI-enhanced, multi-omic diagnostics remain fragmented. Divergent requirements across FDA, EMA, and national notified bodies lengthen approval times and inflate development costs. Algorithm-updating rules, bias detection, and evidence thresholds lack harmonization, forcing firms to pursue country-by-country strategies that deter global launch sequencing and delay revenue capture in the biotechnology market.
*Our forecasts treat driver/restraint impacts as directional, not additive. The impact forecasts reflect baseline growth, mix effects, and variable interactions.
Segment Analysis
By Technology: Regenerative Medicine Drives Innovation
Tissue Engineering and Regeneration captured 20.55% of biotechnology market revenue in 2025, reflecting the transition of engineered-tissue constructs from laboratory prototypes to clinically reimbursed products. Approvals such as Humacyte’s SYMVESS vessel validated commercial pathways and enhanced investor confidence. The segment’s expanding therapeutic breadth, spanning vascular trauma and organ repair, is projected to reinforce its leadership position through 2031.
Next-Generation Sequencing is forecast to register a 21.4% CAGR, the fastest across technologies. As cost per genome continues to fall, sequencing platforms increasingly integrate AI modules that accelerate variant interpretation, propelling broad adoption in oncology, infectious-disease surveillance, and agricultural genomics. In parallel, CRISPR and gene-editing toolkits benefit from smoother regulatory reviews and mature manufacturing protocols, elevating their share in the overall biotechnology market.


By Application: Health Dominance with Digital Transformation
Health biotechnology accounted for 48.85% of 2025 revenue, anchored by strong biopharmaceutical demand and high reimbursement levels for life-saving therapies. This segment’s dominance is expected to persist as gene-edited treatments and cell therapies commercialize at premium price points. Digital health platforms that integrate omics data are boosting patient stratification, improving outcomes, and thereby reinforcing payer support.
Bioinformatics and Omics, projected to climb at 22.1% CAGR, embodies the field’s shift toward data-centric value creation. AI-enabled multi-omics platforms streamline target discovery and diagnostic decision-making, catalyzing new service models for precision medicine. As digital tools proliferate, application diversity expands, further enlarging the biotechnology market opportunity landscape.
By End User: Academic Institutions Accelerate Growth
Pharmaceutical and Biotechnology Companies controlled 46.20% of revenue in 2025, leveraging large R&D budgets and deep commercialization expertise. Nonetheless, Academic & Research Institutes represent the fastest-growing end-user group, advancing at an 17.6% CAGR thanks to sustained public funding and collaborative frameworks that shorten the pathway from discovery to license deals. Outsourcing to CMOs and CROs also rises, as specialized manufacturing and regulatory expertise become increasingly vital to capitalize on the biotechnology market.
By Product Type: Bioinformatics Platforms Surge
Biopharmaceuticals remained the anchor, holding 45.35% of global revenue in 2025. High therapy prices and steady uptake of monoclonal antibodies and gene therapies underpin growth. Yet Bioinformatics Platforms & Software are set to grow 16.2% annually, powered by demand for advanced analytics, cloud computing, and AI-driven modeling. Continuous bioprocess equipment innovation supports rapid scale-up, sustaining both established and emerging product segments across the biotechnology market.
By Color Biotechnology: Red Leadership with Green Expansion
Red Biotechnology dominates value creation via pharmaceutical and medical applications. Green Biotechnology, however, is rapidly expanding on the back of CRISPR-edited crops and precision-fermentation proteins that align with sustainability mandates. White Biotechnology industrial bioprocesses displacing petrochemicals gains traction as corporates prioritize scope-3 emissions reduction. These color-coded sub-segments collectively diversify revenue streams, reinforcing resilience within the broader biotechnology market.
Geography Analysis
North America retained 44.90% of global revenue in 2025, supported by dense innovation clusters, favorable intellectual-property regimes, and swift regulatory approvals. Flagship investments, such as Eli Lilly’s USD 4.5 billion Medicine Foundry, illustrate manufacturers’ confidence in domestic supply-chain stability. Federal loan guarantees for bio-based facilities and coordinated agency oversight further lower financing risk and accelerate product launch cycles, cementing regional leadership across the biotechnology market.
Asia-Pacific represents the fastest-growing region with 16.95% CAGR, catalyzed by significant public funding and lower operating costs. Japan’s JPY 110 billion regenerative-medicine program demonstrates strategic ambition to become a “land of drug discovery,” while China’s policy support and India’s green-transition agenda underpin manufacturing expansion. Cross-border partnerships accelerate technology transfer, fostering a dynamic environment that enhances the region’s share of the biotechnology market.
Europe benefits from robust infrastructure, high ethical standards, and the forthcoming Biotech Act designed to streamline approvals. Germany’s 78% jump in biotechnology financing to EUR 1.917 billion underscores investor appetite. Major capacity additions by Boehringer Ingelheim and Sanofi augment the continent’s manufacturing base. Europe’s focus on sustainable biotechnology reinforces its competitive advantage in green applications, strengthening its position in the global biotechnology market.

Competitive Landscape
Market structure remains moderately fragmented but is shifting toward consolidation. High-profile deals Roche-Poseida (USD 1.5 billion) and Illumina-SomaLogic (USD 425 million) underscore the premium placed on transformative platforms and intellectual property. AI-centric companies command outsized valuations, reflecting the technology’s ability to compress discovery timelines and de-risk clinical development.
Emerging players leverage synthetic biology to create carbon -negative materials, positioning sustainability as a differentiator. ZymoChem’s sugar-to-polymer platform exemplifies this shift, opening white-space opportunities that incumbents are beginning to chase. Patent activity in CRISPR and advanced manufacturing intensifies, with firms racing to secure freedom-to-operate and first-mover advantage in the expanding biotechnology market.
Strategic collaborations between biopharma and cloud-computing firms deepen data-analytics muscle. For example, large language models now facilitate automated trial-patient screening, boosting enrollment rates and lowering administrative costs. As competition pivots on digital capabilities, access to scalable computing and specialized talent determines winners, rendering the biotechnology market increasingly data-driven.
Biotechnology Industry Leaders
Thermo Fisher Scientific Inc.
Biogen Inc.
Novozymes A/S
Vertex Pharmaceuticals Inc.
BioNTech SE
- *Disclaimer: Major Players sorted in no particular order

Recent Industry Developments
- June 2025: Eli Lilly agreed to acquire Verve Therapeutics for USD 1.3 billion, strengthening its gene-editing pipeline.
- June 2025: Illumina finalized the USD 425 million SomaLogic purchase, adding proteomics to its multi-omic suite.
- May 2025: FDA cleared Zevaskyn, the first autologous gene therapy for recessive dystrophic epidermolysis bullosa.
- March 2025: FDA approved Attruby for ATTR-CM, featuring near-complete transthyretin stabilization


Research Methodology Framework and Report Scope
Market Definitions and Key Coverage
Our study defines the biotechnology market as all revenues generated from technologies that deliberately use living organisms or their derivatives, such as recombinant DNA tools, advanced fermentation, gene-editing platforms, and bio-informatics software, to create health, agricultural, industrial, and environmental solutions.
Scope exclusion: sales from traditional small-molecule generics or purely chemical crop-protection agents are kept outside the sizing to avoid double counting.
Segmentation Overview
- By Technology
- DNA Sequencing
- Nanobiotechnology
- Tissue Engineering & Regeneration
- PCR Technology
- Fermentation
- Chromatography
- Gene Amplification Technologies
- Synthetic Biology
- CRISPR & Gene-Editing Tools
- Biochips & Microarrays
- Others
- By Application
- Health & Red Biotechnology
- Biopharmaceuticals
- Diagnostics
- Gene Therapy
- Personalised Medicine
- Food & Agriculture (Green)
- Industrial Processing (White)
- Environmental & Natural Resources (Grey)
- Bioinformatics & Omics
- Others
- Health & Red Biotechnology
- By End User
- Biopharma & Biotechnology Companies
- CMOs & CROs
- Academic & Research Institutes
- Hospitals & Diagnostic Centres
- Agricultural Corporations
- Environmental Agencies & NGOs
- By Product Type
- Biopharmaceuticals
- Bioprocess Equipment & Consumables
- Reagents & Kits
- Bioservices
- Bioinformatics Platforms & Software
- Others
- By Geography
- North America
- United States
- Canada
- Mexico
- Europe
- Germany
- United Kingdom
- France
- Italy
- Spain
- Rest of Europe
- Asia-Pacific
- China
- Japan
- India
- Australia
- South Korea
- Rest of Asia-Pacific
- Middle East
- Israel
- Saudi Arabia
- United Arab Emirates
- Turkey
- Rest of Middle East
- Africa
- South Africa
- Egypt
- Nigeria
- Rest of Africa
- South America
- Brazil
- Argentina
- Rest of South America
- North America
Detailed Research Methodology and Data Validation
Primary Research
Mordor analysts interviewed scientists at research institutes, process engineers in biomanufacturing plants across North America, Europe, and Asia, and procurement heads at ag-biotech companies. These conversations helped us validate adoption rates for CRISPR kits, average sequencing throughput, and region-specific regulatory lead times, thereby anchoring assumptions that secondary sources could only partially illuminate.
Desk Research
We begin with structured mining of public data sets such as OECD R&D statistics, World Bank health spending, WHO clinical-trial registries, USDA biotech crop acreage, and patent families listed on the USPTO and EPO portals. Supplementary context is drawn from peer-reviewed journals, association white papers, company 10-Ks, and transaction databases hosted on Dow Jones Factiva and D&B Hoovers, which let us benchmark firm-level revenues. When gaps appear, Questel patent analytics, NIH grant trackers, and customs shipment dashboards further refine trade flows and equipment demand. The sources listed are illustrative; many additional publications support data collection and verification.
Market-Sizing & Forecasting
A blended top-down and bottom-up model is employed. National health expenditure, agricultural biotechnology acreage, industrial enzyme output, venture funding flows, patent grant counts, and FDA novel biologic approvals are first projected with multivariate regression. Results are then cross-checked with sampled supplier roll-ups (average selling price × unit volumes) and channel checks to fine-tune totals. Where bottom-up data are thin, ratios from analogous geographies or historical substitution curves bridge the gap. Scenario analysis around R&D productivity and sequencing-cost decline shapes the forecast to 2030.
Data Validation & Update Cycle
Outputs pass a three-layer review: anomaly scans against external indicators, senior analyst sign-off, and a final refresh just before publication. The model is revisited annually, with interim updates if material events, such as landmark gene-therapy approvals, shift the demand curve.
Why Mordor's Biotechnology Baseline Stands Reliable
Published estimates often diverge because firms choose different activity scopes, currencies, and refresh cadences. Our team clarifies whether figures cover only human therapeutics, include ag-biotech, or extend to bio-industrial enzymes, so clients see the cause of variation upfront.
Key gap drivers arise when other publishers limit coverage to listed company revenues, apply flat price escalators without tracking sequencing-cost deflation, or refresh models less frequently than the pace at which new modalities, for example, mRNA vaccines, reach market.
Benchmark comparison
| Market Size | Anonymized source | Primary gap driver |
|---|---|---|
| USD 2.15 trillion (2025) | Mordor Intelligence | - |
| USD 1.55 trillion (2024) | Regional Consultancy A | Excludes bio-agriculture and industrial biotech segments |
| USD 1.55 trillion (2023) | Trade Journal B | Narrow technology coverage and slower update frequency |
| USD 0.48 trillion (2024) | Global Consultancy C | Counts only public-company product revenues, omits services and emerging regions |
Taken together, the comparison shows that Mordor's disciplined segmentation, live primary inputs, and annual refresh cycle yield a balanced, transparent baseline that decision-makers can replicate and stress-test with minimal extra effort.


Key Questions Answered in the Report
What is the projected size of the biotechnology market by 2031?
The biotechnology market is forecast to reach USD 4.41 trillion by 2031, growing at a 12.67% CAGR over 2026-2031.
Which technology segment is expanding the fastest within the biotechnology market?
Next-Generation Sequencing is expected to grow at a 21.4% CAGR through 2031, the highest among technology segments.
Why is Asia-Pacific considered the most attractive growth region for the biotechnology market?
Public funding, lower operating costs, and strategic investments by China, Japan, and India support a 16.95% CAGR in Asia-Pacific.
How are AI-driven acquisitions influencing the competitive landscape of the biotechnology market?
Deals like the Recursion-Exscientia and Eli Lilly-Verve Therapeutics transactions demonstrate the premium placed on AI platforms that shorten discovery timelines and lower R&D risk.
What are the main regulatory hurdles dampening growth in the biotechnology market?
Delayed harmonization for multi-omic companion diagnostics and emerging genetic-data export controls introduce compliance complexity and extend time-to-market.
Which end-user group is growing fastest in the biotechnology market?
Academic and Research Institutes show the highest growth at an 17.6% CAGR, driven by increased government funding and stronger industry partnerships.
Page last updated on:


