Market Overview
| Study Period | 2020 - 2031 |
|---|---|
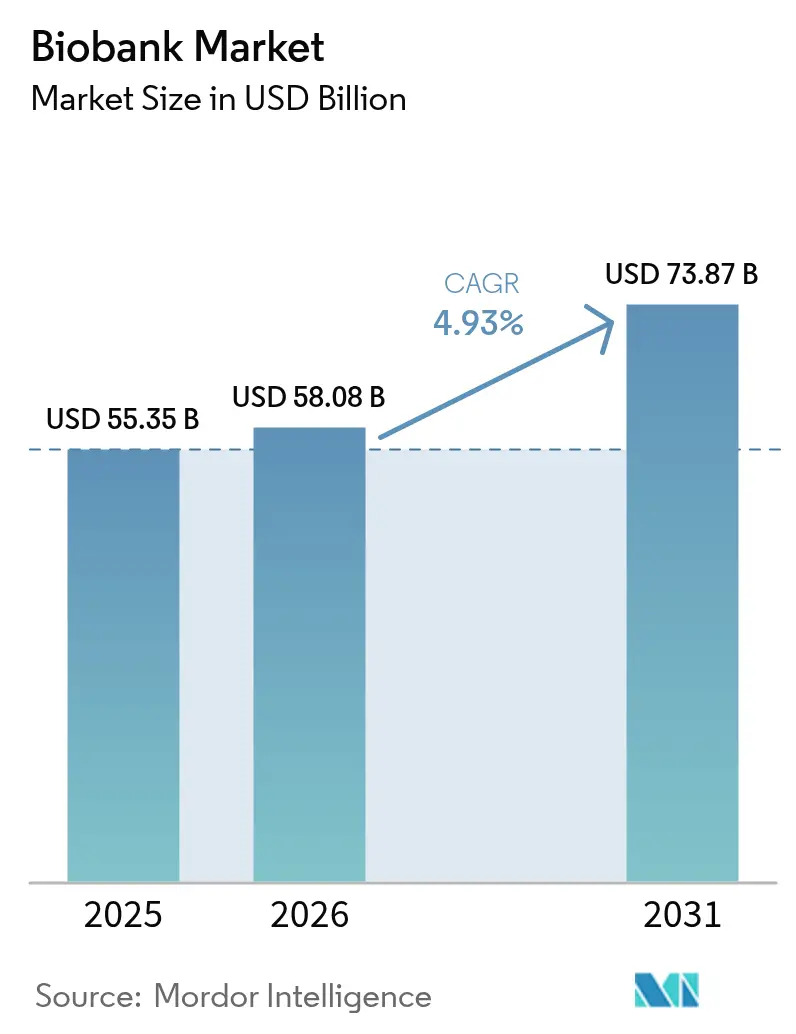
| Market Size (2026) | USD 58.08 Billion |
| Market Size (2031) | USD 73.87 Billion |
| Growth Rate (2026 - 2031) | 4.93% CAGR |
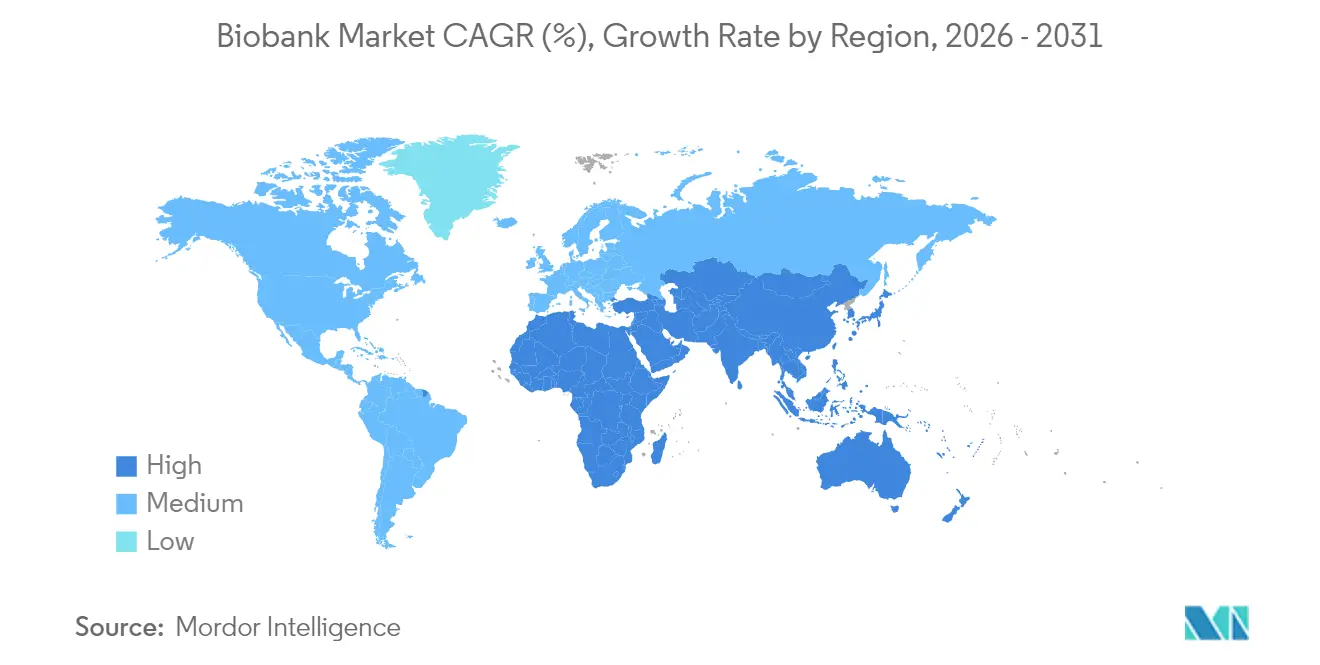
| Fastest Growing Market | Asia-Pacific |
| Largest Market | North America |
| Market Concentration | Medium |
Major Players *Disclaimer: Major Players sorted in no particular order Image © Mordor Intelligence. Reuse requires attribution under CC BY 4.0. | |
Biobank Market Analysis by Mordor Intelligence
Biobank market size in 2026 is estimated at USD 58.08 billion, growing from 2025 value of USD 55.35 billion with 2031 projections showing USD 73.87 billion, growing at 4.93% CAGR over 2026-2031.
Expansion reflects the move from building sample repositories to supporting precision-medicine pipelines that merge stem-cell therapies, proteomics, and multi-omics workflows. Clearer regulations, such as the FDA’s January 2025 draft guidance on donor eligibility, are reducing clinical uncertainty and accelerating adoption in hospital and pharmaceutical settings. Demand is further lifted by hospital uptake of cord-blood services, public and private funding for pandemic preparedness, and the rise of AI-based quality analytics. Competitive intensity is moderate, with large suppliers acquiring niche innovators to offer integrated cold-chain, automation, and analytic platforms.
Key Report Takeaways
- By application, regenerative medicine led with 36.12% revenue share in 2025; it is also projected to record the fastest 7.02% CAGR to 2031.
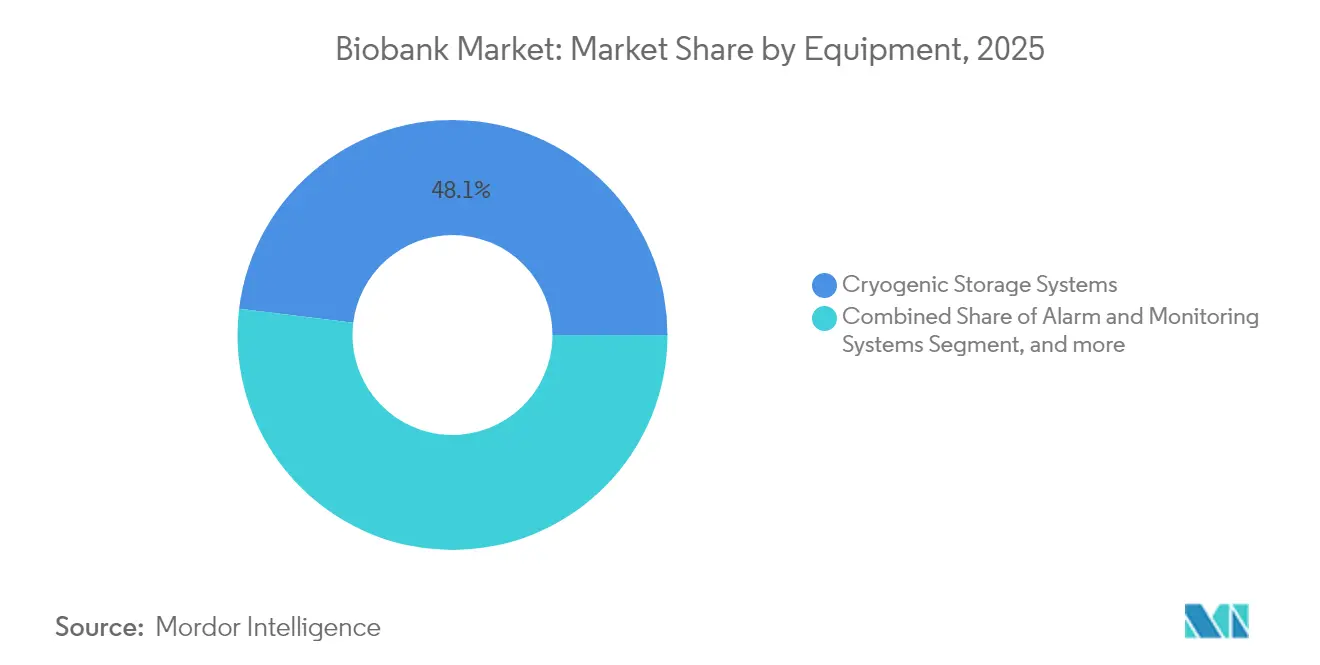
- By equipment, cryogenic storage systems held 48.05% of the biobank market size in 2025; freezers are on track for a 7.78% CAGR during the forecast period.
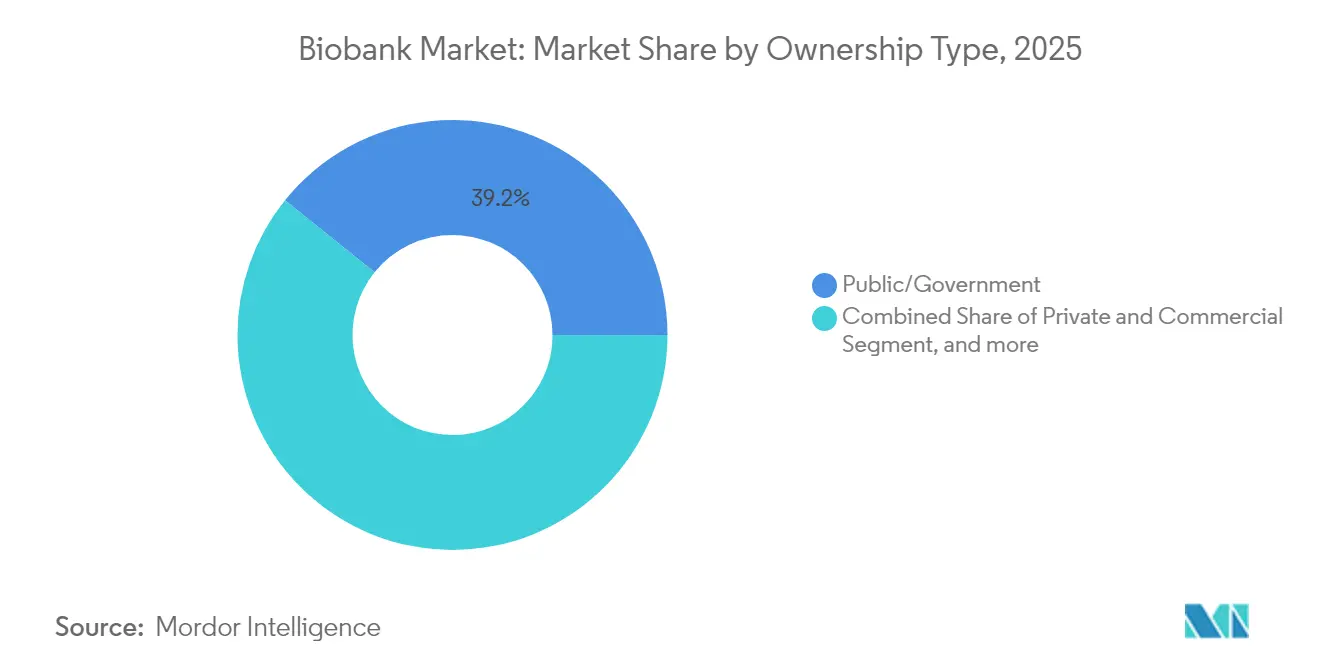
- By ownership model, public and government entities commanded 39.22% share of the biobank market in 2025; academic and non-profit biobanks are the fastest-growing group at 9.28% CAGR.
- By geography, North America dominated with a 35.90% share in 2025, yet Asia-Pacific is the fastest-growing region at a 9.72% CAGR to 2031.
Note: Market size and forecast figures in this report are generated using Mordor Intelligence’s proprietary estimation framework, updated with the latest available data and insights as of 2026.
Global Biobank Market Trends and Insights
Drivers Impact Analysis*
| Driver | (~) % Impact on CAGR Forecast | Geographic Relevance | Impact Timeline |
|---|---|---|---|
| Innovations in Regenerative Medicine | +1.2% | Global, with concentration in North America & Europe | Medium term (2-4 years) |
| Growing Incidences of Chronic Diseases | +0.8% | Global, with higher impact in aging populations of developed markets | Long term (≥ 4 years) |
| Advances in Drug Discovery & Development | +1.0% | North America & Europe core, expanding to APAC | Medium term (2-4 years) |
| Government & NGO Funding Inflows | +0.7% | Global, with emphasis on public health initiatives | Short term (≤ 2 years) |
| AI-Driven Sample-Quality Analytics Adoption | +0.5% | Technology-advanced markets: North America, Europe, select APAC | Medium term (2-4 years) |
| Decentralized Blockchain-Enabled Consent Networks | +0.3% | Early adoption in North America & Europe | Long term (≥ 4 years) |
| Source: Mordor Intelligence | |||
Innovations in Regenerative Medicine
Breakthroughs such as Cedars-Sinai’s cardiosphere-derived cells for Duchenne muscular dystrophy show how a single cell type can serve multiple therapeutic paths.[1]Cedars-Sinai, “Cardiosphere-Derived Cells Show Promise for Duchenne Muscular Dystrophy,” nature.com Gene-edited progenitor cells for ALS require biobanks to guarantee both cellular integrity and genomic stability. ARPA-H’s EMBODY program demands infrastructure that is able to support complex immune-cell reprogramming.[2]Advanced Research Projects Agency for Health, “EMBODY Program Announcement,” arpa-h.gov Research on microgravity-grown stem cells suggests that orbital production techniques will soon influence ground-based processing. Collectively, these shifts push the biobank market toward facilities that resemble small-scale manufacturing plants rather than passive warehouses.
Growing Incidences of Chronic Diseases
The UCLA team showed that linking biobank genetics to electronic health records predicts patient responses to standard drugs.[3]UCLA Health Sciences, “Biobank Genomics Predict Drug Response,” ucla.edu In China, cord-blood transplants for Thalassemia Major climbed from 30,000 to nearly 40,000 cases in 2024, demonstrating clinical reliance on banked materials. Tianjin’s 19-year-old autologous cord-blood success underscores the long-term utility of well-preserved samples. Haplocord protocols that combine cord blood with haploidentical donors maximise sample use, raising demand on existing repositories. As chronic conditions proliferate, the biobank market is shifting from research-centric to therapy-centric operations.
Advances in Drug Discovery & Development
Thermo Fisher’s involvement in the UK Biobank Pharma Proteomics Project, analysing 5,400 proteins across 600,000 samples, exemplifies the scale modern drug pipelines require. BioAge Labs and Novartis structured a deal worth up to USD 530 million based on proprietary longevity datasets. BD’s FACSDiscover A8 analyser captures 50 cellular traits in real time, enabling richer biobank datasets. AstraZeneca’s Open Innovation platform requests integrated imaging and multi-omics packages, illustrating that pharmaceutical partners now expect data-rich assets rather than isolated vials. This integration cements the biobank market as a strategic pillar of drug discovery.
Government & NGO Funding Inflows
ATCC secured USD 87 million from BARDA to build Project NextGen, a centralised repository for pandemic-relevant materials. The EU committed EUR 45 million (USD 49 million) to the Genome of Europe reference sequencing project, leveraging national biobank assets. ARPA-H’s OCULAB initiative explores tear-based biomarkers, pushing collection beyond blood and tissue samples. Brazil’s Fiocruz established a biodiversity bank during COVID-19, proving that rapid government action can stand up compliant infrastructure. These programmes standardise protocols and inject capital, lifting the biobank market across multiple regions.
Restraints Impact Analysis*
| Restraint | (~) % Impact on CAGR Forecast | Geographic Relevance | Impact Timeline |
|---|---|---|---|
| Complex & Evolving Regulatory Regimes | -0.9% | Global, with varying intensity by jurisdiction | Medium term (2-4 years) |
| High Total Ownership Cost of Cryogenic Infrastructure | -0.6% | Global, with higher impact in emerging markets | Short term (≤ 2 years) |
| Litigation Over Donor Privacy & Data Ownership | -0.4% | Primarily North America & Europe | Long term (≥ 4 years) |
| Liquid-Nitrogen Price Volatility | -0.3% | Global, with supply chain dependencies | Short term (≤ 2 years) |
| Source: Mordor Intelligence | |||
Complex & Evolving Regulatory Regimes
The EU’s Regulation 2024/1938 on substances of human origin will demand major workflow upgrades by 2027. Florida’s 2025 stem-cell statute permits non-FDA-approved therapies if stored in FDA-registered facilities, creating cross-state compliance puzzles. China’s planned relaxation of genetic-resource controls offers growth but brings interim uncertainty. Such divergent rules force biobanks to fund parallel quality systems, adding cost while lengthening approval timelines. Well-capitalised operators gain an advantage, potentially tilting the biobank market toward larger, multinational institutions.
High Total Ownership Cost of Cryogenic Infrastructure
Capital outlays span cryogenic freezers, alarm systems and back-up power, while liquid-nitrogen sourcing remains volatile. Mechanical systems save up to 70% in running costs yet still need specialised maintenance. Failures such as the Cordlife temperature incident required extensive remediation and new staff. In the UAE, regulatory demands pushed banks to build local laboratories, raising entry barriers. These pressures slow footprint expansion in resource-constrained regions, unevenly shaping global biobank market growth.
*Our forecasts treat driver/restraint impacts as directional, not additive. The impact forecasts reflect baseline growth, mix effects, and variable interactions.
Segment Analysis
By Equipment: Automation Drives Infrastructure Evolution
Cryogenic storage systems generated the most significant portion of 48.05% in the biobank market size for equipment in 2025. End users are migrating towards freezers that achieve tighter temperature uniformity and lower energy draw, sustaining a robust 7.78% CAGR. Vendors such as Haier Biomedical introduced wide-neck models with dual-coolant redundancy and touchscreen diagnostics. Alarm and monitoring platforms represent the quickest-moving subsegment because regulators now expect continuous data logging. The arrival of SPT Labtech’s pneumatic arktic XC system reduces manual handling, raising throughput without compromising traceability.
Storage accessories are also evolving. Densely stacked racking and laser-etched barcodes help academic centres squeeze capacity from existing footprints. Mechanical ultra-low freezers offering ±5 °C uniformity are gaining favor as facilities attempt to lower nitrogen usage. Collectively, these shifts point to an equipment landscape where hardware, software and analytics converge, elevating entry requirements for new suppliers and reshaping competition inside the biobank market.


By Application: Regenerative Medicine Leads Dual Growth
Regenerative medicine controlled 36.12% of 2025 revenue and matches that dominance with the fastest 7.02% CAGR through 2031. Drug-discovery applications follow, boosted by collaborations like Thermo Fisher’s proteomics work with the UK Biobank. Disease-surveillance programmes are adopting large-scale sample libraries to map outbreak dynamics, anchoring steady growth. The Tianjin Cord Blood Bank’s cure for aplastic anaemia after 19 years of storage shows that older archives retain high therapeutic value.
Future-oriented programmes, including ARPA-H’s PRINT for 3D-printed organs, create fresh sample requirements. Biobanks hence pivot toward integrated pipelines serving lab-bench discovery and bedside therapy alike. This convergence raises average revenue per sample and extends value chains inside the biobank market.
By Ownership Type: Academic Sector Accelerates Innovation
Public and government operators generated 39.22% of revenue in 2025, owing to long-established repositories and stable funding. Academic and non-profit centres show the quickest 9.28% CAGR on the back of university-industry alliances. Harvard’s Longevity Study banks multifaceted ageing biomarkers, and Germany’s Biobank Alliance links 16 institutions to field 900,000 biosample queries. Private players continue to carve niches in newborn screening, personalised medicine, and logistics services.
Hybrid models are spreading, with public entities hosting base infrastructure while private partners scale analytical platforms. This collaborative fabric diversifies revenue sources, cushions funding cycles and stimulates healthy competition in the biobank market ecosystem.
Geography Analysis
North America generated 35.90% of global revenue in 2025, anchored by FDA guidelines that provide a clear compliance path and by multi-billion-dollar capital commitments from major suppliers. Thermo Fisher is investing USD 2 billion to reinforce domestic cold-chain and analytical production. ATCC’s USD 87 million BARDA contract underscores federal support for pandemic-ready repositories.Continued precision-medicine roll-outs in Canada and heightened clinical-trial activity in Mexico sustain regional sample demand, bolstering revenues for the biobank market.
Europe’s harmonised regulatory approach under Regulation 2024/1938 is stimulating cross-border projects such as the EUR 45 (USD 52) million Genome of Europe initiative. The UK Biobank’s 200,000-genome release cements its status as a flagship data resource. Germany’s federated network processes thousands of requests against 900,000 stored biospecimens, setting a benchmark for operational transparency. Southern European countries leverage EU funding to upgrade freezer capacity and digital-consent tools, broadening sample accessibility across the broader biobank market.
Asia-Pacific is advancing at a 9.72% CAGR, the fastest worldwide. China plans to relax genetic-resource export rules, encouraging multinational R&D partnerships. National cord-blood treatments escalated to nearly 40,000 cases in 2024, proving clinical readiness for banked therapies. Japan remains a leader in allogeneic cord-blood transplants, and SK pharmteco’s USD 260 million Korean facility will expand GMP-grade storage capacity. Australia and South Korea strengthen regional momentum through strong ethics frameworks and translational-research programmes, collectively propelling the biobank market.

Competitive Landscape
The biobank market is moderately competitive. A few major players dominate some segments, while others are distributed among multiple players. Large technology vendors are consolidating capabilities to offer end-to-end workflows. Thermo Fisher’s USD 3.1 billion acquisition of Olink enhances proteomics, while the USD 4.1 billion Solventum filtration deal extends upstream bioprocessing. BD partners with Hamilton to integrate automated single-cell sorting into multi-omics pipelines. Cryoport’s takeover of TEC4MED and Bluebird Express gives it 675 active clinical-trial logistics contracts across 17 countries.
Specialists create value by focusing on diversity and decentralisation. Galatea Bio raised USD 25 million to chart genetic diversity in 10 million participants, offering prized datasets for pharma alliances. Johns Hopkins advocates a hybrid model where regional repositories feed into centralised analytics, mitigating diversity gaps seen during COVID-19. Technology differentiation now hinges on AI-driven integrity scoring and blockchain consent networks that optimise chain-of-custody while reducing data silos. These innovations intensify competition yet expand overall capabilities, reinforcing sustainable growth for the biobank market.
Biobank Industry Leaders
Hamilton Company
Thermo Fisher Scientific Inc.
Avantor Inc. (VWR)
BioLife Solutions Inc.
Merck KGaA
- *Disclaimer: Major Players sorted in no particular order


Recent Industry Developments
- May 2025: Astoriom expanded its sample stability storage capabilities at its Tramore site in Ireland, enhancing offerings for scalable, regulatory-compliant storage solutions ranging from -60°C to -196°C following acquisitions of MTS Cryo Stores and Cool Repair Scientific UK.
- May 2025: BD launched the FACSDiscover A8 Cell Analyzer, featuring breakthrough spectral and real-time cell imaging technologies that enable analysis of up to 50 characteristics of a single cell, enhancing biomarker discovery capabilities.
- April 2025: Thermo Fisher Scientific announced a USD 2 billion investment in U.S. innovation and manufacturing over four years, including USD 1.5 billion for capital expenditures and USD 500 million for R&D to strengthen healthcare supply chains.
- March 2025: Teknova and Pluristyx launched the proprietary PluriFreeze cryopreservation system designed to accelerate cell therapy development through enhanced preservation techniques.


Research Methodology Framework and Report Scope
Market Definitions and Key Coverage
Our study defines the global biobank market as the total revenue generated from establishing, equipping, operating, and servicing biorepositories that collect, process, catalog, store, and distribute human biospecimens for research, diagnostic, and therapeutic purposes across public, academic, and private settings worldwide.
Scope Exclusion: Veterinary, forensic, fertility-clinic, and human-tissue transplant banks are not included in this analysis.
Segmentation Overview
- By Product
- Cryogenic Storage Systems
- Refrigerators
- Freezers
- Ice Machines
- Alarm & Monitoring Systems
- Media & Consumables
- Cryogenic Storage Systems
- By Application
- Regenerative Medicine
- Drug Discovery
- Disease & Epidemiology Research
- Life-Science & Genomic Research
- By Ownership Type
- Public/Government
- Academic/Non-profit
- Private & Commercial
- By Geography
- North America
- United States
- Canada
- Mexico
- Europe
- Germany
- United Kingdom
- France
- Italy
- Spain
- Rest of Europe
- Asia-Pacific
- China
- Japan
- India
- Australia
- South Korea
- Rest of Asia-Pacific
- Middle East & Africa
- GCC
- South Africa
- Rest of Middle East & Africa
- South America
- Brazil
- Argentina
- Rest of South America
- North America
Detailed Research Methodology and Data Validation
Primary Research
Mordor analysts interview biobank managers, procurement heads at pharmaceutical firms, and automation suppliers across North America, Europe, and Asia-Pacific. These conversations refine average sample throughput, service mix, and capital refresh cycles; they validate assumptions around regulatory costs and future funding flows.
Desk Research
We start with structured searches across tier-1 public sources such as OECD health statistics, NIH/NCI biorepository databases, European BBMRI releases, and customs import codes for cryogenic systems. We then review peer-reviewed journals on regenerative medicine. Company 10-Ks, investor presentations, and association white papers from ISBER and ESBB broaden supply-side insight, while D&B Hoovers and Dow Jones Factiva provide financial snapshots of key vendors. This mixed review sets baseline volumes, price bands, and facility counts. The sources named are illustrative; numerous additional references support data collection, validation, and clarification.
Market-Sizing & Forecasting
A top-down model converts national clinical-research spending and population-level specimen prevalence into an addressable demand pool, which is checked against bottom-up indicators such as average selling price multiplied by annual installations of freezers and liquid-nitrogen tanks gathered through channel checks. Key variables include R&D spend per capita, the count of new precision-medicine trials, samples stored per trial, automation adoption rate, and freezer replacement cycles. A multivariate regression projects growth, while scenario analysis tests funding-shock sensitivities. Data gaps in bottom-up inputs are bridged using median ratios from comparable regions.
Data Validation & Update Cycle
We triangulate modeled outputs against grant databases and shipment trackers, flag anomalies, and rerun calculations before senior review. Reports refresh each year, with interim updates triggered by major funding awards or regulatory shifts, ensuring users receive the latest viewpoint.
Why Our Biobanks Baseline Commands Reliability
Published estimates often diverge because providers choose different scopes, cost centers, and refresh cadences.
Key gap drivers include whether service revenues and LIMS software are counted, how donor-funded sample collections are valued, and the consistency of currency conversion and inflation adjustments.
Benchmark comparison
| Market Size | Anonymized source | Primary gap driver |
|---|---|---|
| USD 55.35 B | Mordor Intelligence | |
| USD 86.82 B | Global Consultancy A | Counts outsourced repository services and LIMS revenues; uses list prices with no regional discounts. |
| USD 7.65 B | Global Consultancy B | Tracks only biobanking devices; omitting consumables, services, and operating income. |
These contrasts show that Mordor Intelligence, by aligning scope with real facility economics and cross-checking demand and supply signals, offers a balanced, transparent baseline that decision-makers can trust.


Key Questions Answered in the Report
What is the current value of the biobank market?
The market is valued at USD 58.08 billion in 2026 and is set to reach USD 73.87 billion by 2031.
Which segment shows both the largest share and the fastest growth?
Regenerative medicine accounts for 36.12% of revenue and leads growth with a 7.02% CAGR through 2031.
Why is Asia-Pacific considered the growth engine for biobanking?
Regional reforms that relax genetic-resource rules, rising cord-blood utilisation and major infrastructure projects together underpin a 9.72% CAGR for Asia-Pacific.
How are regulatory changes affecting global biobanking operations?
New standards in the EU, policy shifts in the United States and evolving rules in China require biobanks to update quality systems and invest in compliance, raising operating costs but improving safety.
What technologies are shaping the next phase of the biobank market?
Automation, AI-driven sample-quality analytics, blockchain consent management and room-temperature DNA storage are the main technologies redefining workflows and lowering long-term costs.
Page last updated on:


