Spatial OMICS Market Size and Share
Market Overview
| Study Period | 2020 - 2031 |
|---|---|
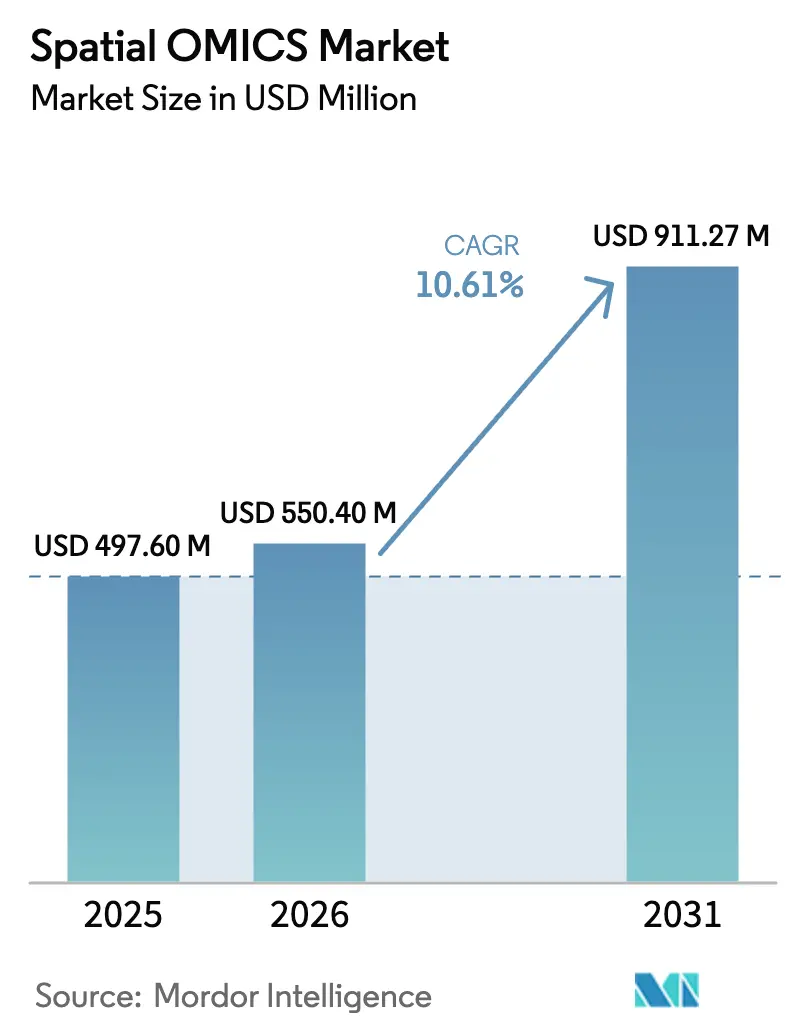
| Market Size (2026) | USD 550.40 Million |
| Market Size (2031) | USD 911.27 Million |
| Growth Rate (2026 - 2031) | 10.61% CAGR |
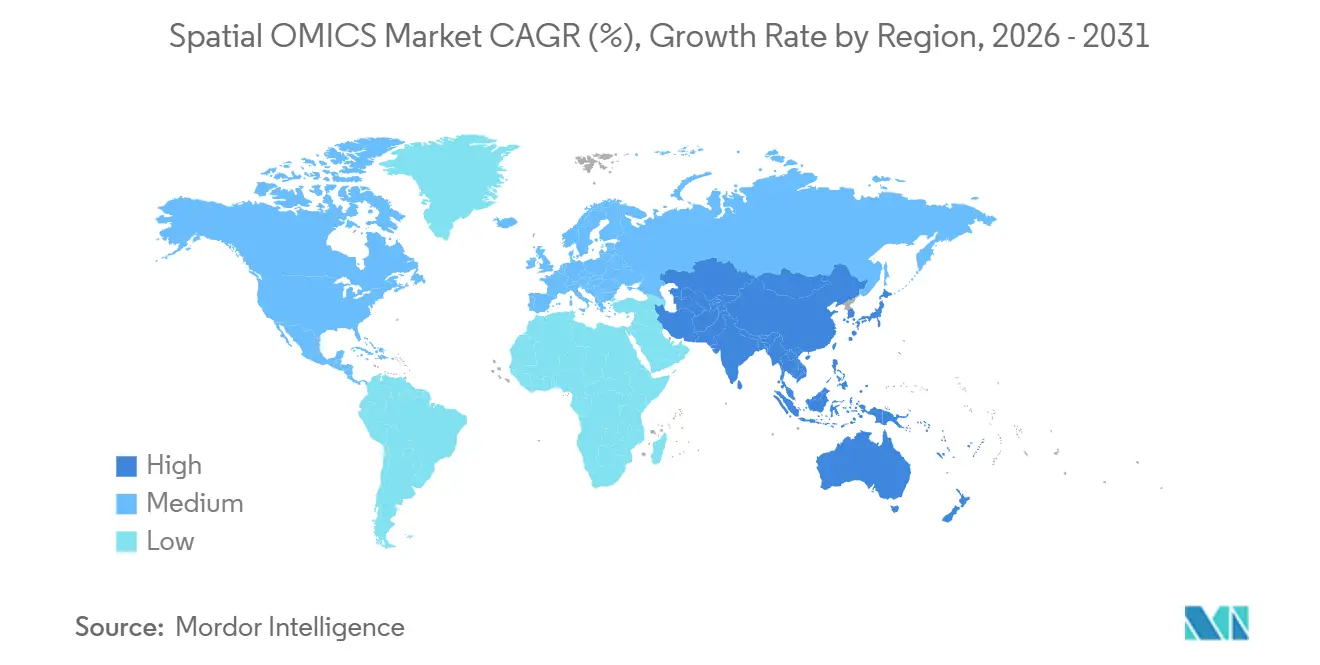
| Fastest Growing Market | Asia Pacific |
| Largest Market | North America |
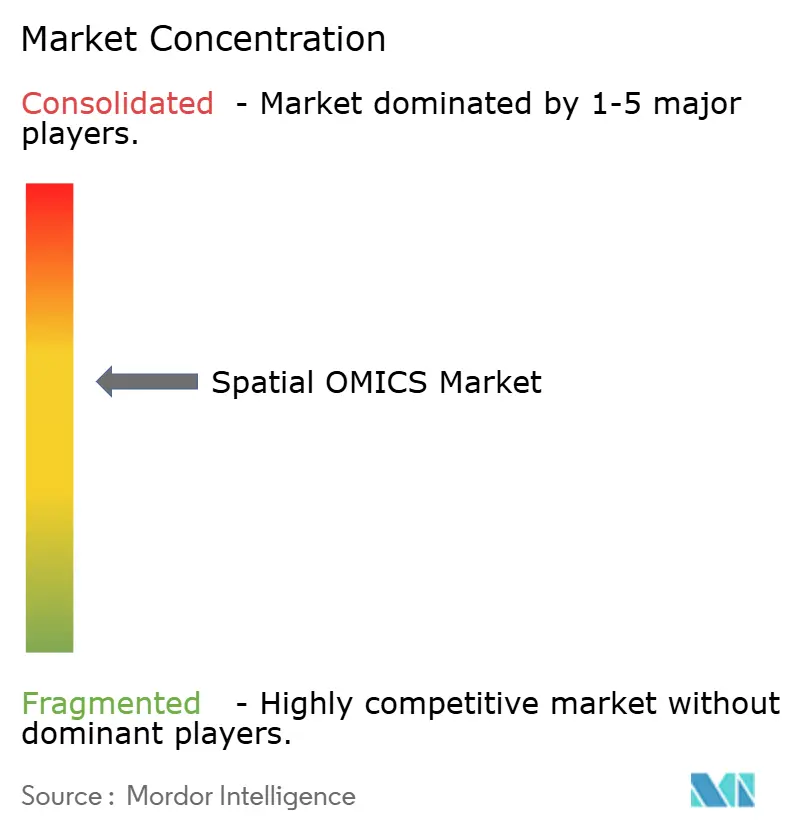
| Market Concentration | Medium |
Major Players *Disclaimer: Major Players sorted in no particular order Image © Mordor Intelligence. Reuse requires attribution under CC BY 4.0. | |
Spatial OMICS Market Analysis by Mordor Intelligence
The Spatial OMICS Market size is expected to grow from USD 497.60 million in 2025 to USD 550.40 million in 2026 and is forecast to reach USD 911.27 million by 2031 at 10.61% CAGR over 2026-2031.
The double-digit trajectory of the spatial OMICS market reflects a structural shift toward tissue-level molecular profiling as drug developers, translational institutes, and contract research organizations (CROs) integrate next-generation sequencing chemistry, high-plex imaging, and machine-learning inference engines into routine workflows. Sequencing-based platforms retained a majority share in 2025, yet imaging methods are closing the gap as vendors refine multiplexed error-robust fluorescence in situ hybridization (MERFISH) chemistries that bypass library-prep bottlenecks. Capital expenditure on instruments above USD 500,000 dominates initial budgets, but software-as-a-service bioinformatics suites now monetize recurring per-sample fees, shifting revenue pools downstream. North America remains the largest regional node of the spatial OMICS market due to dense vendor clusters and NIH funding, while Asia-Pacific posts the fastest growth on the back of China’s Shenzhen ecosystem and Japan's precision oncology programs. Near-term adoption hinges on vendors harmonizing data formats, compressing turnaround times below 48 hours, and demonstrating that spatial insights can underpin U.S. Food and Drug Administration–approved companion diagnostics.
Key Report Takeaways
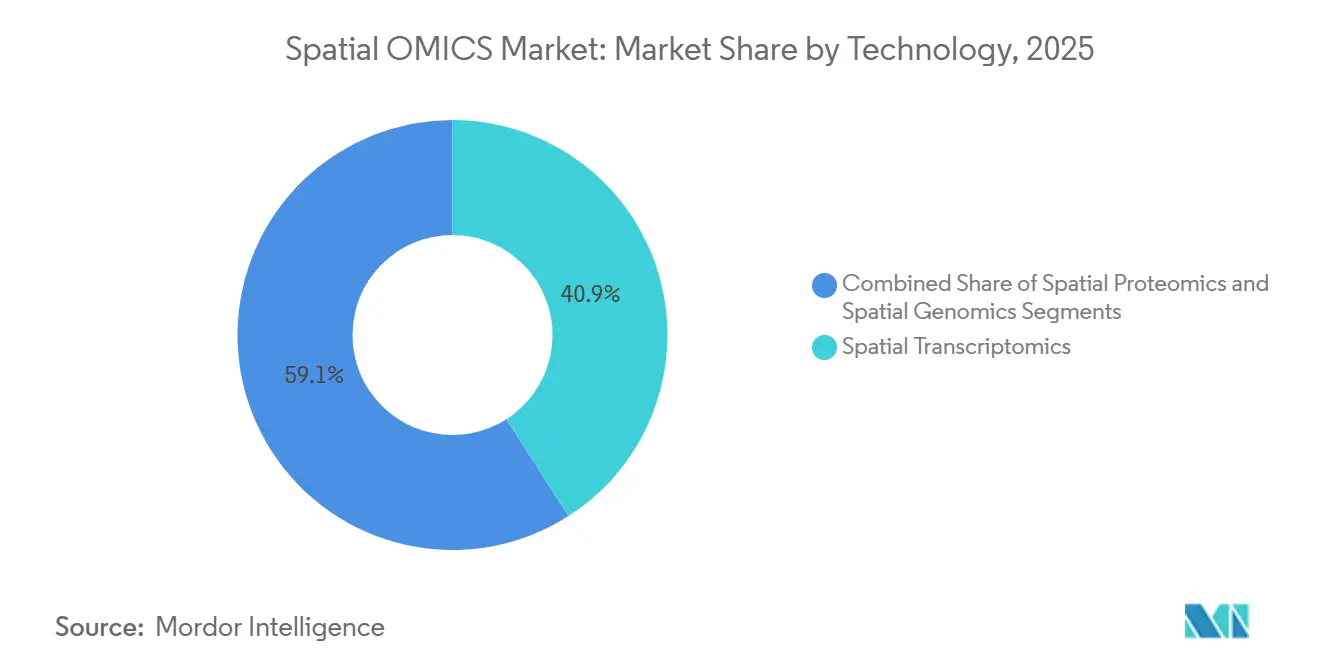
- By technology, spatial transcriptomics led with 40.93% revenue share in 2025, whereas spatial proteomics is projected to expand at a 15.65% CAGR through 2031, the highest among technology categories.
- By workflow, sequencing-based platforms commanded 62.43% of the spatial OMICS market share in 2025, while imaging-based methods are advancing at a 15.76% CAGR to 2031.
- By product, instruments captured 45.02% share of the spatial OMICS market size in 2025, but software and analytics are forecast to grow at a 15.82% CAGR between 2026-2031.
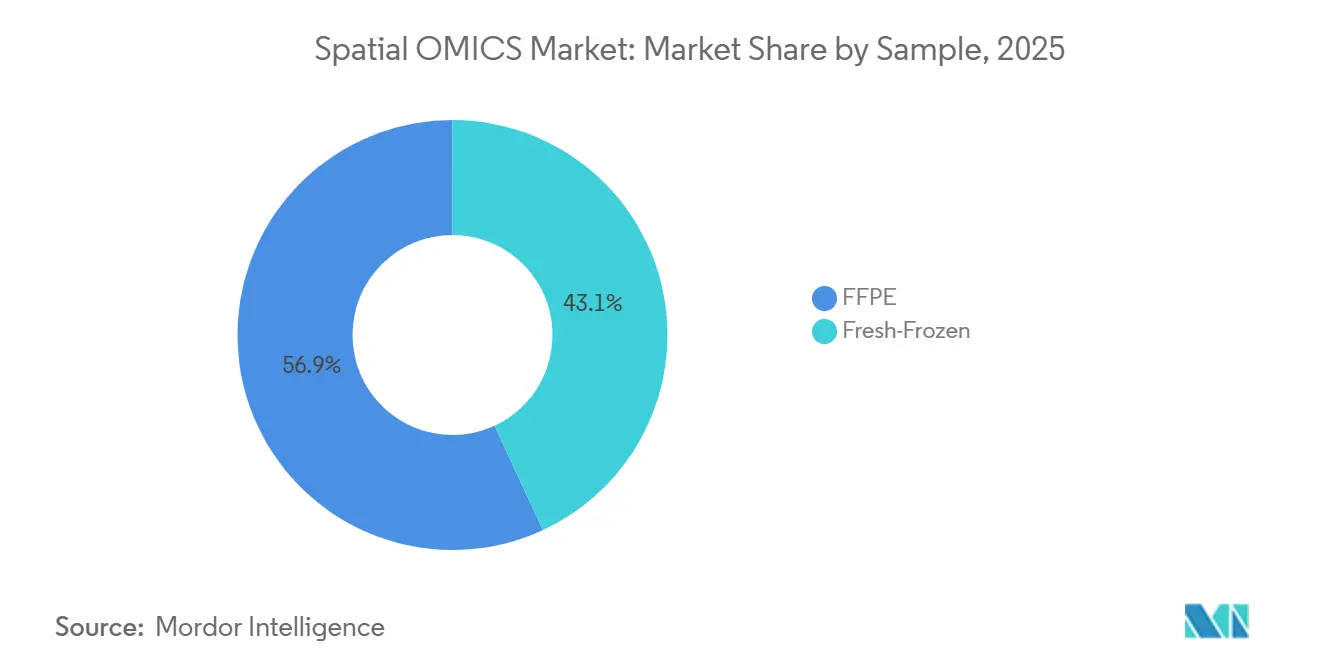
- By sample type, formalin-fixed paraffin-embedded specimens dominated with 56.92% share in 2025, whereas fresh-frozen workflows are growing at a 16.44% CAGR through 2031.
- By application, drug discovery and development accounted for 31.68% revenue in 2025, and single-cell analysis is expanding at a 16.98% CAGR to 2031.
- By end user, academic and translational institutes held 40.06% of 2025 spending, while CROs and CDMOs are registering a 16.43% CAGR over 2026-2031.
- By geography, North America accounted for 41.74% of the Healthcare Cloud Computing market size in 2025, and Asia-Pacific is the fastest expanding geography with a 18.36% CAGR to 2031.
Note: Market size and forecast figures in this report are generated using Mordor Intelligence’s proprietary estimation framework, updated with the latest available data and insights as of 2026.
Global Spatial OMICS Market Trends and Insights
Drivers Impact Analysis*
| Driver | (~) % Impact on CAGR Forecast | Geographic Relevance | Impact Timeline |
|---|---|---|---|
| Growing Demand for Tissue-Level Molecular Insights | +3.2% | Global, early traction in North America and EU oncology centers | Medium term (2-4 years) |
| Rapid Advancements in High-Throughput Spatial Profiling Technologies | +2.8% | North America & Asia-Pacific R&D hubs | Short term (≤ 2 years) |
| Expansion of Precision Medicine and Companion Diagnostics | +2.5% | North America & EU, spillover to APAC | Long term (≥ 4 years) |
| Rising Public and Private Funding in Spatial Biology | +1.9% | Global, concentrated in U.S. NIH and EU Horizon programs | Medium term (2-4 years) |
| Convergence of Spatial Data with Artificial Intelligence Workflows | +1.7% | North America & China AI-genomics clusters | Short term (≤ 2 years) |
| Emergence of End-to-End Spatial OMICS Service Models | +1.2% | Global, led by North America CRO expansion | Medium term (2-4 years) |
| Source: Mordor Intelligence | |||
Growing Demand for Tissue-Level Molecular Insights
Bulk-tissue RNA sequencing masks the spatial architecture of tumor microenvironments where stromal, immune, and malignant clones interact within micron-scale niches. Spatial OMICS platforms preserve xy-coordinates while profiling molecular states, enabling oncologists to map immune-checkpoint gradients that predict anti-PD-1 resistance. Owkin’s MOSAIC consortium invested USD 50 million in 2024 to generate spatial data from 7,000 tumors, underscoring pharma demand for predictive spatial biomarkers[1]Owkin, “MOSAIC Consortium Launch Announcement,” owkin.com. The same need permeates neurology and cardiology, where intact-tissue analysis reveals disease-specific cell-cell communication. In 2024, FDA guidance acknowledged spatial context as a valid stratification criterion, aligning regulatory incentives with clinical adoption.
Rapid Advancements in High-Throughput Spatial Profiling Technologies
Between 2024 and 2026, vendors compressed spatial resolution and expanded multiplexing capacity. Illumina’s 2025 platform delivers a nine-times larger capture area and four-times finer resolution, enabling whole-slide FFPE profiling at reduced cost. 10x Genomics’ Xenium Prime 5K broadened its in situ panel to 5,000 genes and automated image analysis, cutting hands-on time from days to hours[2]10x Genomics, “Xenium Prime 5K Product Sheet,” 10xgenomics.com. Vizgen’s MERFISH 2.0 achieved single-molecule sensitivity across 10,000-gene panels after a USD 48 million financing in 2026, lowering technical barriers for mid-tier labs. Turnkey bundles that integrate hardware, consumables, and cloud analytics democratize access once confined to elite genome centers.
Expansion of Precision Medicine and Companion Diagnostics
Targeted therapies and immunomodulators require spatial biomarkers that predict patient response. Platforms calculate immune-exclusion scores and tertiary lymphoid structure density that correlate with outcomes in basket trials. Roche and Bristol Myers Squibb embedded spatial profiling into Phase II studies using Akoya and NanoString systems, accelerating regulatory pathways. FDA approval of FoundationOne CDx in 2024 established precedent for tissue-context claims. Economic benefits are clear: spatial enrichment that raises responder fractions by 30% can halve Phase III costs, motivating co-development of diagnostics and therapeutics.
Rising Public and Private Funding in Spatial Biology
NIH’s BRAIN Initiative allocated USD 120 million in 2024 for spatial transcriptomics of neural circuits, while the European Research Council funded 15 spatial-biology consortia under Horizon Europe. Private capital followed: Moleculent secured USD 26 million in 2024 for mapping ligand-receptor networks, and Vizgen’s 2026 round supports scaling MERFISH 2.0 manufacturing. Investment accelerates platform miniaturization, reagent cost cuts, and software automation, but concentration in high-income regions risks widening global access gaps.
Restraints Impact Analysis*
| Restraint | (~) % Impact on CAGR Forecast | Geographic Relevance | Impact Timeline |
|---|---|---|---|
| High Capital and Operational Costs of Spatial Platforms | -1.8% | Global, with pronounced pressure in cost-sensitive APAC and Latin America markets | Short term (≤ 2 years) |
| Limited Availability of Standardized Sample Preparation Protocols | -1.3% | Global, with protocol fragmentation across North America and EU laboratories | Medium term (2-4 years) |
| Data Management and Interoperability Challenges | -1.1% | Global, particularly affecting multi-site pharma trials and CRO data exchanges | Medium term (2-4 years) |
| Biological Variability Complicating Predictive Model Validation | -1.0% | Global, acute in oncology tissues and high-complexity clinical specimens | Long term (≥ 4 years) |
| Source: Mordor Intelligence | |||
High Capital and Operational Costs of Spatial Platforms
Instrument prices ranging from USD 400,000 to USD 750,000 restrict adoption to well-funded centers. Consumables add USD 500–3,000 per sample, while terabyte-scale datasets demand high-performance computing. Cloud services like DNAnexus reduce on-site infrastructure but charge USD 200–500 per sample. CROs face margin pressure when clients expect spatial profiling at bulk-sequencing prices, slowing investment in next-generation platforms. Leasing and reagent-rental schemes shift capital risk without solving underlying cost intensity.
Limited Availability of Standardized Sample Preparation Protocols
Divergent fixation, permeabilization, and probe-hybridization protocols introduce batch effects that confound cross-study comparisons. FFPE retrieval can slash spatial transcriptomics sensitivity by up to 50% compared with fresh-frozen samples, yet the latter requires cold-chain logistics that many clinics lack. The lack of ISO-certified reference materials impedes regulatory validation, as FDA guidance now emphasizes “validated sample-handling procedures.” A 2025 Spatial OMICS Standards Working Group seeks harmonization, but adoption remains voluntary until reagent vendors embed consensus protocols into turnkey kits.
*Our forecasts treat driver/restraint impacts as directional, not additive. The impact forecasts reflect baseline growth, mix effects, and variable interactions.
Segment Analysis
By Technology: Transcriptomics Holds Lead, Proteomics Outpaces
Spatial transcriptomics accounted for 40.93% of 2025 revenue in the spatial OMICS market, anchored by established 10x Genomics and Illumina platforms already resident in genomics cores, enabling incremental spatial upgrades without wholesale capital swaps. Sequencing-based breadth—20,000-plus genes—supports discovery, whereas imaging’s subcellular precision remains a differentiator for validation. Spatial proteomics, however, is expanding at a 15.65% CAGR through 2031, the fastest rate in the spatial OMICS market, because antibody-conjugate chemistries now localize more than 100 proteins per FFPE section, a capacity vital for immune-oncology programs.
Pharma’s emphasis on antibody-drug conjugates and checkpoint inhibitors heightens proteomics demand, as mRNA-protein discordance often clouds transcript-only readouts. Platforms such as Akoya PhenoCycler and Lunaphore COMET deliver iterative staining that retains tissue architecture. Spatial epigenomics and genomics occupy niche markets but may gain momentum as Illumina’s 2025 unified multiomics platform co-profiles chromatin accessibility, transcripts, and proteins in a single workflow. These convergent offerings could blur categorical lines and temper siloed spending.


By Workflow: Sequencing Dominance Faces Imaging Surge
Sequencing-based workflows comprised 62.43% of the 2025 spatial OMICS market share, leveraging NovaSeq and DNBSEQ throughput to process hundreds of slides per run. Yet imaging methods are registering a 15.76% CAGR, narrowing the gap as MERFISH and Xenium pipelines deliver single-molecule sensitivity and subcellular resolution within 24 hours. Academic discovery studies still favor sequencing for comprehensive coverage, but pharma and diagnostics labs pivot to imaging for speed and clinical turnaround. Hybrid approaches—sequencing for hypothesis generation followed by targeted imaging validation—are emerging, as illustrated by the Broad Institute’s Spatial Flagship Project, which integrates both modalities[3]10x Genomics, “Xenium Prime 5K Product Sheet,” 10xgenomics.com.
Workflow selection increasingly depends on AI convergence. Imaging vendors embed neural networks for automated cell segmentation and phenotyping, compressing analysis timelines from weeks to hours, whereas sequencing incumbents accelerate on-instrument base calling yet still contend with multi-day library preparation. The coexistence of breadth versus resolution ensures parallel growth rather than outright substitution through 2031.
By Product: Instruments Lead, Software Accelerates
Instruments accounted for 45.02% of 2025 product revenue in the spatial OMICS market, reflecting high entry costs for platforms such as Visium HD and MERSCOPE Ultra, which exceed USD 500,000. Consumables contribute recurring cash flow but face decelerating growth as chemistries become more efficient. Software and analytics, however, will expand at a 15.82% CAGR to 2031, outpacing hardware as cloud-native suites monetize per-sample analysis and machine-learning-derived insights. Vendors now differentiate through proprietary AI models that infer ligand-receptor signaling, integrate electronic health records, and support regulatory compliance under 21 CFR Part 11.
Open-source tools such as Seurat and Scanpy retain mindshare but lack the validated audit trails demanded by clinical labs. Consequently, the spatial OMICS market is tilting toward subscription-based analytics that promise predictable revenue streams and stickier customer relationships than cyclical instrument sales. Hardware refresh cycles persist, buoyed by trade-in incentives and performance leaps, yet value is migrating downstream into data interpretation.
By Sample: FFPE Remains Mainstay, Fresh-Frozen Climbs
FFPE samples accounted for 56.92% of the 2025 specimens profiled in the spatial OMICS market due to their archival ubiquity and compatibility with retrospective clinical cohorts. Owkin’s MOSAIC project illustrates how decades-old blocks can unlock spatial biomarkers tied to long-term outcomes. Fresh-frozen workflows, though, are growing at a 16.44% CAGR as cryopreservation improves RNA integrity and enables subcellular mapping that is unattainable in cross-linked tissues. The spatial OMICS market for fresh-frozen assays is projected to expand rapidly between 2026 and 2031, particularly within discovery-oriented pharma groups that prioritize data quality over operational convenience.
Regulatory dynamics favor FFPE in diagnostics because existing billing codes, quality-control standards, and pathologist workflows are tuned to fixed tissue. Vendors such as Illumina added enzymatic deparaffinization to recover 80% of fresh-frozen sensitivity from FFPE, narrowing performance gaps. Nevertheless, dual-pipeline labs that maintain both sample paths hedge against regulatory uncertainty and research flexibility.
By Application: Drug Discovery Dominates, Single-Cell Analysis Accelerates
Drug discovery and development accounted for 31.68% of 2025 revenue in the spatial OMICS market, leveraging spatial readouts to map on-target engagement, off-target toxicity, and patient stratification cues. Bristol Myers Squibb’s collaboration with NanoString, which produced a 12-gene spatial signature predicting progression-free survival in melanoma, typifies this use case. Single-cell analysis is growing fastest, with a 16.98% CAGR, as researchers recognize the inherent dissociation artifacts in suspension methods. The spatial OMICS market for single-cell spatial assays is growing rapidly as tumor-microenvironment phenotyping drives immunotherapy pipelines.
Diagnostics adoption remains cautious but steady; lack of FDA-cleared assays stalls reimbursement, yet AI-augmented pathology groups such as PathAI pursue breakthrough-device designations that could unlock clinical demand post-2027. Translational research projects, including the Human Tumor Atlas Network, provide publicly accessible datasets that nurture biomarker discovery pipelines and momentum for standardization.
By End User: Academia Leads, CROs Scale Fast
Academic and translational institutes held 40.06% of 2025 spending in the spatial OMICS market, supported by NIH, European Research Council, and Wellcome Trust grants that subsidize core-facility buildouts. Shared-use models distribute capital costs, allowing dozens of labs to access instruments and reducing per-sample pricing. CROs and CDMOs, however, are growing at a 16.43% CAGR as biopharma outsources spatial profiling to manage cost and timeline pressure. The spatial OMICS market share for CROs is expected to reach double digits by 2031 as service providers bundle regulatory compliance, bioinformatics, and turnkey reporting.
Pharma companies maintain in-house platforms for proprietary pipeline protection but increasingly supplement capacity with fee-for-service engagements during peak workloads. Government agencies and agricultural biotech remain small but high-impact segments, using spatial methods for infectious-disease pathology and plant genomics, respectively, pointing to diversification of end-user profiles beyond human oncology.
Geography Analysis
North America contributed 41.74% of 2025 spatial OMICS market revenue, reflecting mature installed bases around Boston, San Francisco, and San Diego. NIH funding and venture capital seeded early adoption, and the 2025 U.S. Department of Defense initiative added USD 75 million for traumatic brain injury spatial profiling, further entrenching regional leadership. Growth will align with the overall 13.33% CAGR as instrument saturation shifts revenue toward consumables and analytics.
Asia-Pacific is forecast to post a 14.65% CAGR through 2031, the fastest among regions, as China’s Shenzhen hub and Japan’s state-backed precision-oncology programs deploy localized platforms. Complete Genomics’ distribution of STOmics Stereo-seq in North America and reciprocal Chinese expansion demonstrates cross-border technology flows. India and Australia add incremental demand via tuberculosis and oncology consortia, respectively, while South Korea’s national centers build gastric and liver cancer atlases specific to East Asian epidemiology.
Europe accounted for roughly one-quarter of 2025 revenue. Horizon Europe grants and national precision-medicine policies drive adoption in Germany, the United Kingdom, and France. The European Medicines Agency’s 2024 reflection paper affirmed the importance of spatial context for biomarker qualification, supporting translational integration. Fragmented reimbursement and slower venture funding temper the regional CAGR, yet core facilities such as the Max Planck and Wellcome Sanger Institutes anchor a robust academic customer base. Emerging markets in Latin America and Africa together comprise less than 10% of current revenue, constrained by infrastructure deficits and limited reimbursement, but pilot projects in Brazil and South Africa indicate nascent adoption that could accelerate with ruggedized, lower-cost instruments.

Competitive Landscape
The spatial OMICS market exhibits moderate concentration: 10x Genomics, Illumina, NanoString, and Akoya Biosciences collectively control roughly 55% of 2025 revenue, while more than 15 smaller vendors share the remainder. Incumbents rely on installed next-generation sequencing and single-cell infrastructures to upsell spatial modules. Resolve Biosciences, Vizgen, and Lunaphore compete on resolution, multiplexing, and turnaround time; Resolve’s Molecular Cartography achieves 50-nm resolution, surpassing Visium’s tissue-capture grid.
Competitive strategies split between horizontal integration, offering end-to-end workflows from sample prep through cloud analytics, and vertical specialization in tissue or application niches. Patent landscapes shape positioning; 10x Genomics’ barcoded-bead intellectual property forces rivals to adopt alternative chemistries. Regulatory preparedness is a new differentiator: vendors that embed ISO 13485 processes and pursue CE-IVD or FDA clearances for clinical use edges ahead as spatial biomarkers near diagnostic applications. White-space opportunities remain in low-cost, field-deployable systems and fully regulated companion-diagnostic platforms.
Platform differentiation focuses on three axes. Imaging solutions deliver subcellular precision while handling 40-100-plex protein or 1,000-10,000-gene panels, whereas sequencing systems profile 20,000-plus genes but sacrifice single-cell clarity. Turnaround times hover at hours for imaging and days for sequencing, steering diagnostic labs toward imaging and discovery teams toward sequencing. Interoperability lags; no vendor holds sufficient sway to impose standards, so consortia push for open data formats. The spatial OMICS industry, therefore, remains innovation-driven, with rapid product cycles and partnership deals with pharma majors dictating share redistribution through 2031.
Spatial OMICS Industry Leaders
10x Genomics
Illumina Inc.
Danaher (Leica / Cytiva)
Revvity, Inc.
Bruker (NanoString Technologies)
- *Disclaimer: Major Players sorted in no particular order

Recent Industry Developments
- January 2026: Vizgen raised USD 48 million to commercialize MERFISH 2.0 and scale MERSCOPE Ultra manufacturing, targeting 200 placements by year-end 2026.
- March 2025: Complete Genomics, one of the leading innovators in genomic sequencing, announced at the NextGen Omics & Spatial Biology Conference that it has entered a commercial partnership with Human Cell Atlas (HCA) to offer its STOmics spatial transcriptomics products to HCA members.
- February 2025: Illumina unveiled a nine-times larger capture-area spatial-transcriptomics platform plus Connected Multiomics software, shipping in 1H 2026.


Global Spatial OMICS Market Report Scope
As per the scope of the report, spatial OMICS encompasses technologies that merge molecular profiling with spatial information, facilitating the analysis of biological samples in their native spatial environment.
The Spatial OMICS Market is Segmented by Technology (Spatial Transcriptomics, Spatial Genomics, Spatial Proteomics, and Spatial Epigenomics), Workflow (Sequencing-Based and Imaging-Based), Product (Instruments, Consumables, and Software & Analytics), Sample (FFPE, Fresh-Frozen), Application (Diagnostics, Translational Research, Drug Discovery & Development, Single-Cell Analysis, and Cell Biology), End-User (Academic & Translational Institutes, Pharmaceutical & Biotechnology Companies, CROs & CDMOs, and Other End-Users), and Geography (North America, Europe, Asia-Pacific, Middle East & Africa, and South America). The report also covers the estimated market sizes and trends for 17 countries across major regions globally. For each segment, the market sizing and forecasts were made on the basis of value (USD).
| Spatial Transcriptomics |
| Spatial Genomics |
| Spatial Proteomics |
| Spatial Epigenomics |
| Sequencing-Based |
| Imaging-Based |
| Instruments |
| Consumables |
| Software & Analytics |
| FFPE |
| Fresh-Frozen |
| Diagnostics |
| Translational Research |
| Drug Discovery & Development |
| Single-Cell Analysis |
| Cell Biology |
| Academic & Translational Institutes |
| Pharmaceutical & Biotechnology Companies |
| CROs & CDMOs |
| Other End-Users |
| North America | United States |
| Canada | |
| Mexico | |
| Europe | Germany |
| United Kingdom | |
| France | |
| Italy | |
| Spain | |
| Rest of Europe | |
| Asia-Pacific | China |
| Japan | |
| India | |
| Australia | |
| South Korea | |
| Rest of Asia-Pacific | |
| Middle East & Africa | GCC |
| South Africa | |
| Rest of Middle East & Africa | |
| South America | Brazil |
| Argentina | |
| Rest of South America |
| By Technology | Spatial Transcriptomics | |
| Spatial Genomics | ||
| Spatial Proteomics | ||
| Spatial Epigenomics | ||
| By Workflow | Sequencing-Based | |
| Imaging-Based | ||
| By Product | Instruments | |
| Consumables | ||
| Software & Analytics | ||
| By Sample | FFPE | |
| Fresh-Frozen | ||
| By Application | Diagnostics | |
| Translational Research | ||
| Drug Discovery & Development | ||
| Single-Cell Analysis | ||
| Cell Biology | ||
| By End-User | Academic & Translational Institutes | |
| Pharmaceutical & Biotechnology Companies | ||
| CROs & CDMOs | ||
| Other End-Users | ||
| Geography | North America | United States |
| Canada | ||
| Mexico | ||
| Europe | Germany | |
| United Kingdom | ||
| France | ||
| Italy | ||
| Spain | ||
| Rest of Europe | ||
| Asia-Pacific | China | |
| Japan | ||
| India | ||
| Australia | ||
| South Korea | ||
| Rest of Asia-Pacific | ||
| Middle East & Africa | GCC | |
| South Africa | ||
| Rest of Middle East & Africa | ||
| South America | Brazil | |
| Argentina | ||
| Rest of South America | ||


Key Questions Answered in the Report
How fast is the Spatial OMICS market expected to grow between 2026 and 2031?
It is projected to expand at a 13.33% CAGR, rising from USD 550.40 million in 2026 to USD 911.27 million by 2031.
Which technology segment is expanding most quickly?
Spatial proteomics is advancing at a 15.65% CAGR through 2031 thanks to antibody-conjugate chemistries that localize 100-plus proteins per tissue section.
Why are imaging-based workflows gaining share?
MERFISH and Xenium pipelines deliver subcellular resolution within hours, addressing clinical turnaround requirements while sequencing remains multi-day.
What limits wider adoption in community labs?
Instrument prices above USD 400,000 and consumables costing up to USD 3,000 per sample remain prohibitive despite emerging leasing and reagent-rental models.
Which region is growing fastest?
Asia-Pacific, posting a 14.65% CAGR because of Chinese and Japanese government-backed precision-medicine initiatives and domestic platform manufacturing.
How are CROs positioned in this space?
CROs are scaling at a 16.43% CAGR as biopharma outsources spatial profiling to manage cost and complexity while retaining rapid project turnaround.
Page last updated on:


