
Accelerated Computing Market Size and Share
Market Overview
| Study Period | 2020 - 2031 |
|---|---|
| Market Size (2026) | USD 217.82 Billion |
| Market Size (2031) | USD 546.42 Billion |
| Growth Rate (2026 - 2031) | 20.19 % |
| Fastest Growing Market | Asia-Pacific |
| Largest Market | North America |
| Market Concentration | High |
Major Players *Disclaimer: Major Players sorted in no particular order Image © Mordor Intelligence. Reuse requires attribution under CC BY 4.0. | |
Accelerated Computing Market Analysis by Mordor Intelligence
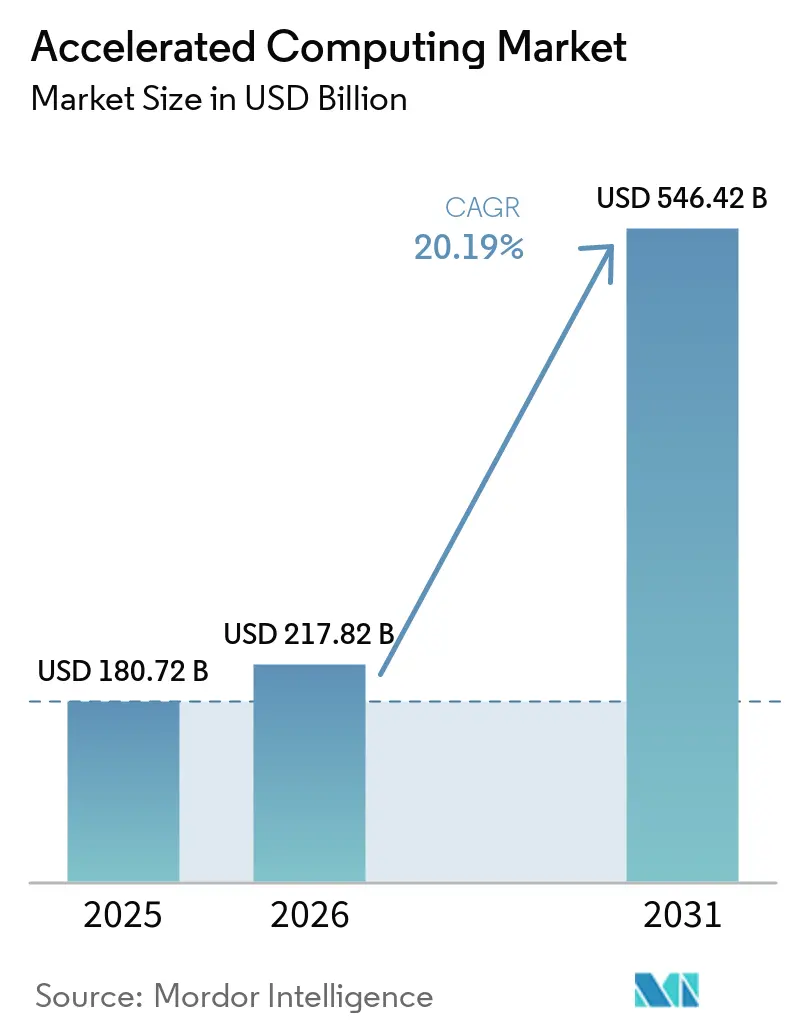
The accelerated computing market size is expected to grow from USD 180.72 billion in 2025 to USD 217.82 billion in 2026 and is forecast to reach USD 546.42 billion by 2031 at 20.19% CAGR over 2026-2031. The accelerated computing market is being shaped by a sharp rise in compute needs for large model development, where each new model cycle pulls in more GPUs, more high-bandwidth memory, and denser rack-level integration. The accelerated computing market is also broadening as inference moves into more production environments, shifting spending from a smaller number of training clusters toward a wider mix of cloud, on-premises, and edge systems. The accelerated computing market is seeing more custom silicon activity from hyperscalers, which is changing vendor strategy without yet reducing demand for leading GPU platforms. Power efficiency, cooling design, and optical interconnects are becoming purchasing criteria rather than secondary engineering choices, because infrastructure scale now depends on energy use as much as raw processing speed. Supply tightness in advanced nodes and changing export controls are not weakening demand for the accelerated computing market, but they are affecting procurement timing, regional supply choices, and the pace at which some buyers can expand capacity.
Key Report Takeaways
- By processor type, graphics processing unit held 55.34% of the accelerated computing market share in 2025, while custom application-specific integrated circuit are projected to grow at a 21.32% CAGR through 2031.
- By deployment, on-premises and data center deployments accounted for 51.48% of the accelerated computing market size in 2025, while edge and embedded deployments are expected to grow at a 21.51% CAGR through 2031.
- By function, training accounted for 54.16% of the accelerated computing market size in 2025, while inference is projected to grow at a 21.18% CAGR through 2031.
- By end user, hyperscale cloud service providers held 39.62% share in 2025, while healthcare and life sciences are projected to grow at a 21.37% CAGR through 2031.
- By geography, North America held 41.26% share of the accelerated computing market in 2025, while Asia-Pacific is projected to grow at a CAGR at 21.65% through 2031.
Note: Market size and forecast figures in this report are generated using Mordor Intelligence’s proprietary estimation framework, updated with the latest available data and insights as of January 2026.
Market Trends and Insights
Drivers Impact Analysis of Accelerated Computing Market*
| Driver | (~) % Impact on CAGR Forecast | Geographic Relevance | Impact Timeline |
|---|---|---|---|
| Rising Large Language Model Training Intensity | +4.8% | Global, with concentration in North America and APAC | Short term (≤ 2 years) |
| Rapid Expansion of Edge Inference Workloads | +3.5% | Global, APAC core, spill-over to the Middle East and Africa | Medium term (2-4 years) |
| Hyperscaler Custom Silicon Adoption | +3.2% | North America and Europe are primary, APAC is secondary | Short term (≤ 2 years) |
| Growing Adoption of Energy-Efficient Accelerator Architectures | +2.4% | Global | Medium term (2-4 years) |
| Advanced Cooling and Rack Density Optimization | +1.8% | North America and Europe | Medium term (2-4 years) |
| Silicon Photonics and Optical Interconnect Integration | +1.2% | North America, Europe, and APAC core | Long term (≥ 4 years) |
| Source: Mordor Intelligence | |||
Rising Large Language Model Training Intensity
Frontier model training now sits at the center of capital allocation across the accelerated computing market. Epoch AI data showed that training compute for frontier language models grew 5x per year since 2020, and power requirements doubled annually over the same period. The largest known training run by mid-2026 consumed 5×10²⁶ FLOPs, which was 24 times the compute used for GPT-4. That pattern matters because hardware demand no longer rises only with pre-training volume, as post-training steps such as fine-tuning, pruning, and reinforcement learning continue to extend the compute cycle after the base model is built. NVIDIA’s Blackwell platform reinforced this shift in June 2026, when MLPerf Training v6.0 results showed DeepSeek-V3 671B trained in 2.02 minutes on 8,192 GB300 NVL72 GPUs at CoreWeave.[1] The accelerated computing market, therefore, continues to favor vendors that can deliver scale at the rack level, not just higher performance at the chip level.
Rapid Expansion of Edge Inference Workloads
The accelerated computing market is expanding as inference workloads are spreading across devices and systems that cannot rely on distant cloud capacity for every task. That change gives greater weight to latency, local responsiveness, and power efficiency, thereby improving the position of ASICs, FPGAs, and specialized inference engines in automotive, industrial, and medical settings. The move toward agentic AI adds another layer, because separating prefill and decode stages creates room for different processors to handle different parts of the same workflow. NVIDIA validated that direction in December 2025 through a USD 20 billion licensing agreement with Groq, bringing LPU dataflow engines into liquid-cooled Rubin-generation LPX racks for low-latency inference. AWS also accelerated the inference cycle in June 2026 by making EC2 G7 instances generally available with NVIDIA RTX PRO 4500 Blackwell Server Edition GPUs, delivering up to 4.6x higher AI inference performance than the earlier generation. As these deployments scale, the accelerated computing market is likely to spread spending across a broader hardware mix instead of concentrating nearly all value in centralized training clusters.
Hyperscaler Custom Silicon Adoption
The accelerated computing market is also being reshaped by hyperscalers that are willing to design their own chips for repeatable internal workloads. Google introduced its 8th-generation TPU in April 2026 in two versions, TPU 8t for training and TPU 8i for inference, and stated that the new generation delivered up to 2x better performance per watt than the prior platform. Microsoft deployed Maia 200 across Azure data centers from January 2026 and said the chip delivered 10 petaflops of FP4 performance with 216 GB HBM3e and 30% better performance-per-dollar than the earlier generation. These programs show that cloud operators are not only buying accelerators, they are also trying to control the economics of training and inference through full-stack design choices. That does not diminish the role of GPUs in the accelerated computing market, as hyperscalers continue to expand GPU fleets at scale. It does, however, create a longer-term shift where more of the accelerated computing market may move toward workload-specific silicon in environments with stable demand and high utilization.
Growing Adoption of Energy-Efficient Accelerator Architectures
Energy efficiency is moving from a design preference to a hard operating requirement across the accelerated computing market. AI training run power needs have doubled each year, and frontier runs now consume power on a scale comparable to medium-sized power plants. Vendors are responding through system-level design, quantization methods, sparse activations, and better coupling between host processors and accelerators rather than relying only on raw transistor gains. Google’s 8th-generation TPU is the first TPU family to rely entirely on its Arm-based Axion CPU for host functions, suggesting power optimization at the full system level. IBM Japan’s selection in April 2026 for NEDO’s Post-5G program showed that national programs are now funding brain-inspired 2nm AI accelerator research for ultra-low-latency and ultra-low-power inference. This keeps the accelerated computing market focused on efficiency gains that support greater deployment, not on those that reduce hardware demand.
Restraints Impact Analysis of Accelerated Computing Market*
| Restraint | (~) % Impact on CAGR Forecast | Geographic Relevance | Impact Timeline |
|---|---|---|---|
| Sub-5 Nm Capacity Concentration | -2.8% | Global, concentrated in Taiwan | Short term (≤ 2 years) |
| Export-Control Uncertainty for Advanced Accelerators | -2.1% | Global, directly constrains US-China trade | Short term (≤ 2 years) |
| High Total Cost of Ownership for Liquid-Cooled Clusters | -1.9% | North America and Europe | Medium term (2-4 years) |
| HBM and Advanced Packaging Bottlenecks | -1.6% | Global, concentrated in South Korea and Taiwan | Medium term (2-4 years) |
| Source: Mordor Intelligence | |||
Sub-5 Nm Capacity Concentration
The accelerated computing market remains exposed to a narrow supply base at the most advanced process nodes. In June 2026, Wei said demand for advanced nodes exceeded available capacity by 25-30%, and relief was not expected until at least 2027. The constraint is not limited to logic production, because advanced packaging capacity for linking accelerator dies with HBM has also remained under pressure. That means some chip designers still face a practical barrier even after completing product design, because they cannot scale shipments without foundry and packaging allocation. The result is that procurement in the accelerated computing market can be delayed even when end demand remains strong. This also slows the pace at which smaller accelerator vendors can convert design wins into meaningful revenue, keeping supply concentrated among players with secured manufacturing access.
Export-Control Uncertainty for Advanced Accelerators
Export policy remains a second major constraint for the accelerated computing market because it affects both cross-border sales and planning certainty. The U.S. Bureau of Industry and Security revised export license review policy effective January 15, 2026, moving certain advanced computing exports to China and Macau from a presumption of denial to a case-by-case review tied to technical and end-user conditions. That change eased one part of the framework but did not remove compliance complexity, as exporters still have to meet narrow certification requirements. Reuters also reported in March 2026 that the United States was considering additional rules on AI chip exports and domestic investment requirements, adding another layer of uncertainty to large compute deals. In China, these controls are creating space for domestic accelerator suppliers to fill demand that would otherwise have gone to U.S. chip vendors. Over time, that dynamic can fragment software stacks and deployment practices across regions, which makes the accelerated computing market less standardized than buyers would prefer.
*Our forecasts treat driver/restraint impacts as directional, not additive. The impact forecasts reflect baseline growth, mix effects, and variable interactions.
Accelerated Computing Market Segment Analysis
By Processor Type:
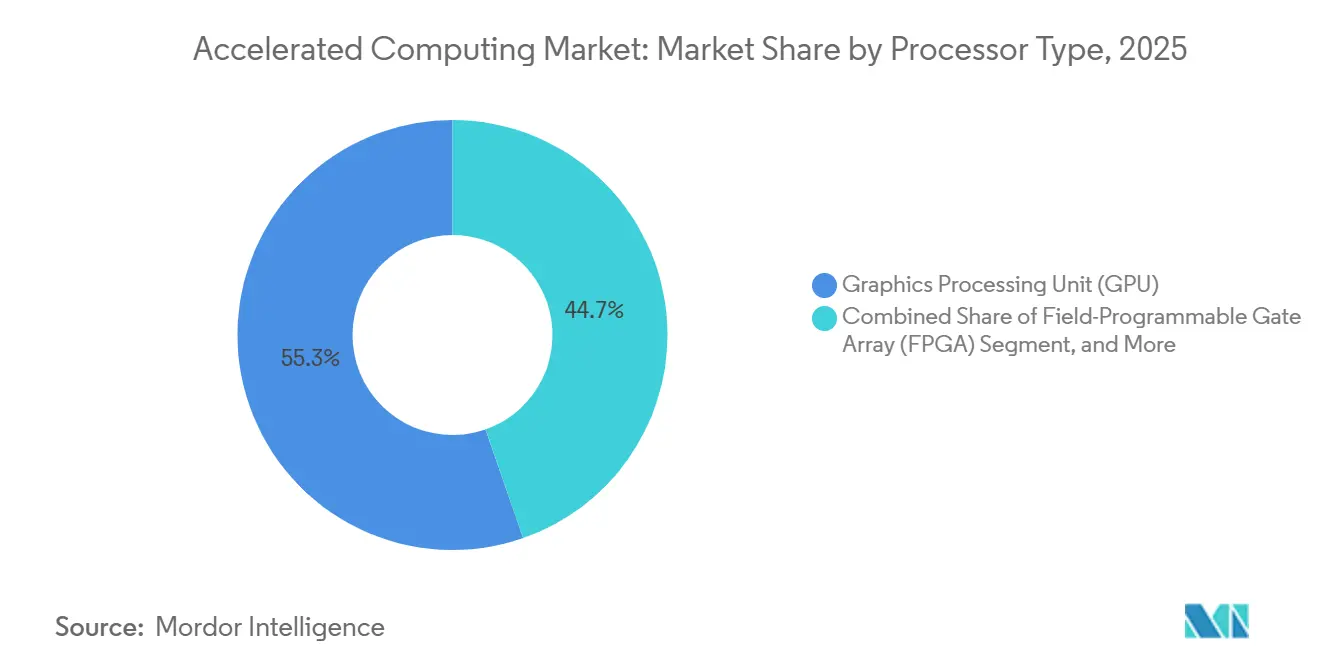
GPU Dominance and the ASIC InflectionGPUs held a 55.34% share of the accelerated computing market in 2025, reflecting the depth of NVIDIA’s CUDA ecosystem and its broad integration into AI frameworks, enterprise stacks, and cloud services. That share was not based solely on chip performance, because procurement teams also value software maturity, developer familiarity, and the lower switching costs that come with existing GPU workflows. In practice, GPUs remain the default choice for organizations seeking immediate access to high-throughput AI training and general-purpose inference. They also continue to benefit when buyers cannot commit early enough to a stable workload profile for custom chip design. This keeps the processor layer of the accelerated computing market centered on GPUs even as alternatives improve.
Custom ASICs are projected to grow at a 21.32% CAGR through 2031, making them the fastest-growing processor segment in the accelerated computing market. Their momentum comes mainly from hyperscaler programs that are designed around internal workloads with high utilization and tighter software control. Google’s TPU roadmap and Microsoft’s Maia 200 deployment show why the model is attractive, as both programs prioritize performance per watt and per dollar rather than broad third-party compatibility. FPGAs continue to hold a smaller but useful role in low-latency and reconfigurable use cases, while CPUs and NPUs are gaining relevance in edge inference where cost and efficiency matter more than maximum throughput. The accelerated computing industry still favors GPUs for broad deployment, but the accelerated computing market is steadily making more room for custom silicon where workloads are large, repeatable, and economically stable.

By Deployment:
Data Centers Anchor Revenue While Edge Reshapes GrowthOn-premises and data center deployments accounted for 51.48% of the accelerated computing market in 2025, underscoring that dense, centralized infrastructure still has the largest revenue base. This position is tied to hyperscalers and large enterprises that need clustered systems for frontier model training, large-batch inference, and secure internal deployments. High rack density, power delivery, cooling readiness, and software orchestration all favor buyers who can control their own infrastructure or work through specialized colocation models. That makes on-premises and data center environments the anchor for current revenue across the accelerated computing market. It also explains why suppliers still prioritize large-system integration and packaging scale at the top end of the product stack.
Edge and embedded deployment is forecast to grow at a 21.51% CAGR through 2031, which makes it the fastest-growing deployment model in the accelerated computing market. Growth comes from autonomous vehicles, industrial robots, and connected medical systems that require deterministic local processing rather than round-trip cloud reliance. These deployments are changing hardware selection because low latency and power efficiency matter more than peak floating-point output in many endpoint scenarios. Cloud remains important for enterprise buyers that cannot fund private clusters, but ownership economics become more attractive when utilization stays high for long periods. As inference workloads spread across more real-world environments, the accelerated computing market is likely to see a more balanced mix between centralized capacity and distributed compute footprints.
By Function:
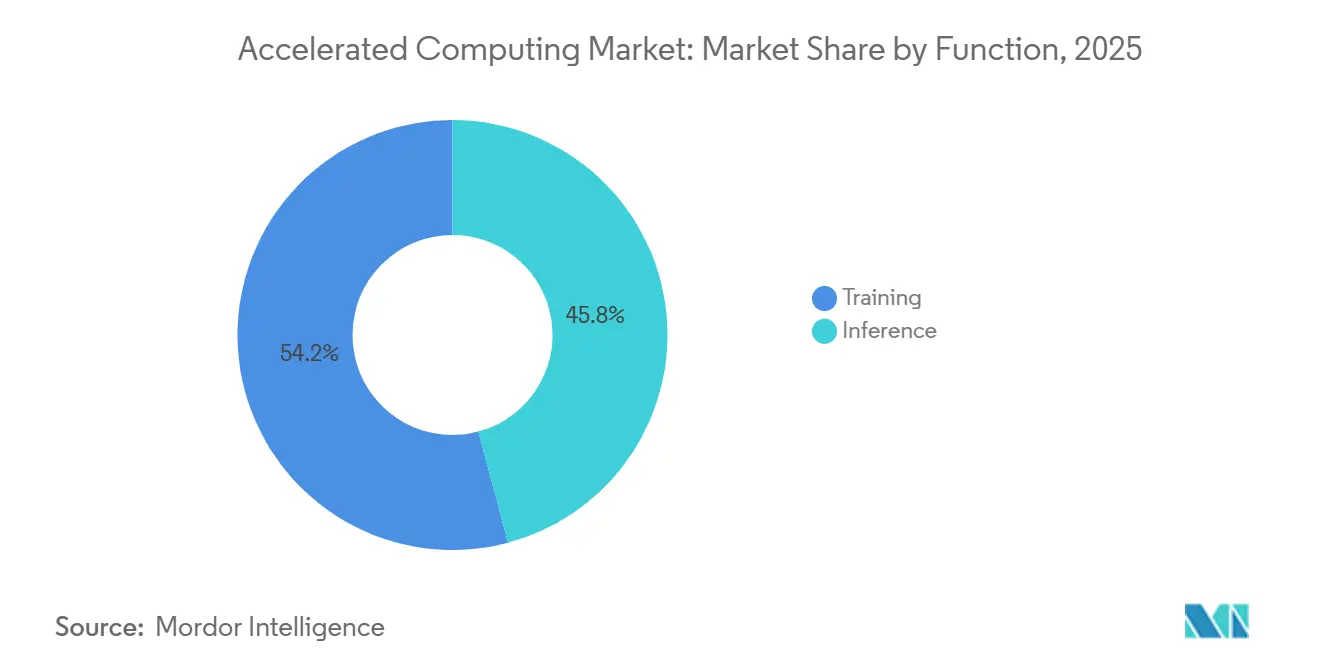
Training Anchors Spend While Inference Drives Volume EconomicsTraining held 54.16% of the accelerated computing market in 2025, underscoring the capital-intensive nature of frontier model development at the start of the forecast period. Training workloads still require the largest clusters, the highest memory bandwidth, and the longest sustained runtimes across the accelerated computing market. Each new generation of foundation models adds pressure on interconnects, HBM allocation, and system design, so buyers continue to prioritize platforms that can scale cleanly across thousands of accelerators. This keeps training at the center of revenue even as use cases diversify. It also supports continued demand for premium compute infrastructure in the short term.
Inference is projected to grow at a 21.18% CAGR through 2031, making it the fastest-growing function in the accelerated computing market. The shift matters because inference economics focus on token latency and output cost, not only raw throughput over long jobs. NVIDIA’s planned Groq 3 LPX racks and AWS G7 availability both reflect a move toward lower-latency production inference environments built around specific workload behavior. Hybrid designs are also becoming more visible, as Intel positioned Xeon 6+ as an orchestration and inference control plane for agentic deployments in June 2026. The accelerated computing industry is therefore moving toward purpose-built inference infrastructure, while the accelerated computing market keeps training as its main revenue base and inference as its main expansion path.
By End User:
Hyperscalers Lead While Healthcare Builds the Fastest UpsideHyperscale cloud service providers held 39.62% of the end-user share in 2025, giving them the largest position in the accelerated computing market. Their scale stems from direct infrastructure ownership and their role as the primary access point for enterprises that buy compute as a service rather than build private clusters. This concentration also means that product roadmaps at major accelerator vendors are strongly influenced by hyperscaler deployment cycles, software preferences, and rack-level operating targets. In effect, hyperscalers shape both supply planning and platform design across the accelerated computing market. Their spending patterns also support the high concentration seen at the upper end of the GPU tier.
Healthcare and life sciences are projected to grow at a 21.37% CAGR through 2031, making it the fastest-growing end-user segment in the accelerated computing market. NVIDIA’s 2026 healthcare survey found that 70% of healthcare organizations were using AI, up from 63% in 2024, and that 69% were deploying generative AI and large language models. Roche deployed more than 3,500 NVIDIA Blackwell GPUs by March 2026 across hybrid cloud and on-premises environments for drug discovery and diagnostics.[2] Eli Lilly also brought its AI factory online with 1,016 NVIDIA Blackwell Ultra GPUs for genomics, protein folding, and drug discovery workflows. These moves show that regulated data environments with high research intensity are becoming a strong demand center for the accelerated computing market, even while enterprise, government, defense, research, and automotive users continue expanding their own compute footprints.
Geography Analysis
North America Accelerated Computing Market
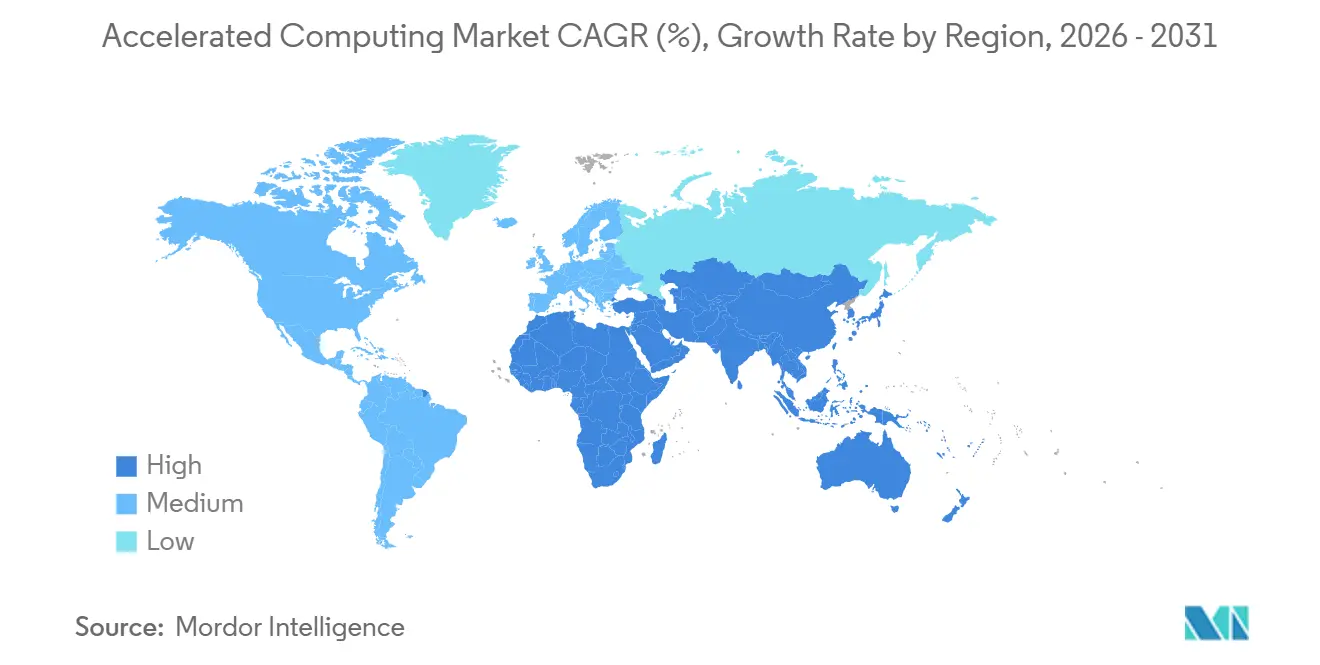
North America accounted for 41.26% of the accelerated computing market share in 2025, making it the largest regional contributor. The region benefits from the deepest concentration of hyperscaler capital, mature AI software ecosystems, and the broadest installed base of enterprise AI users. It also remains the main operating base for platform leaders that influence procurement standards, benchmark expectations, and commercial deployment models across the accelerated computing market. The United States leads this position through large-scale data center buildouts, while Canada adds capacity through Ontario and Quebec, and Mexico is gaining relevance from nearshore supply-chain shifts. Export compliance remains part of the regional operating picture because the January 2026 BIS framework affects how U.S.-based suppliers structure overseas sales and customer certifications.
APAC Accelerated Computing Market
Asia-Pacific is projected to grow at a 21.65% CAGR through 2031, which makes it the fastest-growing regional block in the accelerated computing market. Growth is being supported by sovereign AI compute programs that are moving from policy statements into funded infrastructure projects. Japan committed USD 13 billion through METI to semiconductor and industrial AI programs, and Microsoft said it would invest JPY 1.6 trillion (USD 10.3 billion) in Japan between 2026 and 2029 as regional AI infrastructure expands.[3] South Korea’s Financial Services Commission approved USD 5.7 billion for national AI infrastructure in May 2026, including a national AI compute center with 15,000 GPUs and an operator group led by Naver Cloud, Samsung SDS, and Ellis Group. China remains a large demand center but is developing under a different supply framework, as export restrictions continue to push domestic accelerator vendors into a stronger position.
EMEA, South America and APAC Accelerated Computing Market
Europe and the remaining regions account for the balance of the accelerated computing market, led by Germany, the United Kingdom, and France. European demand is being supported by automotive compute for ADAS and autonomous driving, industrial automation in manufacturing centers, and financial services use cases in the United Kingdom. South America, the Middle East and Africa, and smaller Asia-Pacific countries represent emerging pockets where national digital programs and data center investment are increasing demand for AI infrastructure. In these regions, the accelerated computing market is likely to develop through a mix of public-sector programs, sovereign data requirements, and selective enterprise adoption rather than through hyperscaler concentration alone.
Competitive Landscape
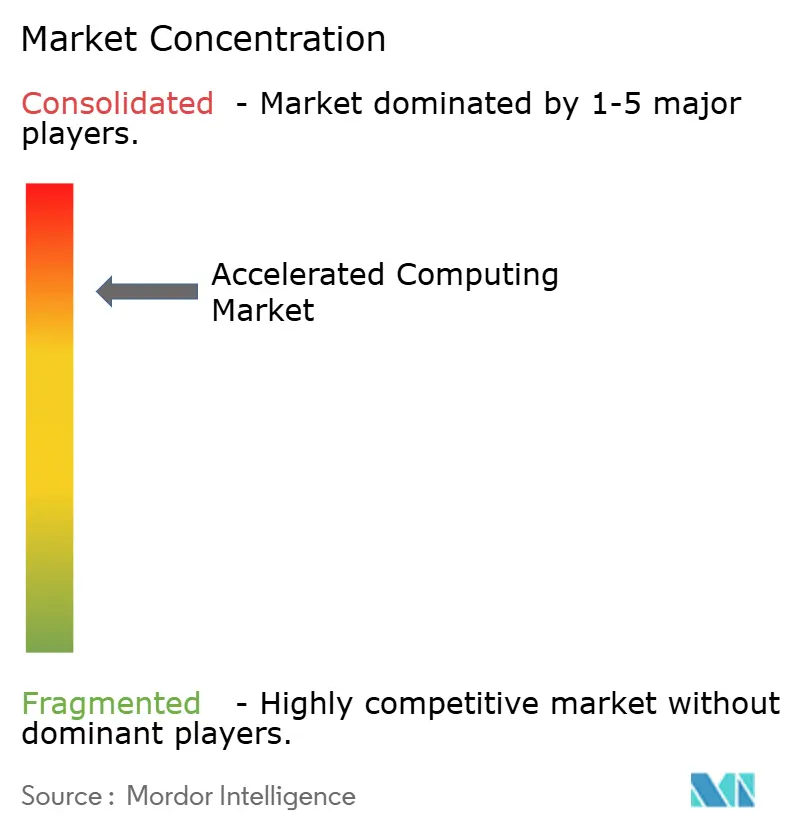
The accelerated computing market has a concentrated upper tier and a more fragmented second tier. NVIDIA sat at the center of the leading tier in 2025, with an estimated share of AI GPU revenue near 80%, supported by the CUDA software stack, broad framework compatibility, and deep integration with cloud and enterprise tooling. That position gives NVIDIA an advantage that goes beyond chip performance, because switching costs rise once customers have aligned training, inference, and operations around a single software base. The company also reinforced its position in June 2026 when Blackwell Systems led MLPerf Training v6.0 submissions at production scale, providing procurement teams with a public performance benchmark they can compare across vendors. In March and June 2026, NVIDIA also expanded its strategic posture by launching the Vera Rubin architecture and by moving Vera Rubin NVL4 systems into the scientific supercomputing pipeline with major system manufacturers.
AMD remains the primary GPU challenger in the accelerated computing market and is focusing on areas where differentiated performance can improve its share.[4] The company used June 2026 to preview the Instinct MI430X with more than 200 TFLOPS native FP64 performance, a direct push toward high-performance computing workloads that are less locked into NVIDIA’s software advantage. Intel is taking a different path by positioning Xeon 6+ and the Crescent Island roadmap around orchestration and heterogeneous inference rather than trying to win the training GPU race head-on. These strategies show that the accelerated computing market is not uniform, as vendors are choosing narrower entry points where they can win on integration, efficiency, or specific workload behavior. Even so, the top layer remains difficult to penetrate because cloud access, software maturity, and ecosystem scale still drive a large part of buying behavior.
Below the leading GPU tier, the accelerated computing market becomes more fragmented but not less important. Broadcom and Marvell are positioned behind hyperscaler custom silicon programs, which lets them benefit from cloud spending even when those programs do not show up as conventional accelerator brand share. Microsoft’s Maia 200 and Google’s TPU roadmap illustrate how design-partner economics can capture value from the same infrastructure cycle that supports GPU demand. Inference-focused entrants are also moving from concept to execution, as d-Matrix announced full production availability of its Corsair platform in June 2026 for agentic AI workloads D-MATRIX.AI. The competitive picture in the accelerated computing market is therefore concentrated at the top, but active at the edges where latency-focused, sovereign-compute, and heterogeneous inference designs still have room to win business.
Accelerated Computing Industry Leaders
-
NVIDIA Corporation
-
Advanced Micro Devices, Inc.
-
Intel Corporation
-
Qualcomm Incorporated
-
Broadcom Inc.
- *Disclaimer: Major Players sorted in no particular order
Accelerated Computing Market Companies Covered in this Report
- NVIDIA Corporation
- Advanced Micro Devices, Inc.
- Intel Corporation
- Qualcomm Incorporated
- Broadcom Inc.
- Marvell Technology, Inc.
- Cerebras Systems, Inc.
- Groq, Inc.
- Tenstorrent Inc.
- Graphcore Limited
- SambaNova Systems, Inc.
- Rebellions Inc.
- Hailo Technologies Ltd.
Recent Industry Developments in Accelerated Computing Market
- June 2026: NVIDIA announced the Vera Rubin NVL4 platform for scientific supercomputing at ISC High-Performance 2026, with global system manufacturers including Bull, Dell Technologies, HPE, and Supermicro bringing systems to market via liquid-cooled racks. Customer deployments are scheduled for Q4 2026.
- June 2026: AMD unveiled the upcoming Instinct MI430X GPU, projected to deliver more than 200 TFLOPS native FP64 performance, more than 6 times the FP64 performance of NVIDIA's next-generation Rubin architecture. Europe's new Alice Recoque supercomputer, operated by CEA in France, will deploy MI430X GPUs.
- June 2026: AWS announced general availability of EC2 G7 instances, accelerated by NVIDIA RTX PRO 4500 Blackwell Server Edition GPUs, delivering up to 4.6x AI inference performance versus G6 instances.
- June 2026: Intel launched Xeon 6+ processors with Efficient-cores for rack-density data center AI workloads and released updates on its Crescent Island AI accelerator roadmap, positioning the CPU as the orchestration and inference control plane for agentic AI deployments.
Global Accelerated Computing Market Report Scope
The Accelerated Computing Market refers to the segment of the computing industry focused on enhancing computational performance through specialized hardware and software solutions. This report covers the scope of accelerated computing technologies, including GPUs, FPGAs, ASICs, and other accelerators, along with their applications across industries such as healthcare, automotive, finance, and artificial intelligence.
The Accelerated Computing Market Report is Segmented by Processor Type (Graphics Processing Unit (GPU), Application-Specific Integrated Circuit (ASIC), Field-Programmable Gate Array (FPGA), and Central Processing Unit (CPU) and Neural Processing Unit (NPU)), Deployment (On-Premises and Data Center, Cloud-Based, and Edge and Embedded), Function (Training, and Inference), End User (Hyperscale Cloud Service Providers, Enterprise and Colocation Data Centers, Automotive OEMs and Tier-1 Suppliers, Healthcare and Life Sciences, Financial Services, Telecom and 5G Infrastructure, Government, Defense, and Research, and Manufacturing and Industrial Automation), and Geography (North America, Europe, Asia-Pacific, South America, and Middle East and Africa). The Market Forecasts are Provided in Terms of Value (USD).
Segmentation Overview
| Graphics Processing Unit (GPU) |
| Application-Specific Integrated Circuit (ASIC) |
| Field-Programmable Gate Array (FPGA) |
| Central Processing Unit (CPU) and Neural Processing Unit (NPU) |
| On-Premises and Data Center |
| Cloud-Based |
| Edge and Embedded |
| Training |
| Inference |
| Hyperscale Cloud Service Providers |
| Enterprise and Colocation Data Centers |
| Automotive OEMs and Tier-1 Suppliers |
| Healthcare and Life Sciences |
| Financial Services |
| Telecom and 5G Infrastructure |
| Government, Defense, and Research |
| Manufacturing and Industrial Automation |
| North America | United States |
| Canada | |
| Mexico | |
| Europe | Germany |
| United Kingdom | |
| France | |
| Italy | |
| Rest of Europe | |
| Asia-Pacific | China |
| Japan | |
| South Korea | |
| India | |
| Southeast Asia | |
| Rest of Asia-Pacific | |
| South America | |
| Middle East and Africa |
| By Processor Type | Graphics Processing Unit (GPU) | |
| Application-Specific Integrated Circuit (ASIC) | ||
| Field-Programmable Gate Array (FPGA) | ||
| Central Processing Unit (CPU) and Neural Processing Unit (NPU) | ||
| By Deployment | On-Premises and Data Center | |
| Cloud-Based | ||
| Edge and Embedded | ||
| By Function | Training | |
| Inference | ||
| By End User | Hyperscale Cloud Service Providers | |
| Enterprise and Colocation Data Centers | ||
| Automotive OEMs and Tier-1 Suppliers | ||
| Healthcare and Life Sciences | ||
| Financial Services | ||
| Telecom and 5G Infrastructure | ||
| Government, Defense, and Research | ||
| Manufacturing and Industrial Automation | ||
| By Geography | North America | United States |
| Canada | ||
| Mexico | ||
| Europe | Germany | |
| United Kingdom | ||
| France | ||
| Italy | ||
| Rest of Europe | ||
| Asia-Pacific | China | |
| Japan | ||
| South Korea | ||
| India | ||
| Southeast Asia | ||
| Rest of Asia-Pacific | ||
| South America | ||
| Middle East and Africa | ||
Key Questions Answered in the Report
What is the current and future size of accelerated computing?
The accelerated computing market was valued at USD 180.72 billion in 2025, rises to USD 217.82 billion in 2026, and is forecast to reach USD 546.42 billion by 2031 at a 20.19% CAGR.
Which processor category leads revenue in this space?
GPUs lead revenue with a 55.34% share in 2025, supported by broad software compatibility and established deployment across cloud and enterprise AI workloads.
Which deployment model is growing the fastest?
Edge and embedded deployment are projected to grow at a 21.51% CAGR through 2031 as automotive, industrial, and medical applications require local, low-latency inference.
Why is inference becoming more important than before?
Inference is projected to grow at a 21.18% CAGR through 2031 because more AI workloads are moving into production systems where token latency, cost, and responsiveness matter.
Which end users are creating the strongest growth opportunity?
Hyperscalers remain the largest end users with 39.62% share in 2025, while healthcare and life sciences is the fastest-growing segment at a 21.37% CAGR through 2031.
Which region offers the strongest expansion outlook?
North America leads with 41.26% share in 2025, while Asia-Pacific offers the fastest growth at a 21.65% CAGR as sovereign AI compute programs move into funded deployment.