
Desktop Computer Market Size and Share
Market Overview
| Study Period | 2020 - 2031 |
|---|---|
| Market Size (2026) | USD 88.66 Billion |
| Market Size (2031) | USD 109.73 Billion |
| Growth Rate (2026 - 2031) | 4.36 % |
| Fastest Growing Market | Asia-Pacific |
| Largest Market | Asia-Pacific |
| Market Concentration | Medium |
Major Players *Disclaimer: Major Players sorted in no particular order Image © Mordor Intelligence. Reuse requires attribution under CC BY 4.0. | |
Desktop Computer Market Analysis by Mordor Intelligence
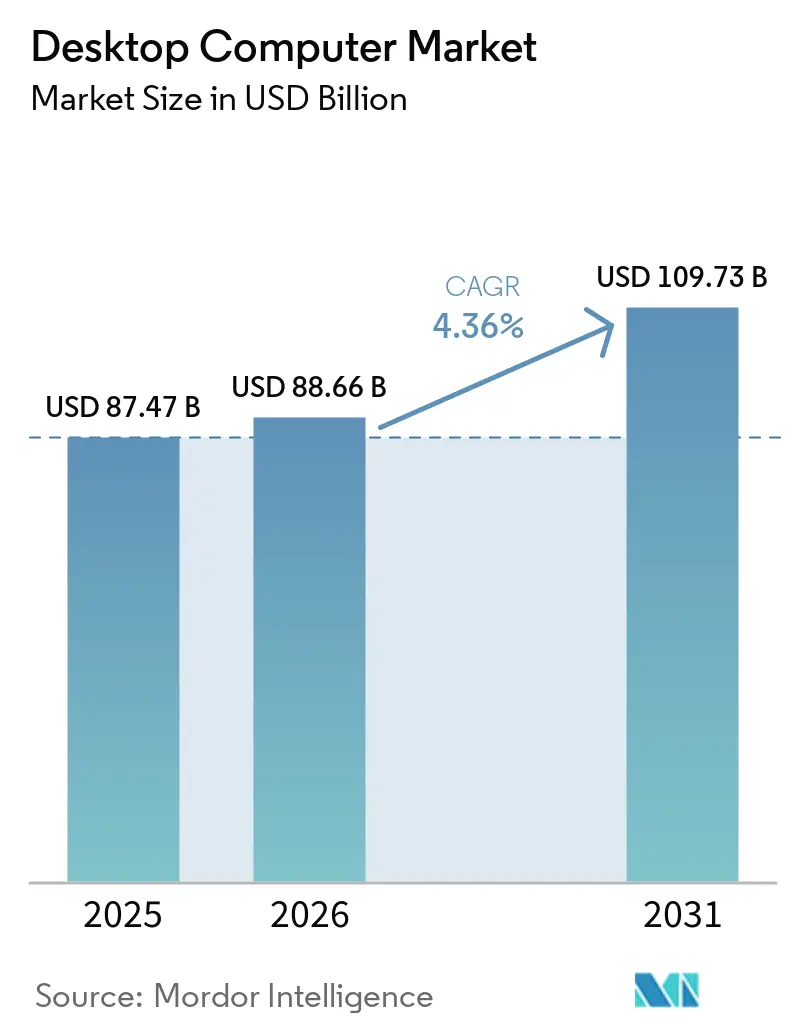
The desktop computer market size is expected to be USD 87.47 billion in 2025, USD 88.66 billion in 2026, and reach USD 109.73 billion by 2031, growing at a CAGR of 4.36% from 2026 to 2031. Enterprises accelerated refresh cycles ahead of Windows 10 end-of-support while gaming enthusiasts boosted demand for high-performance rigs. Component shortages that began in late 2025 kept shipment growth muted even as average selling prices rose. Hybrid work made desktops a fixture in both offices and homes, yet consumers are stretching replacement intervals, producing diverging trajectories across buyer groups. Public-sector digitalization in emerging economies and security mandates in regulated industries continue to anchor baseline demand.
Key Report Takeaways
- By form factor, tower/desktop configurations led with 38.40% revenue share in 2025, whereas gaming desktops are projected to expand at a 6.49% CAGR through 2031.
- By processor architecture, x86 Intel retained 50.85% of 2025 revenue, while ARM-based desktops record the highest forecast CAGR at 7.21% over 2026-2031.
- By enterprise size, large enterprises held 61.40% of 2025 demand, and small and medium enterprises are advancing at an 8.24% CAGR to 2031.
- By end user, residential buyers contributed 34.20% of 2025 revenue, yet gaming enthusiasts are growing fastest at 5.56% CAGR during 2026-2031.
- By sales channel, direct sales captured 46.90% of 2025 revenue, and online marketplaces are scaling at a 7.70% CAGR through 2031.
Note: Market size and forecast figures in this report are generated using Mordor Intelligence’s proprietary estimation framework, updated with the latest available data and insights as of January 2026.
Market Trends and Insights
Drivers Impact Analysis of Desktop Computer Market*
| Driver | (~) % Impact on CAGR Forecast | Geographic Relevance | Impact Timeline |
|---|---|---|---|
| Accelerating Hybrid Work Culture Driving Refresh Cycles | +1.2% | Global, peak in North America and Europe | Medium term (2-4 years) |
| Demand Surge for High-Performance Gaming Desktops | +0.9% | Global, led by North America, Europe, Asia-Pacific urban centers | Medium term (2-4 years) |
| Enterprise Security Mandates Favoring In-House Desktops | +0.8% | North America and Europe, spillover to Asia-Pacific hubs | Short term (≤ 2 years) |
| Government Digitalization Projects in Emerging Markets | +0.7% | Asia-Pacific, Middle East and Africa, South America | Long term (≥ 4 years) |
| Component Price Declines Enabling Lower ASPs | +0.4% | Global | Long term (≥ 4 years) |
| Energy-Efficient Designs Meeting Corporate ESG Targets | +0.3% | North America and Europe, spreading to Asia-Pacific | Medium term (2-4 years) |
| Source: Mordor Intelligence | |||
Accelerating Hybrid Work Culture Driving Refresh Cycles
Hybrid work entrenched desktops in home offices and corporate hot-desking areas. The October 2025 sunset of Windows 10 triggered synchronized enterprise upgrades, especially for tower and all-in-one models. Memory and CPU bottlenecks in early 2026 prolonged procurement timelines, forcing phased deployments. Organizations now split buying between baseline secure units for staff and high-performance workstations for analytics teams. Blanket purchase agreements updated every nine months by the U.S. General Services Administration simplify acquisition cycles.[1] These factors collectively keep enterprise interest in the desktop computer market resilient even as some workloads shift to cloud.
Demand Surge for High-Performance Gaming Desktops
eSports investments and enthusiast communities continue to propel high-spec towers. Products such as Corsair’s ONE i500 pack NVIDIA RTX 5090 GPUs and Intel Core Ultra CPUs into compact cases, commanding premium prices. Gaming cafés and leagues standardize on desktops for frame-rate stability, while accessory attach rates lift total spending. Although GPU supply improved, early 2026 CPU shortages delayed custom builds, highlighting supply-chain fragility. The segment’s expansion sustains the desktop computer market even when budget towers stagnate.
Enterprise Security Mandates Favoring In-House Desktops
Regulatory requirements in finance, healthcare, and defense sectors push organizations toward on-premises, encrypted desktops. Agencies prefer systems that stay inside secure perimeters, easing zero-trust implementation and audit compliance. ENERGY STAR and EPEAT Climate+ criteria further narrow qualified models, concentrating purchases among Lenovo, Dell, and HP units that meet both security and ESG thresholds. The result is a stable institutional underpinning for the desktop computer market amid rising cloud usage in less regulated industries.
Government Digitalization Projects in Emerging Markets
School labs, health clinics, and tax offices across Kenya, Ethiopia, the Philippines, and Jamaica continue bulk buying of tower and all-in-one desktops, funded by multilateral development programs. Chinese OEMs leverage local-content rules and aggressive pricing to win tenders, while Western brands retain sensitive contracts. These initiatives expand the installed base and give the desktop computer market a long runway in regions where notebooks remain cost-prohibitive.
Restraints Impact Analysis of Desktop Computer Market*
| Restraint | (~) % Impact on CAGR Forecast | Geographic Relevance | Impact Timeline |
|---|---|---|---|
| Lengthening Replacement Cycles Among Consumers | -0.6% | Global, strongest in North America, Europe, Japan | Medium term (2-4 years) |
| Notebook Cannibalization in Space-Constrained Offices | -0.5% | Global, peak in urban Asia-Pacific | Short term (≤ 2 years) |
| Global Semiconductor Supply Uncertainties | -0.4% | Global | Short term (≤ 2 years) |
| Growing Preference for Cloud and DaaS Models | -0.3% | North America and Europe, early Asia-Pacific adopters | Medium term (2-4 years) |
| Source: Mordor Intelligence | |||
Lengthening Replacement Cycles Among Consumers
Rising component costs eliminated sub-USD 500 systems, pushing households to retain existing towers beyond six years. Refurbished units satisfy value buyers, and incremental upgrades defer full replacements. Vendors therefore face softer consumer volumes even as premium gaming rigs flourish, holding back overall desktop computer market expansion.
Notebook Cannibalization in Space-Constrained Offices
Urban employers adopt laptop-first strategies to support hot-desking and client mobility. Docked notebooks replicate desktop ergonomics yet free valuable desk space, reducing fresh desktop deployments in professional services hubs. Vendors respond with mini PCs and all-in-ones, but these formats cannot fully offset the shift, posing an ongoing drag on the desktop computer market.
*Our forecasts treat driver/restraint impacts as directional, not additive. The impact forecasts reflect baseline growth, mix effects, and variable interactions.
Desktop Computer Market Segment Analysis
By Form Factor:
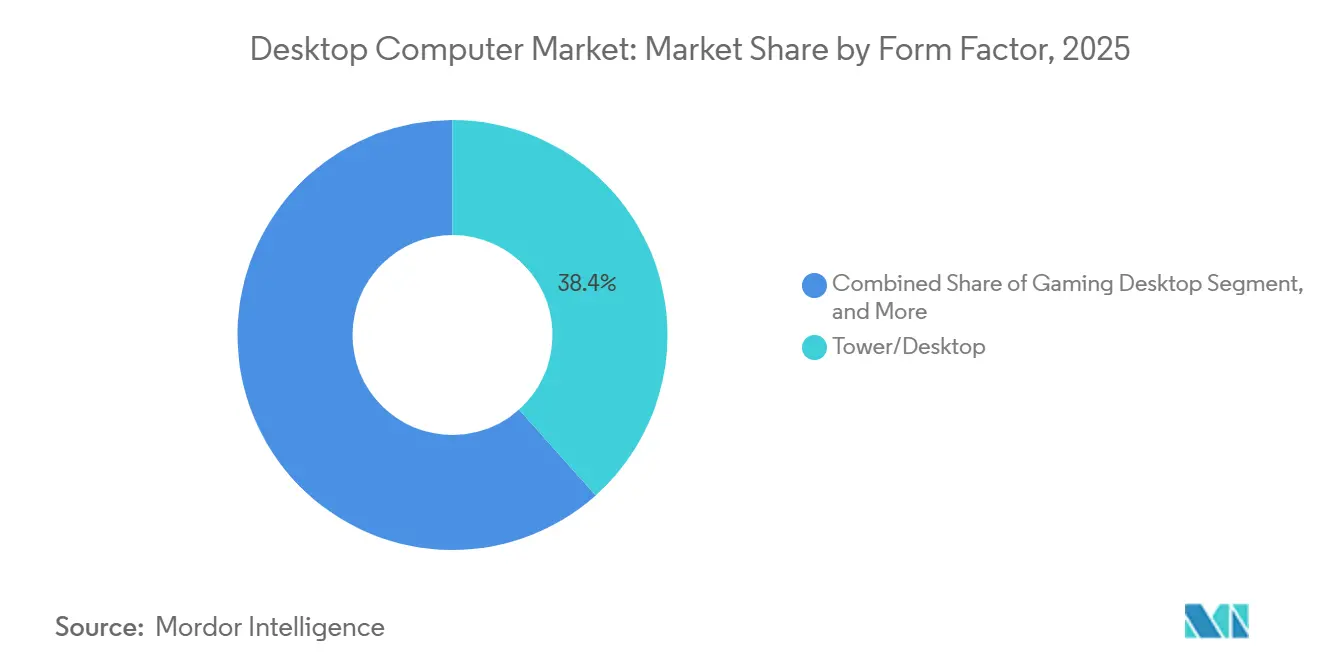
Gaming Desktops Sustain the Premium WaveGaming towers continued to pull incremental buyers into the desktop computer market as the segment logged a 6.49% forecast CAGR, the fastest among all form factors. Tower and desktop configurations still commanded 38.40% of 2025 revenue, underscoring their role in enterprise standardization and public-sector procurements. The desktop computer market size for gaming desktops is projected to reach double-digit billions during 2026-2031, supported by eSports venue installations and home enthusiast upgrades. Workstation towers hold a niche but resilient spot because architects and engineers still need multi-GPU capability that notebooks cannot match.
All-in-one systems remain the favored choice in space-constrained homes and offices, though their limited upgradability caps long-term appeal. Mini PCs grow steadily in digital signage and kiosk deployments where compact footprints matter more than raw horsepower. Together, these shifts force vendors to manage broader SKU portfolios and inventory risk across the wider desktop computer market. RGB lighting, liquid cooling, and tempered-glass cases have become must-have differentiators in premium gaming rigs, whereas large enterprises gravitate toward tool-less serviceability and security-ready chassis.

By Processor Architecture:
ARM Gains but x86 Retains ScaleIntel-based x86 chips supplied 50.85% of 2025 revenue, giving them the largest desktop computer market share among processor options. ARM devices, however, are set to post a 7.21% CAGR through 2031 as models such as ASUS’s Snapdragon X Elite V400 and Apple’s M4 iMac validate performance in productivity and creative workloads. The desktop computer market size for ARM-based systems is expected to climb steadily as energy efficiency and fanless operation resonate with ESG-minded buyers.
AMD extended momentum by capturing 36.4% desktop CPU share in Q4 2025, leveraging Intel’s wafer reallocations that lengthened shipment lead times. RISC-V remains marginal, but several industrial vendors are trialing open-architecture boards for edge workloads. Enterprises experimenting with hybrid fleets learn that software compatibility, rather than hardware cost, is the limiting factor, keeping x86 indispensable for gaming and CAD while ARM becomes the default for web-centric and AI-assisted office tasks.
By Enterprise Size:
SMEs Accelerate Digital AdoptionLarge entities accounted for 61.40% of 2025 demand, reflecting multi-year fleet refreshes tied to operating-system milestones. Nonetheless, small and medium enterprises, expanding at 8.24% CAGR, inject the fastest incremental value into the desktop computer market. The desktop computer market size for SME shipments is projected to climb meaningfully as cloud bookkeeping, CRM, and e-invoicing require reliable local hardware in regions with inconsistent broadband.
SMEs buy through online marketplaces and value-added resellers instead of direct contracts, broadening channel fragmentation. They also favor mid-range towers that balance cost with headroom for future component swaps. Large organizations, by contrast, standardize locked-down images on secure towers supplied under blanket purchase agreements, slimming support overhead. This bifurcation compels vendors to segment marketing, pricing, and service bundles with precision.[2]
By End User:
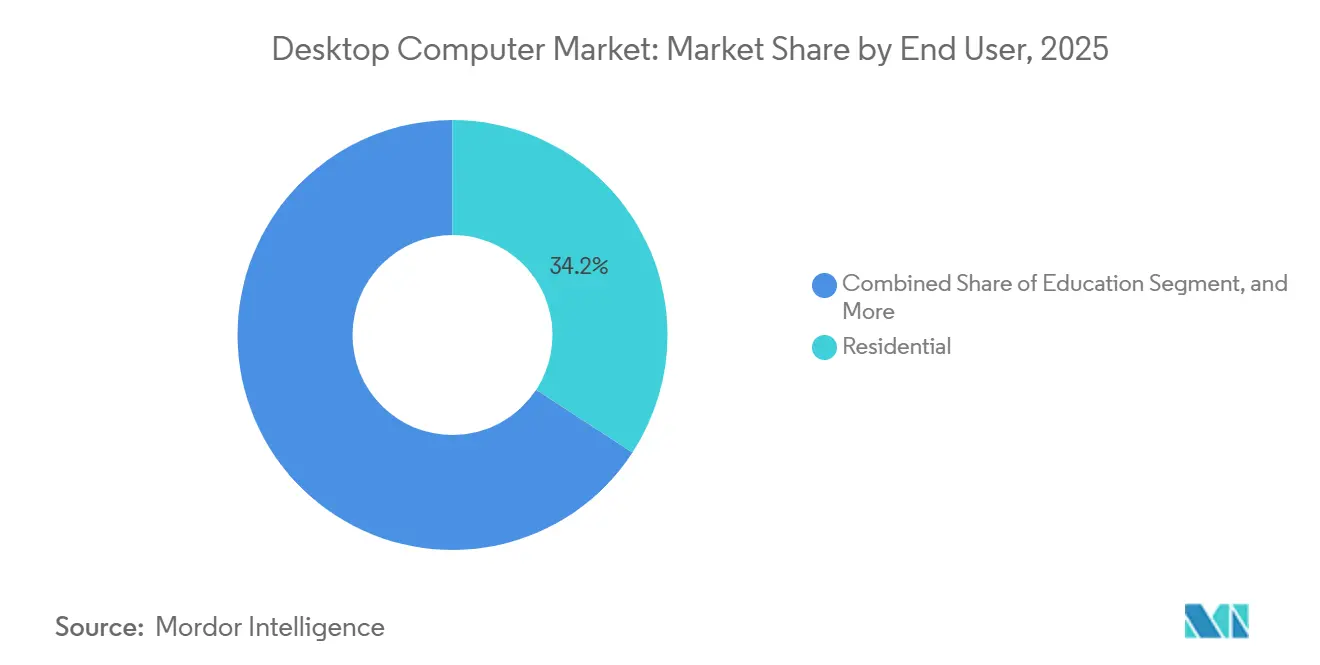
Gaming Enthusiasts Drive Premium SpendResidential buyers generated 34.20% of 2025 revenue, but gaming enthusiasts inside that cohort post the quickest 5.56% CAGR. Desktop computer market demand from gamers centers on 4K-capable rigs using NVIDIA RTX 5090 GPUs, Intel Core Ultra or AMD Ryzen top-bins, and custom water loops. Education and government verticals purchase primarily for standardized labs and office work, providing stable yet slower-growing volume.
In healthcare, retail, and hospitality, towers stay relevant for point-of-sale and patient-record stations because long service life trumps aesthetic considerations. Accessory attach remains strongest with gamers, whose purchases of mechanical keyboards and high-Hz monitors magnify per-seat revenue. The result is a premium-skewing tail that offsets weakness among casual home users who defer upgrades.
By Sales Channel:
Online Marketplaces Capture Incremental GrowthDirect sales delivered 46.90% of 2025 revenue thanks to enterprise contracts, but online marketplaces post a 7.70% CAGR to 2031, the highest across channels. Younger buyers default to e-commerce configurators that allow component comparisons and next-day shipping, cementing the desktop computer market’s channel transformation. The desktop computer market size moving through online portals will expand steadily as regional platforms replicate Amazon’s model in Asia-Pacific and South America.
Distributors and VARs safeguard relevance by bundling imaging, on-site service, and financing for SMEs and public agencies. Brick-and-mortar retail struggles to match online breadth and pricing. Vendors therefore juggle multichannel conflict, guarding direct margins while satisfying marketplace price transparency that customers now expect.
Geography Analysis
APAC Desktop Computer Market
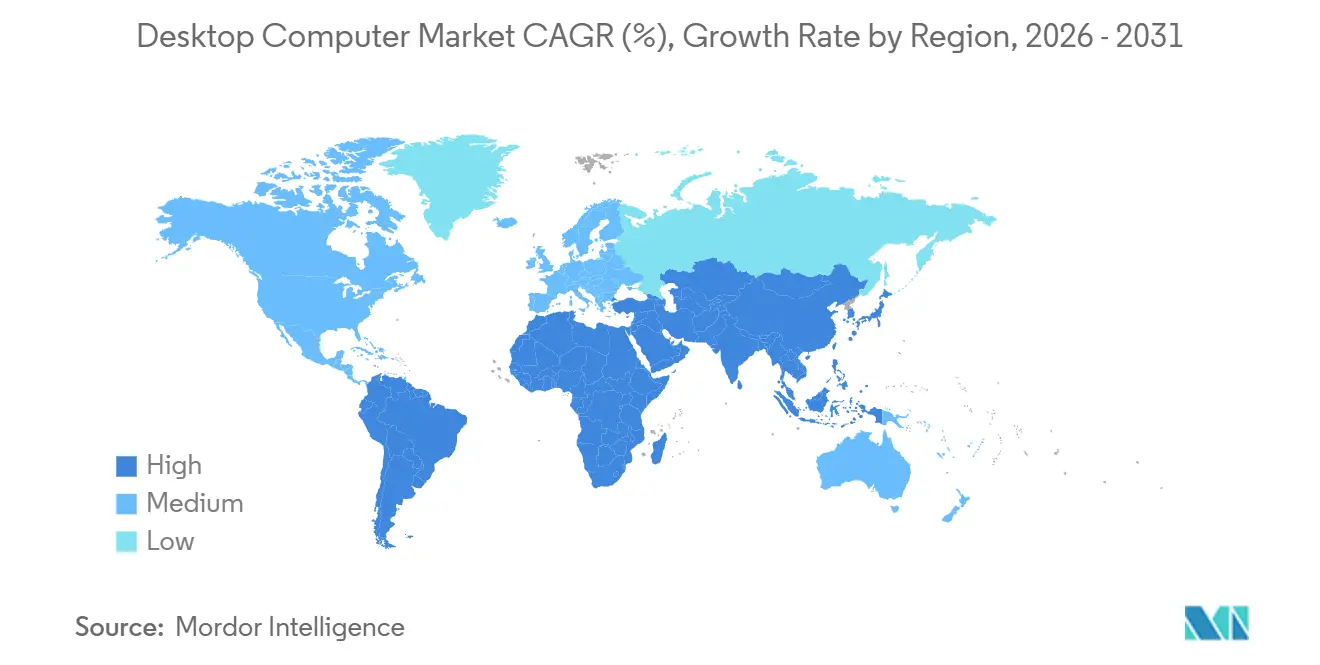
Asia-Pacific maintained 37.78% of 2025 revenue, with China shipping 42.1 million units and India 15.9 million. Government procurement, SME digitization, and gaming cafés underpin a 6.01% regional CAGR, ensuring the desktop computer market keeps expanding even when global cycles soften. Japan and South Korea depend on enterprise refreshes and enthusiast upgrades, while Indonesia, Vietnam, and the Philippines gain momentum from broadband rollout and classroom digitalization. Supply shortages in early 2026 prompted OEMs to prioritize profitable enterprise contracts, slightly constraining consumer availability.
North America Desktop Computer Market
North America faces headwinds from cloud desktops but draws counterbalancing strength from security-sensitive industries and high-performance gaming. U.S. federal blanket purchase agreements, refreshed in March 2026, compress acquisition lead times and sustain predictable demand. Canada’s 92% SME digital-tool adoption evidences structural modernization that benefits the broader desktop computer industry. Onshoring moves by Lenovo, Pegatron, and Foxconn bolster regional supply resilience and may temper future pricing shocks.
EMEA and South America Desktop Computer Market
Europe manages tighter energy standards, pushing enterprises toward EPEAT Climate+ certified towers. Germany, the United Kingdom, and France lead volumes, whereas Southern Europe prolongs replacement cycles amid fiscal constraints. South America leans on Brazil and Argentina government tenders and rising SME digital uptake, delivering modest yet stable contributions to the desktop computer market. In the Middle East and Africa, donor-funded education rollouts in Kenya, Ethiopia, and Nigeria, coupled with sovereign digital programs in Saudi Arabia and the UAE, keep unit demand climbing despite infrastructure deficits.
Competitive Landscape
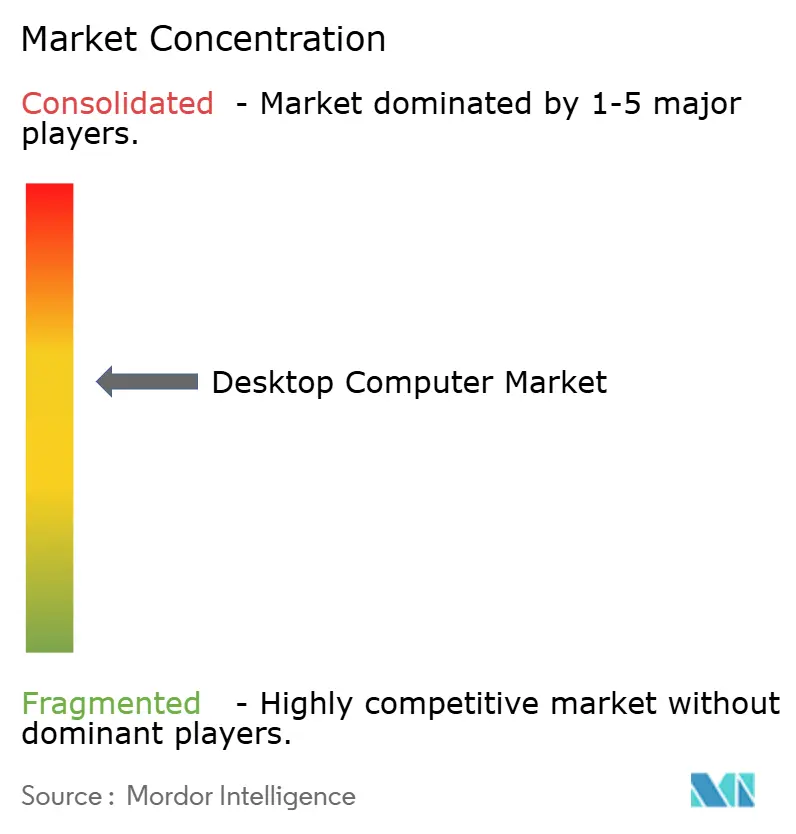
Lenovo, HP, and Dell collectively ship just above half of global units, placing the desktop computer market in a moderately concentrated state. Intel’s wafer reallocations toward Xeon lines in late 2025 stretched desktop CPU lead times to six months, giving AMD the opening to reach a record 36.4% desktop share in Q4 2025. ARM vendors seized momentum too: ASUS shipped the first Snapdragon X Elite all-in-one, and Apple’s M4 desktops continued to win creative professionals.
Gaming specialists Corsair, CyberPowerPC, and iBUYPOWER captured high-margin slices by marketing RGB-rich, pre-overclocked rigs with transparent upgrade paths. Chinese OEMs such as Huawei and Tongfang undercut incumbent pricing in emerging markets, especially on government tenders that value local support. Meanwhile, AI-optimized “Copilot-ready” desktops surfaced across nearly every brand as Intel Core Ultra and Snapdragon X Elite chips brought on-device inference engines to mainstream price bands.
Supply-chain localization shapes strategy: Foxconn expanded Wisconsin capacity, Pegatron chose Texas for its first U.S. board plant, and Micron committed USD 200 billion to domestic DRAM fabs that could secure component availability late in the decade.[3] Vendors that marry energy efficiency, security certification, and regional manufacturing are best positioned to climb share as ESG mandates tighten.
Desktop Computer Industry Leaders
-
Lenovo Group Limited
-
HP Inc.
-
Dell Technologies Inc.
-
Apple Inc.
-
ASUSTeK Computer Inc.
- *Disclaimer: Major Players sorted in no particular order
Desktop Computer Market Companies Covered in this Report
- Lenovo Group Limited
- HP Inc.
- Dell Technologies Inc.
- Acer Inc.
- ASUSTeK Computer Inc.
- Apple Inc.
- Micro-Star International Co., Ltd.
- Fujitsu Limited
- Huawei Technologies Co., Ltd.
- Samsung Electronics Co., Ltd.
- LG Electronics Inc.
- Tongfang Co., Ltd.
- Hasee Computer Co., Ltd.
- Xiaomi Corporation
- Zotac Technology Limited
- Corsair Gaming, Inc.
- CyberPowerPC, Inc.
- Systemax Inc.
- iBUYPOWER, Inc.
- Shenzhou Computer Co., Ltd.
Recent Industry Developments in Desktop Computer Market
- February 2026: Intel and AMD warned Chinese customers of six-month CPU lead times, pushing desktop OEMs to ration inventory.
- January 2026: Intel posted USD 13.7 billion Q4 FY2025 revenue and debuted three Core Ultra Series 3 SKUs with integrated NPUs.
- November 2025: Foxconn unveiled a USD 569 million expansion in Wisconsin, adding 1,374 jobs for AI server and desktop components.
- October 2025: Pegatron selected Georgetown, Texas, for a USD 35 million desktop PC and motherboard factory.
Global Desktop Computer Market Report Scope
The Desktop Computer Market encompasses fixed computing devices, including tower PCs, all-in-one desktops, mini PCs, and workstation desktops. Demand for high-performance, stable computing drives this market across enterprises, government, education, and professional content-creation environments. Evolving with refresh cycles and hardware innovations, the market also adapts to specialized workloads like engineering, graphics, and gaming. While mobility trends have influenced the landscape, desktops continue to play a vital role in productivity, security, and cost-efficient fleet deployments.
The Desktop Computer Market Report is Segmented by Form Factor (Tower/Desktop, All-in-One, Mini PC/Small Form Factor, Workstation Desktop, and Gaming Desktop), Processor Architecture (x86 Intel, x86 AMD, ARM-based, and RISC-V and Other), Enterprise Size (Small and Medium Enterprises, and Large Enterprises), End User (Residential, Education, Government, Gaming Enthusiasts, and Other End User), Sales Channel (Online Marketplaces, Direct Sales, and Distributors/Value-Added Resellers), and Geography (North America, Europe, Asia-Pacific, South America, Middle East, and Africa). The Market Forecasts are Provided in Terms of Value (USD).
Segmentation Overview
| Tower/Desktop |
| All-in-One |
| Mini PC/Small Form Factor |
| Workstation Desktop |
| Gaming Desktop |
| x86 (Intel) |
| x86 (AMD) |
| ARM-based |
| RISC-V and Other |
| Small and Medium Enterprises |
| Large Enterprises |
| Residential |
| Education |
| Government |
| Gaming Enthusiasts |
| Other End User |
| Online Marketplaces |
| Direct Sales |
| Distributors/Value-Added Resellers |
| North America | United States |
| Canada | |
| Mexico | |
| Europe | Germany |
| United Kingdom | |
| France | |
| Italy | |
| Spain | |
| Russia | |
| Rest of Europe | |
| Asia-Pacific | China |
| Japan | |
| India | |
| South Korea | |
| Australia and New Zealand | |
| Rest of Asia-Pacific | |
| South America | Brazil |
| Argentina | |
| Rest of South America | |
| Middle East | Saudi Arabia |
| United Arab Emirates | |
| Turkey | |
| Rest of Middle East | |
| Africa | South Africa |
| Egypt | |
| Nigeria | |
| Rest of Africa |
| By Form Factor | Tower/Desktop | |
| All-in-One | ||
| Mini PC/Small Form Factor | ||
| Workstation Desktop | ||
| Gaming Desktop | ||
| By Processor Architecture | x86 (Intel) | |
| x86 (AMD) | ||
| ARM-based | ||
| RISC-V and Other | ||
| By Enterprise Size | Small and Medium Enterprises | |
| Large Enterprises | ||
| By End User | Residential | |
| Education | ||
| Government | ||
| Gaming Enthusiasts | ||
| Other End User | ||
| By Sales Channel | Online Marketplaces | |
| Direct Sales | ||
| Distributors/Value-Added Resellers | ||
| By Geography | North America | United States |
| Canada | ||
| Mexico | ||
| Europe | Germany | |
| United Kingdom | ||
| France | ||
| Italy | ||
| Spain | ||
| Russia | ||
| Rest of Europe | ||
| Asia-Pacific | China | |
| Japan | ||
| India | ||
| South Korea | ||
| Australia and New Zealand | ||
| Rest of Asia-Pacific | ||
| South America | Brazil | |
| Argentina | ||
| Rest of South America | ||
| Middle East | Saudi Arabia | |
| United Arab Emirates | ||
| Turkey | ||
| Rest of Middle East | ||
| Africa | South Africa | |
| Egypt | ||
| Nigeria | ||
| Rest of Africa | ||
Key Questions Answered in the Report
What is the current desktop computer market size and expected growth?
The desktop computer market size stands at USD 88.66 billion in 2026 and is projected to reach USD 109.73 billion by 2031 at a 4.36% CAGR.
Which form factor is expanding fastest in the desktop computer market?
Gaming desktops are forecast to post a 6.49% CAGR between 2026-2031, the quickest among all form factors.
How are ARM-based desktops impacting the processor landscape?
ARM systems, led by Apple M4 and Snapdragon X Elite models, grow at a 7.21% CAGR yet x86 remains dominant due to software compatibility needs.
Why are SMEs important to future desktop sales?
SMEs digitize operations at an 8.24% CAGR, buying cost-efficient towers through online and VAR channels, thereby adding fresh volume to the desktop computer industry.
Which sales channel will capture the most incremental share?
Online marketplaces show the strongest momentum with a 7.70% CAGR as buyers prefer configurable, fast-delivery options.