High Performance Computing Market Size and Share
Market Overview
| Study Period | 2020 - 2031 |
|---|---|
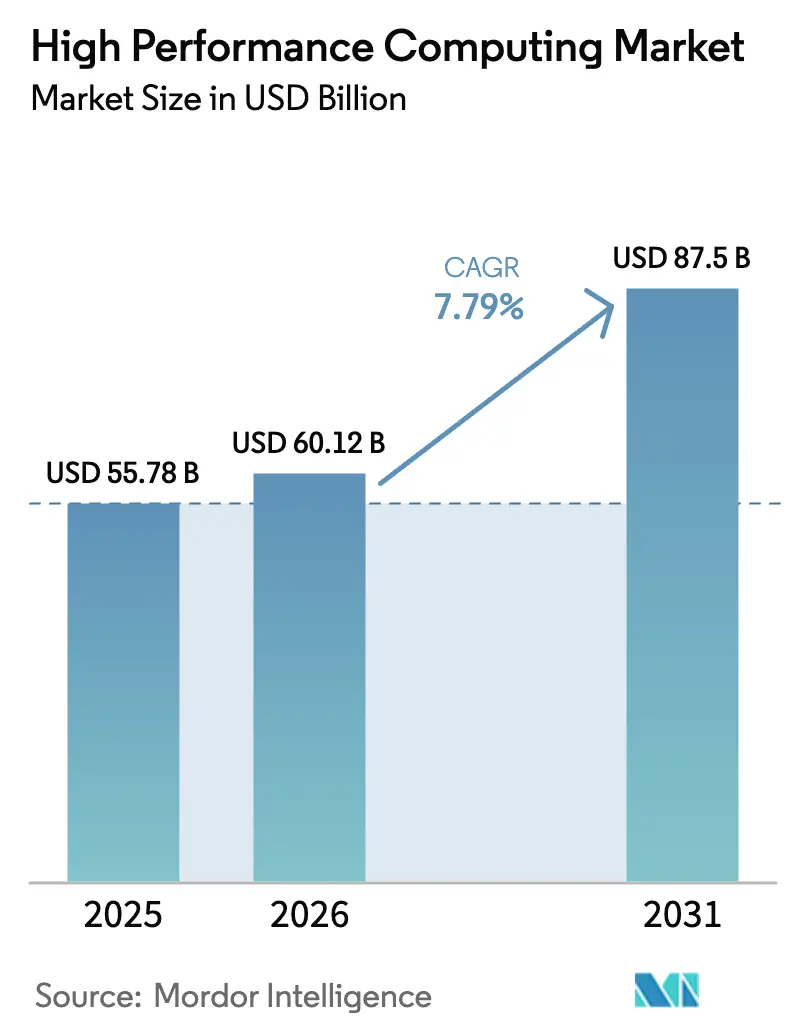
| Market Size (2026) | USD 60.12 Billion |
| Market Size (2031) | USD 87.5 Billion |
| Growth Rate (2026 - 2031) | 7.79% CAGR |
| Fastest Growing Market | Asia Pacific |
| Largest Market | North America |
| Market Concentration | Medium |
Major Players *Disclaimer: Major Players sorted in no particular order Image © Mordor Intelligence. Reuse requires attribution under CC BY 4.0. | |
High Performance Computing Market Analysis by Mordor Intelligence
The High Performance Computing Market size is projected to expand from USD 55.78 billion in 2025 and USD 60.12 billion in 2026 to USD 87.5 billion by 2031, registering a CAGR of 7.79% between 2026 to 2031. This trajectory is fueled by sovereign artificial-intelligence mandates in Asia, record federal appropriations for exascale programs in the United States and an accelerating pivot toward simulation-driven product design across automotive, life-sciences and energy workflows. Persistent supply shortages of high-bandwidth memory and the migration of inference workloads from general-purpose GPUs to custom accelerators also reshape server configurations, encouraging enterprises to adopt modular liquid-cooling and chiplet architectures that extend system lifetimes. Government customers are moving from capability experiments to mission-critical operations, evidenced by the 2024 commissioning of the 2-exaflop El Capitan system for nuclear-stockpile stewardship, while private-sector buyers are tapping cloud burst capacity to handle episodic peaks in computational fluid dynamics and Monte Carlo risk calculus. In parallel, the EURO-NCAP 2030 virtual-testing mandate forces European automotive original-equipment manufacturers to triple simulation throughput, indirectly intensifying GPU demand that already outstrips supply. Against this backdrop, Asia Pacific-based contract research organizations leverage lower energy tariffs and sovereign subsidies to win pharma outsourcing work from North American peers, demonstrating that geography-specific cost structures now modulate workload placement.
Key Report Takeaways
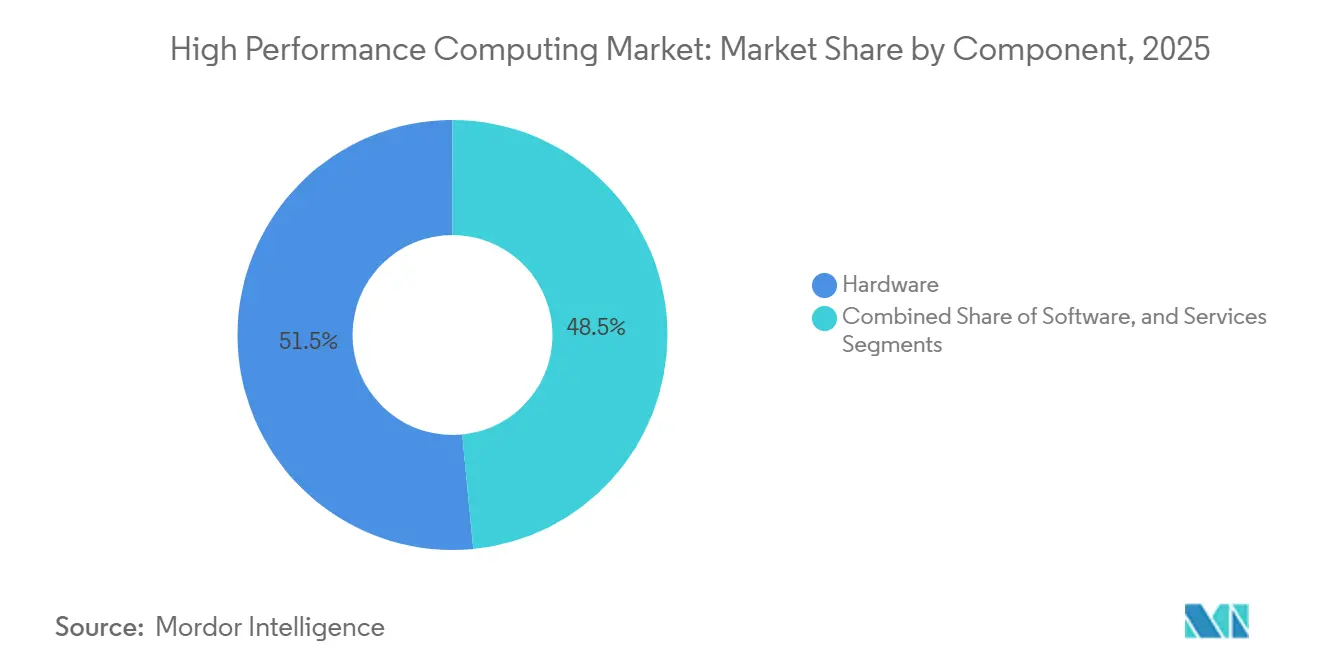
- By component, hardware retained a 51.54% share of the high performance computing (HPC) market in 2025, whereas services are advancing at a 9.42% CAGR through 2031, the fastest rate among all components.
- By deployment mode, cloud installations controlled 48.88% of the HPC market in 2025, while hybrid architectures are forecast to record an 8.22% CAGR to 2031.
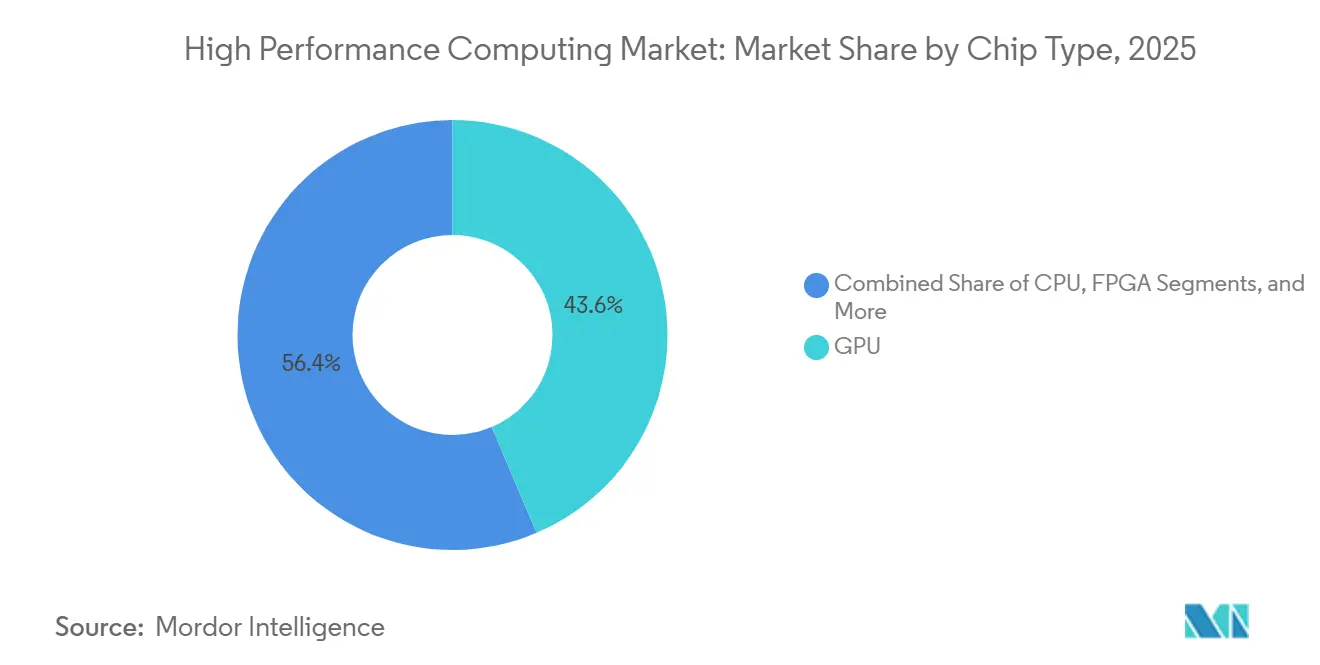
- By chip type, GPU-based systems secured 59.22% of 2025 revenue, yet application-specific integrated circuits and AI accelerators are projected to expand at an 8.86% CAGR, the segment’s highest growth pace.
- By industrial application, government and defense workloads led with 24.16% of the HPC market share in 2025, whereas life sciences are poised to grow at a 9.54% CAGR, the fastest among current use cases.
- By geography, North America captured 40.48% of revenue in 2025; however, Asia Pacific is the fastest-rising region with a 7.98% CAGR expected through 2031.
Note: Market size and forecast figures in this report are generated using Mordor Intelligence’s proprietary estimation framework, updated with the latest available data and insights as of January 2026.
Market Trends and Insights
Drivers Impact Analysis of High Performance Computing Market*
| Driver | (~) % Impact on CAGR Forecast | Geographic Relevance | Impact Timeline |
|---|---|---|---|
| Explosion of AI and ML training workloads in U.S. federal labs and tier-1 cloud providers | +2.1% | North America, with spillover to Europe and Asia Pacific hyperscale regions | Medium term (2-4 years) |
| Surging demand for GPU-accelerated molecular dynamics in Asian pharma outsourcing hubs | +1.3% | Asia Pacific core (China, India, South Korea), expanding to Southeast Asia | Short term (≤ 2 years) |
| Mandatory automotive ADAS simulation compliance in EU EURO-NCAP 2030 roadmap | +1.5% | Europe (Germany, France, Italy), with adoption in North America and Japan | Long term (≥ 4 years) |
| National exascale initiatives driving indigenous processor adoption in China and India | +1.2% | Asia Pacific (China, India), with limited technology transfer to Middle East | Long term (≥ 4 years) |
| Rapid adoption of digital twins for grid-scale battery storage optimization | +0.9% | Global, with early concentration in California, Texas, Germany, Australia | Medium term (2-4 years) |
| Emergence of quantum-inspired annealing accelerators for portfolio optimization | +0.6% | North America and Europe financial hubs (New York, London, Singapore) | Long term (≥ 4 years) |
| Source: Mordor Intelligence | |||
The Explosion of AI and ML Training Workloads in U.S. Federal Labs and Tier-1 Cloud Providers
Federal agencies now embed petaflop-scale infrastructure into operational AI pipelines rather than isolated research sandboxes. Oak Ridge National Laboratory’s 1.2-exaflop Frontier trains foundation models that compress battery-chemistry discovery cycles from 18 months to 6 weeks, validating the transition from exploratory benchmarks to real-world deliverables.[1]Frontier Supercomputer Debuts as World's Fastest, Oak Ridge National Laboratory, ornl.gov The National Science Foundation’s 2025 Genesis Mission earmarks USD 800 million for distributed AI clusters across 20 universities, multiplying regional access to high performance computing market resources. Microsoft Azure’s ND H100 v5 instances provide 3.2-terabit-per-second InfiniBand fabrics that let pharmaceutical firms build 100-billion-parameter transformers without cross-region sharding. The combined federal-private stimulus advances GPU refresh cycles, rendering legacy A100 nodes economically obsolete for trillion-parameter workloads and tightening demand for scarce HBM3e-based accelerators.
Surging Demand for GPU-Accelerated Molecular Dynamics in Asian Pharma Outsourcing Hubs
Contract research organizations in China and India deploy thousands of GPUs to compress small-molecule binding simulations from weeks to hours, leveling the playing field against Western pharmaceutical incumbents. WuXi AppTec’s 5,000-GPU Shanghai cluster screens 10 million compounds per quarter at 40-times CPU throughput, delivering cost per GPU-hour roughly 60% lower than North American labs thanks to subsidized electricity and tax holidays.[2]Business Healthcare and Pharmaceuticals, Reuters, reuters.com India’s PARAM Rudra allocates one-third of its 2025 compute budget to Council of Scientific and Industrial Research laboratories, accelerating tuberculosis drug discovery by fusing AlphaFold-generated protein structures with GPU-driven docking engines.[3]MeitY National Supercomputing Mission, Government of India, meity.gov.in This geographic arbitrage shifts pharmaceutical preclinical pipelines eastward, reinforcing Asia Pacific’s long-run share of the high performance computing market.
Mandatory Automotive ADAS Simulation Compliance in EU EURO-NCAP 2030 Roadmap
Virtual testing now underpins five-star safety ratings across Europe, obligating automakers to model 10 billion digital kilometers before physical prototypes crash into concrete walls. Volkswagen committed to 500 petaflops of new capacity by 2027 and Stellantis earmarked EUR 300 million (USD 339 million) for a Turin simulation hub fed by 4 million connected-vehicle telematics streams. GPU-rich clusters capable of rendering sensor-fusion scenarios at 1,000 frames-per-second replace multi-million-dollar crash labs, producing an immovable layer of compute demand regardless of cyclic vehicle sales. The roadmap also propagates to U.S. and Japanese subsidiaries, widening the addressable high performance computing market horizon.
National Exascale Initiatives Driving Indigenous Processor Adoption in China and India
Export-control friction accelerated domestic silicon programs. China’s 1.3-exaflop Sunway Oceanlight relies on SW26010-Pro processors fabbed at 14 nanometers, sidestepping foreign licensing while supporting climate and aerospace research at scale. India’s 64-core ARM-based AUM processor anchors the forthcoming PARAM Siddhi-AI system to be commissioned in 2026 and confers supply-chain sovereignty for defense use cases. Although single-thread performance lags Western CPUs, massive core counts confer competitively high throughput per watt. These systems divide the global high performance computing market along geopolitical axes, with Western vendors competing on performance and Asian suppliers on autonomy.
Restraints Impact Analysis of High Performance Computing Market*
| Restraint | (~) % Impact on CAGR Forecast | Geographic Relevance | Impact Timeline |
|---|---|---|---|
| Escalating datacenter water-usage restrictions in drought-prone U.S. states | -0.8% | Western United States (California, Arizona, Nevada), with emerging constraints in Texas | Short term (≤ 2 years) |
| Ultra-low-latency edge requirements undermining centralized cloud economics | -0.6% | Global, with acute impact in autonomous vehicle and industrial IoT deployments | Medium term (2-4 years) |
| Global shortage of HBM3e memory constraining GPU server shipments 2024-26 | -1.1% | Global, with supply bottlenecks concentrated in South Korea and Taiwan | Short term (≤ 2 years) |
| Cyber-sovereignty regulations limiting cross-border HPCaaS workloads | -0.7% | Europe (GDPR), China (Data Security Law), Russia, with spillover to India and Brazil | Long term (≥ 4 years) |
| Source: Mordor Intelligence | |||
Escalating Datacenter Water-Usage Restrictions in Drought-Prone U.S. States
Water scarcity now dictates site selection. California’s 20% industrial-use reduction order forced Tier-3 facilities to retrofit with dry cooling that raises power draw by 15%, adding USD 50 million per site in 2025 retrofit capital.[4]Water Boards Industrial Restrictions, California State Water Resources Control Board, waterboards.ca.gov Arizona halted new groundwater permits in Phoenix, compelling builders to incorporate closed-loop liquid cooling or cancel projects. Google postponed a 200-megawatt Nevada HPC site for lack of water rights, substituting a costlier air-cooled design. Capacity shifts north toward Oregon and Washington, but that realignment increases latency for California-based AI startups that previously enjoyed single-region round-trip times below 10 milliseconds.
Global Shortage of HBM3e Memory Constraining GPU Server Shipments 2024-26
HBM3e stacking yields remain below 60%, capping NVIDIA’s H200 allocations and forcing quota-based deliveries favoring hyperscalers over enterprise buyers. Samsung’s validation delays push meaningful supply into mid-2026, prolonging lead times on Dell’s XE9680 servers, whose backlog ballooned to USD 2 billion in fiscal 2025. Cloud launches slip as well; AWS shifted P5e general availability to mid-2026. A chronic silicon-memory mismatch elevates accelerator pricing and slows rollout of AI inference services, subtracting 1.1% from the compound growth slope of the HPC market.
*Our forecasts treat driver/restraint impacts as directional, not additive. The impact forecasts reflect baseline growth, mix effects, and variable interactions.
High Performance Computing Market Segment Analysis
By Component:
Services Outpace Hardware as Consumption Models Reshape ProcurementServices recorded the fastest trajectory, expanding at a 9.42% CAGR from 2026 to 2031 as enterprises transition away from multimillion-dollar capital purchases toward pay-per-core-hour contracts. Hardware still accounted for 51.54% of 2025 revenue, but the high performance computing market size for services is projected to surpass USD 30 billion by 2031, closing the historical gap. Managed HPC and HPC-as-a-Service offerings allow aerospace and banking clients to spin up 100,000-core clusters for two-day burst windows instead of locking funds into five-year depreciation cycles, improving budget agility when demand is episodic. System-integration engagements now bundle application porting, code refactoring and performance tuning, particularly for legacy Fortran or C kernels that require GPU-optimized rewrites to exploit concurrency. Within hardware, however, GPU-accelerated nodes remain supply-constrained, and direct-to-chip liquid cooling becomes mandatory as 700-watt devices push rack densities beyond 120 kilowatts.
Professional-services vendors increasingly guarantee performance targets measured in wall-clock hours, not utilization percentages, aligning incentives with customer outcomes. Flash arrays dominate latency-sensitive workloads, while object repositories store exabyte-scale genomics archives. Interconnect sales migrate to 400-gigabit Ethernet for cost-conscious buyers and to InfiniBand NDR for top-end deployments that must train 100-billion-parameter models within 10 days. Software revenue, though smaller, underpins job-scheduling, data-orchestration and hybrid-burst automation, enabling policy-driven placement that factors cloud spot pricing and data-residency rules in the HPC market. Altogether these shifts re-rank vendor margin structures and tilt long-term value capture toward recurring services.


By Deployment Mode:
Hybrid Architectures Reconcile Sovereignty with ElasticityCloud held 48.88% of 2025 revenue, but the high performance computing market size for hybrid deployments is projected to expand fastest, growing at an 8.22% CAGR through 2031 as security and cost considerations dictate a blended approach. Enterprises discover that sustained workloads exceeding 18 months achieve lower total cost of ownership on owned infrastructure, whereas seasonal or exploratory computations still favor cloud burst. Defense agencies and high-frequency traders, constrained by sub-millisecond latency and air-gapped security mandates, keep control planes on-premise yet outsource parameter sweeps to public clouds during off-hours. Schlumberger’s 2025 migration to a Houston-plus-OCI model underscores the savings potential of hybrid, trimming USD 120 million from projected three-year capital spend.
Operational complexity rises with workload portability, egress fees at USD 0.12 per gigabyte make petabyte shuffling uneconomical, so firms prioritize compute-to-data ratios when selecting execution venues. Kubernetes-native schedulers such as IBM Spectrum LSF and HPE Slingshot automate placement, but compliance officers still vet cross-border data flows to meet GDPR and sector-specific mandates. Cloud providers counter by promising region-locked HPC zones with residency guarantees, but such offerings carry premium pricing. The hybrid surge ultimately reframes the high performance computing market for networking gear, storage gateways and observability stacks tuned for multi-site topologies.
By Chip Type:
ASIC and AI Accelerators Challenge GPU Hegemony in Specialized WorkloadsGPUs dominated 59.22% of 2025 revenue, yet ASICs and dedicated AI accelerators are forecast to expand at 8.86% CAGR, eroding share as inference eclipses training in aggregate compute hours. Google’s TPU v5e illustrates the trend, delivering 2.5-times A100 throughput for transformer inference while consuming 40% less power. The high performance computing market share advantage of GPUs persists in double-precision tasks like climate modeling, but INT8 and FP8 inference, which constitute most production AI, now favors fixed-function silicon. CPUs remain essential for coordination, I/O and workloads unsuited to massive parallelism; AMD’s 96-core EPYC captures 35% of HPC CPU shipments on core density alone.
Chiplet architectures blur categorical boundaries. NVIDIA’s H200 integrates a transformer engine for FP8 math, while AMD’s MI300 co-locates CPU and GPU tiles using 2.5D packaging to cut memory latency by 40%. FPGAs stay relevant in ultra-low-latency segments such as electronic-options pricing, where microsecond deadlines justify USD 20,000 card prices. CUDA, ROCm, TensorRT, OneAPI and proprietary ASIC toolchains divide developer attention, increasing the fixed cost of adopting additional silicon flavors and complicating procurement decisions for smaller institutions.
By Industrial Application:
Life Sciences Surge Past Traditional Engineering WorkloadsGovernment and defense commanded 24.16% of 2025 revenue owing to nuclear-weapons simulation and intelligence analytics, yet its growth moderates as flagship exascale systems move from construction to utilization. Conversely, life sciences and healthcare exhibit a 9.54% CAGR and are on pace to overtake engineering by 2029, riding the adoption curve of generative-AI-enabled drug discovery. Moderna cut preclinical vaccine screening to 6 months on a 10,000-GPU cluster, tripling annual candidate throughput. The HPC market size for pharmaceutical discovery adds incremental spend on molecular-dynamics engines, quantum chemistry codes and graph neural networks that predict protein–ligand affinity.
Automotive engineering grows at 7.2% CAGR under EU-driven virtual-crash mandates and electrified-vehicle battery simulations that meld electrochemical and thermal solvers. Banking and financial services log 8.1% CAGR as algorithmic traders deploy petaflop-class clusters for overnight Value-at-Risk calculations and fraud-detection models. Energy supermajors stabilize or modestly contract physical datacenters as seismic workload burst to cloud, though high-resolution reservoir models still require on-premise GPUs during exploration drilling windows. The confluence of new biological modeling algorithms and regulatory simulation mandates widens the addressable high performance computing industry pool, reinforcing multi-vertical momentum.
Geography Analysis
North America High Performance Computing Market
North America accounted for 40.48% of 2025 revenue, anchored by USD 3.5 billion in U.S. federal exascale funding and hyperscale cloud operators that annually invest more than USD 200 billion in AI-optimized datacenters. The high performance computing market size in Canada rises as quantum-annealing vendor D-Wave ships 10,000-qubit systems for portfolio optimization, bridging classical–quantum workflows for financial institutions. Mexico’s entrance remains modest, serving nearshored automotive crash simulation through a 5-petaflop General Motors cluster installed in Toluca. Geographically, water-usage curbs in California and datacenter moratoriums in Virginia divert new builds to Oregon, Washington and Texas, subtly re-mapping intra-region latency profiles that historically favored Silicon Valley.
APAC High Performance Computing Market
Asia Pacific is projected to grow fastest at 7.98% CAGR, powered by indigenous exascale deployments and sovereign silicon programs. China’s Sunway Oceanlight and follow-on systems circumvent foreign export regimes and enable climate modeling and aerospace design without dependency on Western chips. India’s USD 1.2 billion National Supercomputing Mission 2.0 will install 25 petaflops across academic campuses by 2027, democratizing access for biotech and weather-forecast startups. Japan’s ARM-based Fugaku remains the energy-efficiency benchmark, influencing global CPU roadmaps, while South Korea aligns semiconductor-process simulation clusters with Samsung R&D to accelerate HBM packaging. Singapore’s 15-petaflop expansion positions its national supercomputing center as an ASEAN hub for pharmaceutical and finance workloads. Data residency and cyber-sovereignty laws force multinational enterprises to maintain in-country clusters, giving rise to a fragmented yet fast-growing regional supply chain.
Europe High Performance Computing Market
Europe captured 22% of 2025 global revenue. The EuroHPC Joint Undertaking funds exascale-class systems such as Finland’s 309-petaflop LUMI and Italy’s 304-petaflop Leonardo for materials science and climate research. Germany’s JUPITER exascale machine leverages NVIDIA H100 GPUs and eviden BullSequana cabinets to support Volkswagen crash simulations and BASF catalyst design. The EURO-NCAP 2030 mandate remains a structural demand driver for GPU clusters across Germany, France and Italy, while Nordic nations attract private cloud builds thanks to abundant hydroelectric power and free ambient cooling. GDPR-induced residency obligations sustain on-premise and hybrid growth, particularly in healthcare and finance where sensitive records cannot leave national borders.
MEA and South America High Performance Computing Market
South America, the Middle East and Africa remain nascent but opportunity-rich. Brazil’s Petrobras operates 10 petaflops for offshore reservoir models, and Saudi Arabia’s KAUST added 15 petaflops in 2024 for renewable-energy and desalination research. The United Arab Emirates commissioned an 8-petaflop cluster for Arabic large-language-model training and smart-city twins. Israel’s Technion expanded to 5 petaflops for cybersecurity analytics, whereas South Africa’s CHPC maintains 4 petaflops for mining and epidemiology. Infrastructure gaps such as intermittent power in Nigeria and severe water scarcity in Gulf states elevate deployment cost, encouraging containerized or modular designs optimized for energy efficiency.


Regulatory Landscape
Regulatory requirements for high performance computing are tightening around security, sovereignty, and export controls, influencing how HPC systems are procured, deployed, and operated across borders. In May 2026, NIST finalized SP 800-234 (High-Performance Computing Security Overlay), tailoring controls from the NIST SP 800-53B moderate baseline to HPC operational realities (including the zone model defined in SP 800-223). This update pushes federal-facing and regulated-industry HPC operators toward more formalized, auditable cluster security architectures.
Trade and technology controls also shape accelerator availability and cross-border HPCaaS delivery. In January 2026, the U.S. Bureau of Industry and Security implemented a case-by-case license review policy for exports of certain advanced computing commodities, and in May 2025 BIS clarified that using advanced computing integrated circuits and commodities for training AI models can trigger export authorization requirements tied to restricted end uses and destinations. In Europe, EuroHPC governance continues to guide public-sector HPC investments, while Regulation (EU) 2026/150 amended the EuroHPC Joint Undertaking to expand its mandate (including an AI gigafactory pillar and quantum technologies). The changes reinforce procurement pathways that emphasize trusted infrastructure and regional capability development.
Value Chain Analysis
The HPC value chain covers semiconductor IP and design, leading-edge wafer fabrication and advanced packaging, memory and interconnect supply, server and system integration, and software stacks (compilers, libraries, schedulers, and orchestration), followed by deployment and operations via on-premise facilities and cloud/HPCaaS providers. Concentration at key upstream nodes elevates supply risk. ASML is the sole supplier of EUV lithography tools, TSMC is a critical hub for advanced-node fabrication and CoWoS-class packaging, and HBM supply is controlled by a small set of vendors (SK hynix, Micron, and Samsung), which ties back to ongoing HBM3e constraints affecting GPU server build schedules.
Downstream, value capture is shifting toward vertically integrated stacks and infrastructure partners that can secure compute, power, and cooling at scale. Multiyear partnerships such as NVIDIA and Meta (announced February 2026) reflect co-planning across silicon generations and infrastructure deployment, while AMD and Rackspace Technology (June 2026, definitive agreement) show how capacity reservation at the data center layer (30 MW of AMD-based compute across global sites) is becoming part of supply chain strategy. Government and research collaborations also shape roadmaps and software readiness, as indicated by the January 2026 Memorandum of Understanding involving RIKEN, Argonne National Laboratory, Fujitsu, and NVIDIA, which supports co-design across hardware, system software, and AI-for-science workloads.
Competitive Landscape
The high performance computing market is moderately concentrated. In hardware, NVIDIA, Intel, AMD, Hewlett Packard Enterprise and Dell Technologies captured about 60% of 2025 revenue; meanwhile, software, cloud services and integration remain fragmented among more than 50 specialized vendors. NVIDIA’s ownership of Mellanox lets it bundle GPUs and InfiniBand switches as a turnkey exascale stack, locking in design wins for El Capitan in the United States and JUPITER in Germany. Hyperscalers counter by vertically integrating: Amazon’s Graviton4 CPU, Google’s TPU v5 and Microsoft’s Maia accelerator sidestep merchant-GPU shortages and reduce marginal cost per inference. Server original-equipment manufacturers navigate shrinking hardware margins by bundling liquid cooling and management services, as Dell’s PowerEdge XE9712 illustrates with rack-unit densities pushing 12 kilowatts.
Start-ups carve out high-value niches. Cerebras’ wafer-scale engine eliminates inter-chip bottlenecks and trains 20-billion-parameter models 10 times faster than eight-GPU nodes in pharma benchmarks. SambaNova exploits reconfigurable dataflow to outperform GPUs on sparse neural networks common in fraud-detection and recommendation workloads. Chiplet approaches gain traction; AMD’s MI300 integrates GPU and CPU dies via 3D stacking, cutting inter-tile latency by 40% and winning Meta and Microsoft deployments in 2025. NVIDIA filed 127 optical-interconnect patents in 2024, suggesting a roadmap toward silicon photonics that could deliver 10 terabit-per-second links, potentially obsoleting copper-based InfiniBand after 2028.
Liquid-cooling retrofits turn into a USD 500 million-plus opportunity by 2026 as states mandate lower water consumption. Vendors such as Asetek and CoolIT now sell direct-to-chip solutions that reduce evaporative losses by 80%, opening expansion paths in drought-affected western United States. These shifts recalibrate value capture along the hardware–services continuum, while cloud-native workflow orchestration reshapes entrant barriers in the broader high performance computing industry.
High Performance Computing Industry Leaders
Advanced Micro Devices, Inc.
NEC Corporation
Hewlett Packard Enterprise
Qualcomm Incorporated
Fujistu Limited
- *Disclaimer: Major Players sorted in no particular order
High Performance Computing Market Companies Covered in this Report
- Advanced Micro Devices
- NEC Corporation
- Fujitsu Limited
- Qualcomm Incorporated
- Hewlett Packard Enterprise
- Dell Technologies
- Lenovo Group
- IBM Corporation
- Eviden (Atos SE)
- NVIDIA Corporation
- Intel Corporation
- Penguin Computing (SMART Global)
- Inspur Group
- Huawei Technologies
- Amazon Web Services
- Microsoft Azure
- Google Cloud Platform
- Oracle Cloud Infrastructure
- Alibaba Cloud

Market Opportunities and Future Outlook
A key whitespace area is power-secured HPC-AI infrastructure that can support large-scale training and sustained inference while meeting sovereignty and security requirements. Public programs provide a clearer demand signal: the U.S. Department of Energy FY 2026 budget request includes USD 1,016 million for Advanced Scientific Computing Research, emphasizing AI integration and integrated research infrastructure, and the UK Compute Roadmap sets a national target of 420 AI exaFLOP by 2030 with GBP 1 billion allocated. In Europe, EuroHPC and PRACE activity, including PRACE publications covering 2026-2034 priorities, links capacity planning to industrial competitiveness and scientific discovery. This continues to reinforce demand for modern accelerators, high-bandwidth storage, and low-latency fabrics.
A second opportunity area is the new-build and expansion of hyperscale-class data center campuses that can handle higher rack densities, along with liquid-cooling, power distribution, and interconnect upgrades needed for HPC/AI convergence. In July 2026, Meta announced an expansion of its Hyperion data center campus in Richland Parish, Louisiana, to 5 GW with a USD 50 billion investment commitment, illustrating the scale of infrastructure being mobilized for accelerated computing. Other July 2026 announcements, including Crusoe and Lancium planning a 1 GW AI data center campus in Childress, Texas, and Pure Data Centres launching an AI campus project in Seinaejoki, Finland (Phase 1 at 110 MW, targeting 550 MW site-wide), also point to intensifying competition across regions to secure power, cooling, and permitting pathways for HPC-grade clusters and HPCaaS offerings.
Recent Industry Developments in High Performance Computing Market
- June 2026: Hewlett Packard Enterprise expanded its HPC software and systems capabilities for enterprise deployments by introducing new HPC programming software for ProLiant Compute servers and adding multi-tenant capabilities for networking and storage. The company move strengthens managed and shared-environment operations for organizations running mixed HPC and AI workloads, aligning platform features with sovereign and regulated buyers that need stronger isolation and governance.
- May 2026: AMD announced a production ramp for its next-generation EPYC processor codenamed Venice on TSMC 2nm process technology. Advancing CPU roadmap cadence at leading nodes supports higher core density and memory bandwidth per socket, which is critical for balanced HPC clusters where CPUs orchestrate accelerated workloads and feed high-throughput I/O.
- November 2024: Hewlett Packard Enterprise delivered the El Capitan exascale system to Lawrence Livermore National Laboratory, reaching 1.742 exaflops and using direct liquid cooling. This deployment reinforced liquid cooling as a baseline requirement for frontier-scale systems and provided a reference architecture that influences subsequent procurement decisions across government labs and large enterprise HPC facilities.


High Performance Computing Market Report Scope and Research Methodology
Market Definition and Coverage
For this methodology, the high performance computing market is defined as the yearly revenue earned from purpose-built compute, storage, and interconnect systems, together with HPC software and related services, that are used to run high intensity workloads at scale.
Scope exclusions: Consumer gaming GPUs sold through retail channels and generic cloud infrastructure that is not configured or marketed for HPC workloads are excluded from this sizing.
Segments Covered in This Report
- By Component
- Hardware
- Servers
- General-Purpose CPU Servers
- GPU-Accelerated Servers
- ARM-Based Servers
- Storage Systems
- HDD Arrays
- Flash-Based Arrays
- Object Storage
- Interconnect and Networking
- InfiniBand
- Ethernet (25/40/100/400 GbE)
- Custom or Optical Interconnects
- Servers
- Software
- System Software (OS, Cluster Management)
- Middleware and RAS Tools
- Parallel File Systems
- Services
- Professional Services
- Managed and HPC-as-a-Service (HPCaaS)
- Hardware
- By Deployment Mode
- On-premise
- Cloud
- Hybrid
- By Chip Type (Cross-Cut with Component)
- CPU
- GPU
- FPGA
- ASIC or AI Accelerators
- By Industrial Application
- Government and Defense
- Academic and Research Institutions
- BFSI
- Manufacturing and Automotive Engineering
- Life Sciences and Healthcare
- Energy, Oil and Gas
- Other Industry Applications
- By Geography
- North America
- United States
- Canada
- Mexico
- Europe
- Germany
- United Kingdom
- France
- Italy
- Nordics (Sweden, Norway, Finland)
- Rest of Europe
- Asia Pacific
- China
- Japan
- India
- South Korea
- Singapore
- Rest of Asia Pacific
- South America
- Brazil
- Argentina
- Rest of South America
- Middle East
- Israel
- United Arab Emirates
- Saudi Arabia
- Turkey
- Rest of Middle East
- Africa
- South Africa
- Nigeria
- Rest of Africa
- North America
Data Sources, Market Sizing, and Validation
Desk Research
Desk research was used to map the demand signals, supply capacity, and pricing context that sit behind HPC spending, and then to keep the assumptions realistic. We referred to public sources such as OECD and World Bank indicators, US Bureau of Economic Analysis series, US International Trade Commission data, and the US Patent and Trademark Office, along with peer-reviewed computing and data center energy journals.
In addition, we used company filings, earnings call transcripts, investor decks, and HPC consortium and lab procurement announcements to understand where budgets are shifting and which deployments are being prioritized. Where required, we also used paid subscriptions for company financials and intelligence, news and financials, patents, and global contracts and tenders so revenue splits and adoption claims could be cross-checked consistently. The sources named above are illustrative and not exhaustive, and many other public documents were reviewed for data collection, clarification, and validation.
Primary Interviews and Surveys
Primary work was used to test scope boundaries and confirm the share of spend that is truly HPC, instead of general compute or standard IT refresh. We spoke with a mix of hardware, software, and services participants, and also with enterprise and research users that buy clusters, accelerators, and HPC cloud capacity. This feedback helped tighten inputs such as adoption timing, average contract size, and refresh cycles. Since this is a global market, we kept the feedback balanced across major regions so the final assumptions aligned with local procurement patterns and deployment constraints.
Distribution of primary research fieldwork respondents
| Company type | Respondent position | Region |
|---|---|---|
| Top tier: 39% | CXOs: 15% | APAC: 47% |
| Mid tier: 44% | Functional/Unit leaders: 33% | EMEA: 29% |
| Smaller Players: 17% | Managers: 52% | Americas: 24% |
Market-Sizing & Forecasting
Sizing starts with a top-down build where IT infrastructure and data center investment pools are reconstructed by region, then filtered using HPC-specific penetration rates for compute clusters, high-speed interconnects, parallel storage, enabling software, and attached services. To keep the totals grounded, we then check the outputs with selective bottom-up approximations, such as sampled system pricing multiplied by expected unit additions, public contract values where available, and supplier revenue splits discussed in filings and interviews.
Key model inputs include accelerator attach rates in new HPC nodes, average cluster refresh cycles, the mix shift between on-premises systems and HPC in the cloud, procurement lead times for large installations, and power and cooling constraints that can delay deployments. In practice, when these inputs are aligned across regions and end users, the resulting curve is more stable, and this is where the final market totals are anchored.
For forecasting, we use scenario analysis, followed by a light multivariate regression check that links demand to drivers such as AI and simulation workload growth, public sector and research funding direction, and hyperscale data center build activity. Where bottom-up pieces are incomplete, for example smaller service providers or indirect channel revenues, we apply gap-fills using validated ratios from interviews, and then re-test the result against the top-down demand pool.
Data Validation & Update Cycle
Validation is done through multiple passes so the final numbers are not driven by one data point or one assumption. We compare model outputs with independent signals such as large system award totals, shipment and installation announcements, and the direction of reported product revenue, and then investigate variances that fall outside expected ranges.
If a major gap shows up, the relevant assumption is revisited, and the appropriate experts are re-contacted to confirm whether the change is real or timing related. Before sign-off, the model and narrative are reviewed by another analyst to catch unit errors, double counting, and scope leakage. Reports are refreshed annually, and interim updates are made when material events occur, followed by a final pre-delivery check so clients receive the latest view.
Mordor Intelligence's High Performance Computing Market Sizing Compared With Other Published Estimates
Published HPC market sizes can look far apart even when they use similar words, because scope lines get drawn differently and the same spend can be counted twice across adjacent compute categories. Differences also show up when one study uses a different base year, assumes faster cloud substitution, or applies a different treatment for hardware price erosion versus services growth.
The table shows a spread around mid-2020s values. Under Mordor Intelligence's scope, the total counts purpose-built servers, storage subsystems, high-speed interconnects, enabling software, and related professional or managed services, while excluding consumer gaming GPUs and general cloud infrastructure that is not configured for HPC workloads. Gaps also come from whether AI infrastructure is treated as HPC by default, how accelerator revenue is allocated when it is bundled into broader systems, and whether currency conversion is taken at average annual rates or at a point-in-time rate.
Benchmark comparison
| Source | Market Size | Gaps in Research Methodology |
|---|---|---|
| Mordor Intelligence | USD 55.78 B (2025) | |
| Global Consultancy A | USD 52.36 B (2024) | Uses an earlier base year and a wider solution framing, which can blend general compute infrastructure with HPC and shift what is counted as core demand year to year. |
| Industry Research Publisher B | USD 58.85 B (2024) | Covers a broader component and end-use set (including cloud and gaming-adjacent demand in some cases), which can pull in revenue streams that are not tied to HPC-grade configurations. |
Taken together, the benchmark lines mainly differ because of what is treated as true HPC spend versus adjacent compute categories, and because base years do not match. By keeping the revenue mapping tied to clear product and service buckets and then re-checking totals against procurement signals, we end up with a market value that is easier to trace and update consistently.


Key Questions Answered in the Report
What is the projected value of the high performance computing market in 2031?
The market is forecast to reach USD 87.50 billion by 2031.
Which segment is expected to grow fastest within the high performance computing market?
Services, driven by managed HPC and HPC-as-a-Service offerings, are projected to grow at a 9.42% CAGR through 2031.
Why are hybrid deployments gaining ground?
Hybrid architectures balance data-sovereignty and security needs with the elasticity of cloud resources, delivering an 8.22% CAGR growth advantage.
How will HBM3e supply constraints affect future system purchases?
Limited HBM3e yields prolong GPU server lead times into 2027, raising acquisition costs and encouraging buyers to consider ASIC and CPU alternatives.
Which region is expanding fastest in high performance computing adoption?
Asia Pacific is forecast to record a 7.98% CAGR between 2026 and 2031, fueled by indigenous exascale projects and pharmaceutical outsourcing demand.
What cooling technology trend addresses water-usage regulations in the United States?
Direct-to-chip liquid-cooling retrofits reduce evaporative consumption by up to 80%, facilitating datacenter expansion in drought-prone states.
Page last updated on:


