Exascale Computing Market Size and Share
Market Overview
| Study Period | 2019 - 2030 |
|---|---|
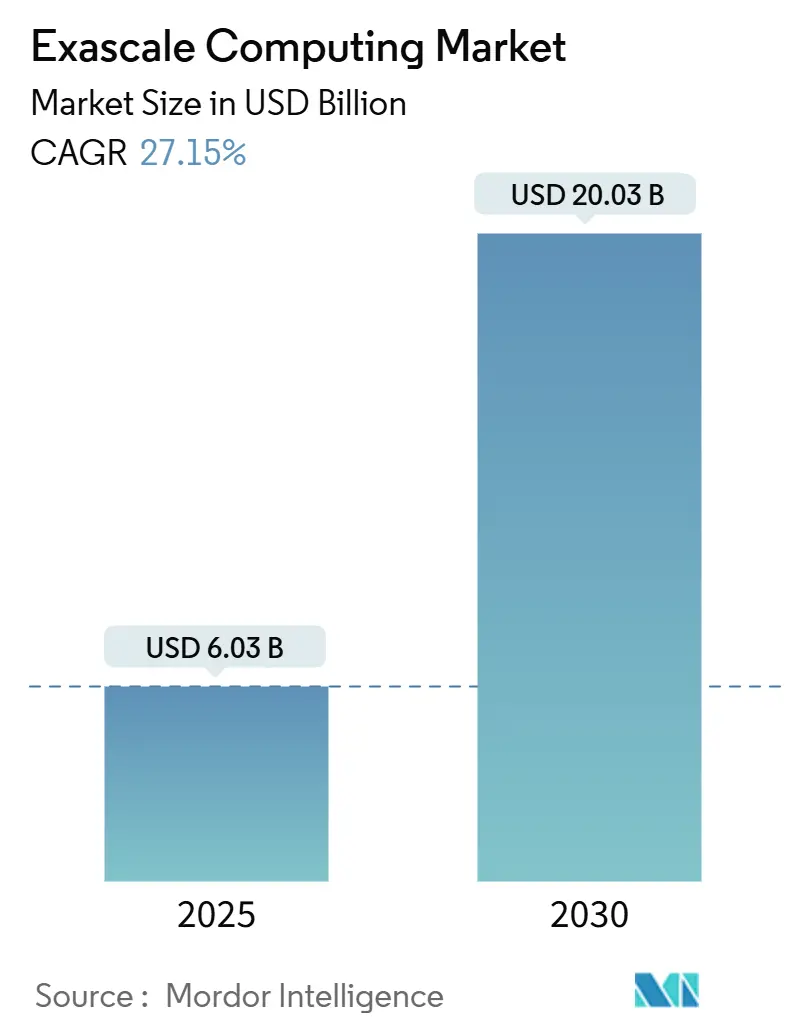
| Market Size (2025) | USD 6.03 Billion |
| Market Size (2030) | USD 20.03 Billion |
| Growth Rate (2025 - 2030) | 27.15% CAGR |
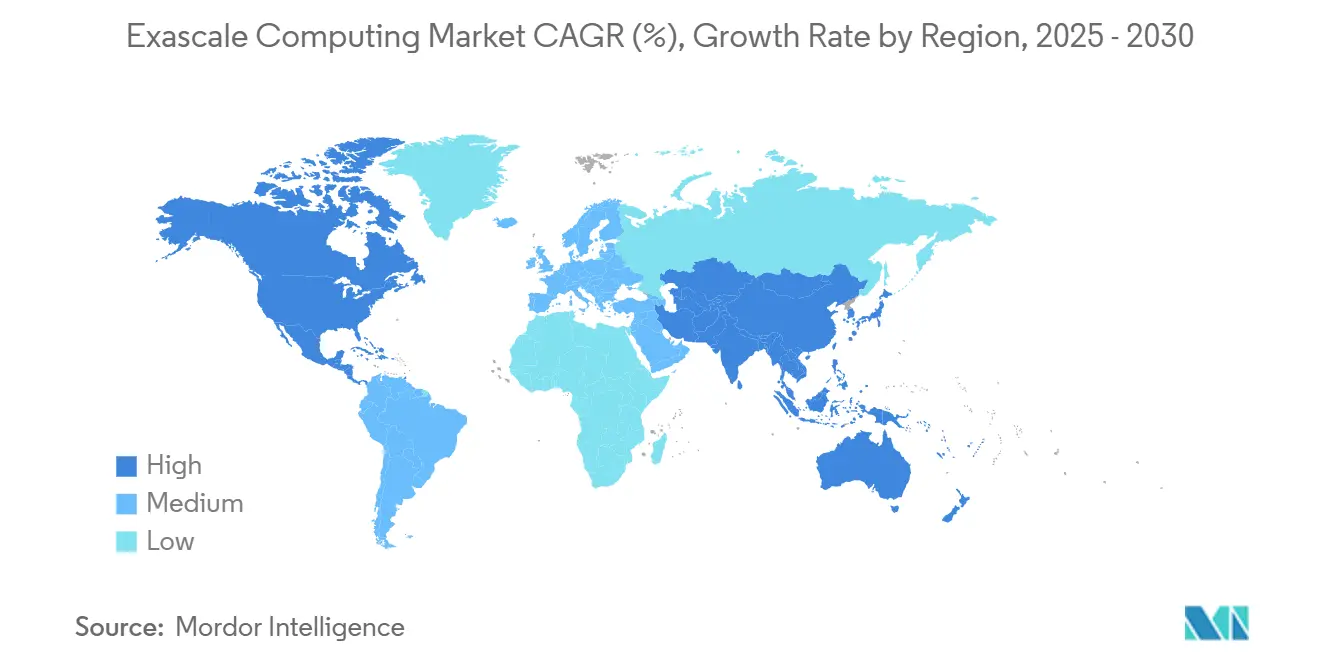
| Fastest Growing Market | Asia Pacific |
| Largest Market | North America |
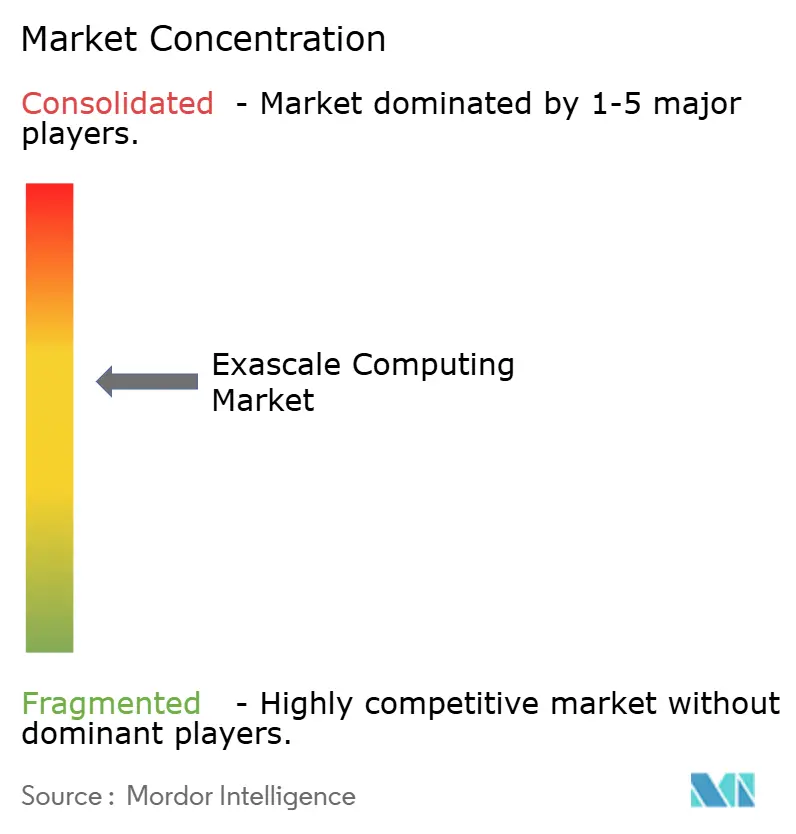
| Market Concentration | Medium |
Major Players
*Disclaimer: Major Players sorted in no particular order Image © Mordor Intelligence. Reuse requires attribution under CC BY 4.0. |
|
Exascale Computing Market Analysis by Mordor Intelligence
The exascale computing market size is valued at USD 6.03 billion in 2025 and is forecast to reach USD 20.03 billion by 2030, advancing at a 27.15% CAGR. Solid public spending, surging investments in AI-centric hardware, and intensifying geopolitical competition jointly accelerate procurement cycles and keep the funding pipeline resilient to macroeconomic swings. Governments in the United States, China, the European Union, and Japan collectively allocate more than USD 12 billion to build next-generation systems, a scale of capital that sustains multi-year demand for components even when private budgets tighten. Commercial cloud providers now bundle fractional exascale performance into on-demand instances, broadening access for mid-size enterprises that previously lacked budget or expertise. At the same time, heterogeneous architectures with specialized accelerators enable new classes of workloads, particularly large language model training, digital twin simulations, and high-resolution climate forecasting, which were previously impractical on petascale infrastructure. Supply-chain constraints at 5 nanometers or below remain a near-term hurdle, yet parallel progress in chiplet packaging and open-source interconnects is expected to diversify sourcing and alleviate risk over the next four years.
Key Report Takeaways
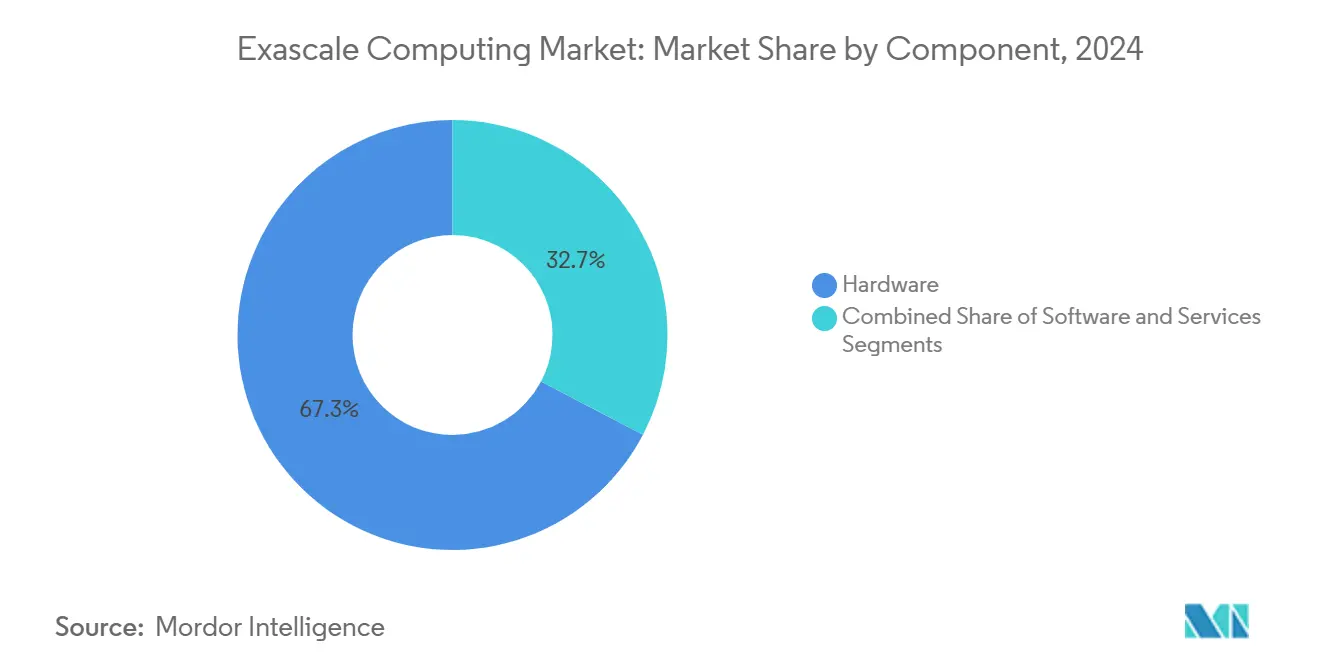
- By component, hardware led with 67.32% revenue share in 2024, while services are projected to expand at a 27.69% CAGR through 2030.
- By architecture, heterogeneous systems captured 69.87% of the exascale computing market share in 2024 and are poised to grow at a 27.76% CAGR to 2030.
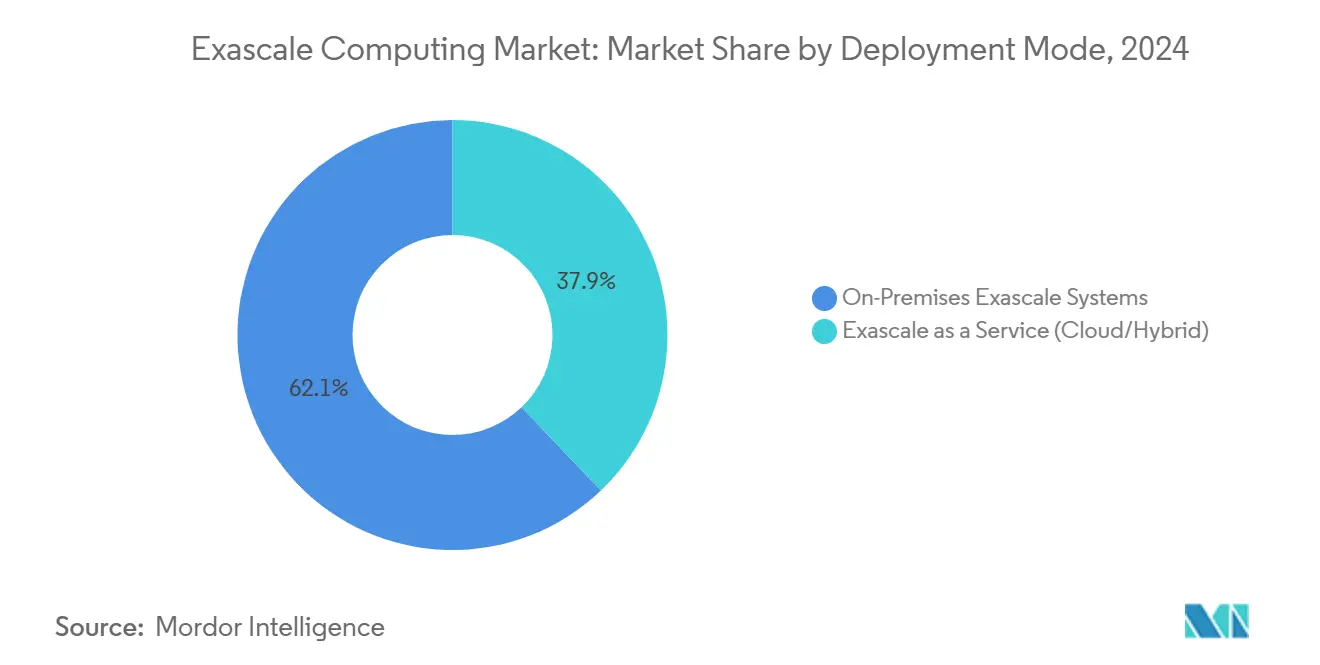
- By deployment mode, on-premises installations held a 62.13% share of the exascale computing market size in 2024, whereas exascale-as-a-service is projected to record the highest CAGR at 27.54% through 2030.
- By end-use, government and national laboratories accounted for 45.89% of spending in 2024; the life sciences and pharmaceuticals sector is forecasted to rise at a 28.87% CAGR to 2030.
- By geography, North America accounted for 38.74% of the revenue share in 2024, while the Asia Pacific is expected to advance at a 28.24% CAGR during the same period.
Note: Market size and forecast figures in this report are generated using Mordor Intelligence’s proprietary estimation framework, updated with the latest available data and insights as of January 2026.
Global Exascale Computing Market Trends and Insights
Drivers Impact Analysis*
| Driver | (~) % Impact on CAGR Forecast | Geographic Relevance | Impact Timeline |
|---|---|---|---|
| Accelerating Government-Funded Exascale Initiatives | +4.2% | Global, concentrated in North America, China, EU | Medium term (2-4 years) |
| Surging AI and ML Workloads Driving Extreme Performance Demand | +5.8% | Global, early adoption in North America and Asia Pacific | Short term (≤ 2 years) |
| Expanding Use of Digital Twins in Industrial Design | +3.1% | North America and EU core, spill-over to Asia Pacific | Medium term (2-4 years) |
| Rising Climate Modeling and Weather Prediction Complexity | +2.9% | Global, emphasis on climate-vulnerable regions | Long term (≥ 4 years) |
| Commercial Cloud Providers Entering Exascale Segment | +4.7% | North America and EU, expanding to Asia Pacific | Short term (≤ 2 years) |
| Emerging Open-Source Chiplet Ecosystems Reducing Costs | +3.4% | Global, manufacturing concentration in Asia Pacific | Long term (≥ 4 years) |
| Source: Mordor Intelligence | |||
Accelerating Government-Funded Exascale Initiatives
Federal and supranational agencies are underwriting the exascale computing market with multi-billion-dollar programs that convert research agendas into immediate hardware orders. The U.S. Department of Energy alone earmarks USD 1.8 billion for systems such as Frontier, Aurora, and El Capitan, each delivering more than 1 exaflop of sustained performance.[1]U.S. Department of Energy, “DOE Exascale Computing Project,” ENERGY.GOV Europe is following suit through the EuroHPC Joint Undertaking, which has set aside EUR 8 billion (USD 9.04 billion) for shared pan-European supercomputers operating in Finland and Italy. Similar funding streams in China and Japan ensure at least a half-decade of predictable demand, thereby reducing commercial risk for integrators and component suppliers. Procurement rules that favor domestic manufacturing channel a significant portion of spend to regional vendors, strengthening local supply chains. Finally, cross-border research collaborations forged under these programs help amortize software development costs and accelerate the dissemination of best practices.
Surging AI and ML Workloads Driving Extreme Performance Demand
Large language models, video understanding systems, and generative science applications now require billions of parameters and trillions of floating-point operations during training, eclipsing petascale thresholds. NVIDIA demonstrated that scaling a transformer model to one trillion parameters requires roughly 10^25 floating-point operations, which is attainable only on tightly coupled exascale clusters. As enterprises pursue AI-augmented climate models and molecular simulations, they value the same low-latency networks and high-bandwidth memory that national labs deploy, which in turn fuels private-sector procurements. Hybrid workloads that blend AI inference with time-stepped physics also encourage heterogeneous node designs featuring GPUs, tensor cores, and vector processors. This virtuous cycle enables broader innovation because freshly trained AI models are immediately available for downstream commercial applications, which then validate further system expansion.
Expanding Use of Digital Twins in Industrial Design
Manufacturers now mirror entire production lines in software to test parameter changes without halting physical assets. Automotive firms run aero-thermal models of complete vehicles under variable wind tunnel conditions, while aerospace primes iterate wing structures at scale. Digital twins of chemical plants map catalytic reactions in real-time and adjust process controls to maximize yield. Heterogeneous exascale nodes slash simulation runtimes from weeks to hours, accelerating design sprints and fostering data-driven engineering cultures. As more operational sensors feed twins, compute workloads become persistently high, sustaining subscriptions for on-demand exascale resources. This trend is especially pronounced in North America and Western Europe, where Industry 4.0 initiatives already enjoy broad executive sponsorship.
Rising Climate Modeling and Weather Prediction Complexity
Societal demand for kilometer-scale climate projections motivates meteorological agencies to ingest larger observational datasets. The Community Earth System Model v3 now operates at exascale capacity, delivering finer resolution without compromising runtime windows.[2]National Center for Atmospheric Research, “CESM3 Now Available,” NCAR.EDU Similar upgrades at European and Asian weather centers enhance cyclone tracking and rainfall forecasting accuracy, resulting in tangible economic benefits for agriculture, logistics, and disaster response. Coupling traditional numerical solvers with AI-driven downscaling further intensifies compute requirements, locking in long-term system refresh cycles. Because climate science carries a global public-good status, budget allocations persist despite economic cycles, providing another structural growth lever for the exascale computing market.
Restraints Impact Analysis*
| Restraint | (~) % Impact on CAGR Forecast | Geographic Relevance | Impact Timeline |
|---|---|---|---|
| Escalating System Power Consumption and Cooling Costs | -3.8% | Global, acute in high-energy-cost regions | Short term (≤ 2 years) |
| Software Parallelization Bottlenecks in Legacy Codes | -2.9% | Global, affecting established research institutions | Medium term (2-4 years) |
| Supply-Chain Volatility for Advanced Nodes <5 nm | -4.1% | Global, manufacturing concentration in Asia Pacific | Short term (≤ 2 years) |
| Shortage of Specialized Exascale Talent Pool | -2.7% | Global, acute in emerging markets | Long term (≥ 4 years) |
| Source: Mordor Intelligence | |||
Escalating System Power Consumption and Cooling Costs
Modern exascale machines draw 20-30 MW of continuous power, approximately triple that of their petascale predecessors, and incur annual electricity bills of nearly USD 15 million for facilities such as Frontier. Liquid immersion and rear-door heat-exchange units increase capital outlays by up to 40% compared to legacy air-cooled racks. Operators located in high-tariff regions face cost disadvantages, often prompting data center site selection near renewable energy sources or subsidized energy grids. Carbon-neutral mandates introduce additional layers of complexity, compelling stakeholders to invest in power-usage-effectiveness improvements and renewable energy procurement certificates, which can erode ROI projections.
Software Parallelization Bottlenecks in Legacy Codes
Many high-value scientific codes remain optimized for tens of thousands, not millions, of parallel threads. Argonne National Laboratory found that only 30% of benchmarked applications scaled efficiently to 80% node utilization on pre-exascale testbeds.[3]Argonne National Laboratory, “Preparing Scientific Applications for Exascale Computing,” ANL.GOV Re-architecting these codes entails algorithmic redesign, hybrid MPI-OpenMP adoption, and exhaustive verification, often consuming several person-years per application. Until these bottlenecks are resolved, some users underutilize expensive hardware, which dampens the perceived benefit and affects upgrade timelines. Consequently, service providers offering code modernization expertise gain strategic relevance within the broader exascale computing industry.
*Our forecasts treat driver/restraint impacts as directional, not additive. The impact forecasts reflect baseline growth, mix effects, and variable interactions.
Segment Analysis
By Component: Hardware Dominance Faces Services Disruption
The hardware segment generated USD 4.06 billion, equal to 67.32% of 2024 spending, confirming the capital-intensive nature of building processors, accelerators, and memory stacks that meet exaflop performance thresholds. Within that total, GPUs and tensor processing units posted the fastest revenue growth as AI workloads overtook legacy MPI-bound simulations. In absolute terms, advanced networking and high-bandwidth memory now account for a growing portion of the bill of materials as communication overheads eclipse compute cycles. The exascale computing market size for services is comparatively smaller today, but it is expanding at a 27.69% CAGR, reflecting clients' willingness to outsource integration, tuning, and continuous maintenance.
Looking ahead, many pharmaceutical and financial firms intend to procure compute cycles through managed offerings rather than proprietary clusters, suggesting a progressive tilt toward recurring revenue models. Service providers that master code-porting pipelines can capture higher margins, because optimizing software stacks remains the single greatest hurdle to extracting value from heterogeneous nodes. Hardware vendors respond by bundling firmware, drivers, and optimization toolchains to retain customer stickiness, thereby reinforcing an integrated value proposition.


By Architecture: Heterogeneous Systems Enable Specialized Performance
Heterogeneous platforms captured 69.87% of 2024 expenditure and are projected to outpace homogeneous clusters by an additional 270 basis points annually through 2030. Such systems integrate CPUs, GPUs, and occasionally FPGAs into node-level packages, each tailored to specific workloads, such as sparse matrix multiplications or stencil computations. The exascale computing market share advantage stems from superior performance-per-watt metrics, a critical selling point when power budgets are capped at 30 MW.
However, heterogeneity complicates programming paradigms. Developers must juggle CUDA, SYCL, and low-level intrinsics while maintaining portable codebases. Successful stack abstractions, such as unified memory and task-based schedulers, therefore play an outsized role in user adoption. Vendors promoting open-standard interfaces may enjoy an ecosystem multiplier effect that boosts accelerator attach rates. Conversely, homogeneous CPU-centric systems persist in tightly regulated environments that prioritize deterministic behavior and minimize attack surfaces, indicating a long, though narrowing, runway for traditional node architectures.
By Deployment Mode: Cloud Services Challenge Traditional Models
On-premises installations still account for more than USD 3.75 billion in annual spend, reflecting institutions that cannot risk latency or data sovereignty exposure. This cohort includes weapons design labs, seismic imaging centers, and certain financial clearinghouses. Exascale-as-a-Service, which accounts for only one-third of 2024 revenue, registers the fastest trajectory, as Amazon Web Services, Microsoft Azure, and Google Cloud unveil fractional exascale instances. Their pay-as-you-go pricing eliminates eight-figure capital hurdles and delivers elasticity vital for episodic workloads such as quarterly stress tests.
The hybrid model, where local clusters handle baseline workloads and cloud bursts cover peak demand, already resonates with life-science firms that need high-throughput molecular docking during early pipeline stages. Network-attached secure enclaves and zero-trust architectures help mitigate lingering data security concerns. Providers that combine transparent cost dashboards with automated job schedulers are likely to accelerate user migration, making deployment choice as much about operational simplicity as raw performance.
By End-Use Industry: Government Leadership Faces Commercial Challenge
Government and national laboratories historically dominated consumption, yet their 45.89% share is expected to dip gradually as commercial verticals mature. Defense programs continue to drive absolute hardware volumes, especially in encryption analytics and nuclear stockpile stewardship. At the same time, the life sciences segment is projected to add roughly USD 2 billion in new demand by 2030, led by AI-enabled drug discovery that slashes simulation-to-clinical timelines. The exascale computing market size for energy companies also expands as they integrate high-fidelity reservoir models into exploration workflows.
Academic consortia utilize shared funding mechanisms to establish regional supercomputers, thereby democratizing access for smaller institutions. Meanwhile, manufacturers embed exascale digital twins within smart-factory rollouts to reduce downtime and optimize design iterations. Such diversification mitigates overreliance on public budgets and stabilizes vendor revenue streams, even as sovereign funding cycles vary across political administrations.
Geography Analysis
North America remains the epicenter of the exascale computing market, contributing USD 2.34 billion in 2024 expenditure, anchored by Frontier, Aurora, and soon El Capitan systems. The region’s strong semiconductor ecosystem, featuring companies such as NVIDIA, AMD, and Intel, ensures a tight coupling between R&D roadmaps and end-user requirements. Federal incentives under the CHIPS and Science Act further lower fabrication barriers for domestic nodes, reinforcing supply security. Canada complements the regional footprint with AI-focused clusters that support its burgeoning biotech industry, while Mexico pilots modest capacity for seismic risk analysis.
The Asia Pacific achieved the highest regional CAGR of 28.24%, largely driven by China’s indigenous processor programs and Japan’s post-Fugaku roadmap, which targets converged AI-scientific workloads. Emerging initiatives in India, South Korea, and Australia add breadth, addressing climate modeling, genomic research, and mineral exploration, respectively. Cloud operators accelerate the uptake by situating exascale pods near major metropolitan areas, thereby reducing network hops for data-intensive users.
Europe is expected to follow with steady mid-teens growth under the EuroHPC Joint Undertaking. The LUMI and Leonardo installations already operate at petascale-plus levels and are expected to transition to full exaflop capability by 2026. Although energy prices run higher than in North America, aggressive renewable build-outs in Scandinavia and southern Europe offset operational costs. The Middle East and Africa, along with South America, remain nascent markets; however, sovereign funds in the United Arab Emirates and Brazil’s agricultural research agencies have shown early signs of pilot deployments.

Competitive Landscape
The exascale computing market exhibits moderate concentration, with Hewlett Packard Enterprise, IBM, and Lenovo commanding the majority of multi-rack integrations. Their decades-long relationships with national laboratories have afforded them early design wins and service contracts that exceed USD 100 million each. NVIDIA, AMD, and Intel wield comparable influence due to their proprietary accelerators and software ecosystems, which significantly impact overall platform performance. NVIDIA’s acquisition of Mellanox embedded high-bandwidth networking directly into its roadmap, while AMD’s EPYC and Instinct lines challenge Intel’s historic share.
New entrants are leveraging chiplet architectures and open-source instruction sets to carve out niches. SiPearl, now part of Intel, illustrates how acquisitions can secure regional footholds in Europe. Cerebras Systems and SambaNova Systems focus on wafer-scale or reconfigurable AI accelerators that could offload specialized kernels from general-purpose GPUs. Cloud providers vertically integrate by designing custom silicon, AWS’s Trainium and Microsoft’s Maia, to secure supply and reduce TCO.
Strategic moves spotlight vertical integration and sustainability. HPE’s liquid-cooled Discovery supercomputer strikes a balance between density and power budgets. Lenovo’s North Carolina manufacturing plant reduces lead times and taps domestic content rules in United States tenders. Meanwhile, Dell’s ISO 14001 certification appeals to customers tracking Scope 2 emissions. Collectively, these actions raise standards and set new barriers for followers.
Exascale Computing Industry Leaders
-
Hewlett Packard Enterprise Company
-
International Business Machines Corporation
-
Lenovo Group Limited
-
Dell Technologies Inc.
-
Atos SE
- *Disclaimer: Major Players sorted in no particular order

Recent Industry Developments
- October 2025: Hewlett Packard Enterprise announced a USD 2.1 billion contract with the U.S. Department of Energy to deliver the next-generation exascale system "Discovery" at Lawrence Livermore National Laboratory featuring advanced liquid cooling technology and AI-optimized accelerators.
- September 2025: NVIDIA Corporation launched the H200 NVL platform designed for exascale AI workloads, delivering 1.8x performance improvement over the H100 through enhanced memory bandwidth and optimized tensor processing.
- August 2025: Intel Corporation completed its USD 850 million acquisition of SiPearl, strengthening its position in European exascale markets and adding ARM-based processor technologies optimized for high-performance computing.
- June 2025: Amazon Web Services introduced Exascale Compute Cloud (EC3) instances that provide fractional access to exascale performance through its global infrastructure, bringing extreme-scale computing capabilities to organizations without dedicated supercomputing facilities.


Global Exascale Computing Market Report Scope
The Exascale Computing Market Report is Segmented by Component (Hardware, Software, Services), Architecture (Heterogeneous, and Homogeneous), Deployment Mode (On-Premises Exascale Systems, and Exascale as a Service), End-Use Industry (Government and National Labs, Academia and Research Institutes, Defense and Intelligence, Life Sciences and Pharmaceuticals, Energy, Manufacturing and Automotive, Financial Services, Weather and Climate Modeling Centers), and Geography (North America, Europe, Asia-Pacific, Middle East and Africa, South America). The Market Forecasts are Provided in Terms of Value (USD).
| Hardware | Processors |
| Accelerators (GPU, FPGA, ASIC) | |
| Memory and Storage | |
| High-Speed Interconnect | |
| Software | |
| Services |
| Heterogeneous (CPU+Accelerator) |
| Homogeneous (CPU-Only) |
| On-Premises Exascale Systems |
| Exascale as a Service (Cloud/Hybrid) |
| Government and National Labs |
| Academia and Research Institutes |
| Defense and Intelligence |
| Life Sciences and Pharmaceuticals |
| Energy (Oil, Gas, Nuclear, Renewables) |
| Manufacturing and Automotive |
| Financial Services |
| Weather and Climate Modeling Centers |
| North America | United States | |
| Canada | ||
| Mexico | ||
| Europe | Germany | |
| United Kingdom | ||
| France | ||
| Russia | ||
| Rest of Europe | ||
| Asia-Pacific | China | |
| Japan | ||
| India | ||
| South Korea | ||
| Australia | ||
| Rest of Asia-Pacific | ||
| Middle East and Africa | Middle East | Saudi Arabia |
| United Arab Emirates | ||
| Rest of Middle East | ||
| Africa | South Africa | |
| Egypt | ||
| Rest of Africa | ||
| South America | Brazil | |
| Argentina | ||
| Rest of South America | ||
| By Component | Hardware | Processors | |
| Accelerators (GPU, FPGA, ASIC) | |||
| Memory and Storage | |||
| High-Speed Interconnect | |||
| Software | |||
| Services | |||
| By Architecture | Heterogeneous (CPU+Accelerator) | ||
| Homogeneous (CPU-Only) | |||
| By Deployment Mode | On-Premises Exascale Systems | ||
| Exascale as a Service (Cloud/Hybrid) | |||
| By End-Use Industry | Government and National Labs | ||
| Academia and Research Institutes | |||
| Defense and Intelligence | |||
| Life Sciences and Pharmaceuticals | |||
| Energy (Oil, Gas, Nuclear, Renewables) | |||
| Manufacturing and Automotive | |||
| Financial Services | |||
| Weather and Climate Modeling Centers | |||
| By Geography | North America | United States | |
| Canada | |||
| Mexico | |||
| Europe | Germany | ||
| United Kingdom | |||
| France | |||
| Russia | |||
| Rest of Europe | |||
| Asia-Pacific | China | ||
| Japan | |||
| India | |||
| South Korea | |||
| Australia | |||
| Rest of Asia-Pacific | |||
| Middle East and Africa | Middle East | Saudi Arabia | |
| United Arab Emirates | |||
| Rest of Middle East | |||
| Africa | South Africa | ||
| Egypt | |||
| Rest of Africa | |||
| South America | Brazil | ||
| Argentina | |||
| Rest of South America | |||


Key Questions Answered in the Report
What is the projected value of the exascale computing market in 2030?
The market is forecast to reach USD 20.03 billion by 2030, growing at a 27.15% CAGR.
Which component segment grows the fastest through 2030?
Services post the quickest pace at 27.69% CAGR as firms seek managed exascale capabilities.
Why are heterogeneous architectures preferred for new deployments?
They combine CPUs, GPUs, and specialized accelerators, delivering higher performance-per-watt for AI and hybrid workloads.
Which region records the highest growth rate to 2030?
Asia Pacific leads with a 28.24% CAGR due to large-scale investments in China and Japan.
How do cloud providers influence adoption patterns?
Exascale-as-a-Service lowers capital barriers, allowing enterprises to rent fractional exaflop capacity on demand.
What is the primary challenge limiting full utilization of exascale systems?
Legacy software often fails to scale efficiently across millions of cores, requiring extensive code modernization.
Page last updated on:


