
Blood Collection Tubes Market Size and Share
Market Overview
| Study Period | 2020 - 2031 |
|---|---|
| Market Size (2026) | USD 2.55 Billion |
| Market Size (2031) | USD 3.54 Billion |
| Growth Rate (2026 - 2031) | 6.75 % |
| Fastest Growing Market | Asia Pacific |
| Largest Market | North America |
| Market Concentration | Medium |
Major Players *Disclaimer: Major Players sorted in no particular order Image © Mordor Intelligence. Reuse requires attribution under CC BY 4.0. | |
Blood Collection Tubes Market Analysis by Mordor Intelligence
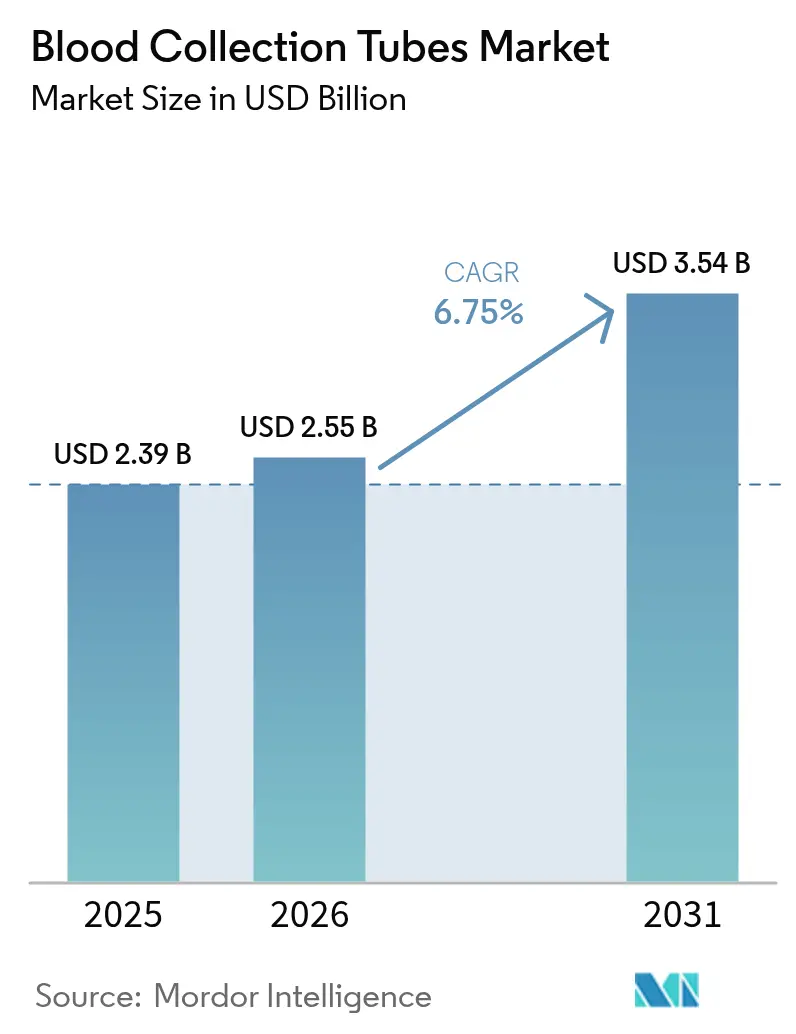
The blood collection tubes market size in 2026 is estimated at USD 2.55 billion, growing from 2025 value of USD 2.39 billion with 2031 projections showing USD 3.54 billion, growing at 6.75% CAGR over 2026-2031. Growth rests on the rebound in global diagnostic volumes, rapid technology upgrades in vacuum systems, and greater emphasis on patient-centric testing that collectively lift demand across hospitals, laboratories, and decentralized sites. Manufacturers are responding with hybrid materials that balance safety and sustainability, while automation—from capillary mini-draw devices to fully robotic phlebotomy—elevates both throughput and specimen integrity. At the same time, regulatory harmonization, exemplified by the FDA’s adoption of ISO 13485:2016, reduces compliance friction and supports cross-border production. Competitive focus is turning toward integrated solutions that merge smart tubes, digital tracking, and analytics, setting the stage for differentiated value propositions in an otherwise mature product category.
Key Report Takeaways
- By product type, serum-separating tubes led with 38.12% revenue share in 2025, whereas plasma-separating tubes are projected to compound at 8.53% CAGR to 2031.
- By material, plastic dominated with 54.92% of the blood collection tubes market share in 2025, while glass is forecast to expand at 8.63% CAGR through 2031.
- By method, vacuum tubes accounted for 46.21% of the blood collection tubes market size in 2025; non-vacuum formats are expected to grow at 8.41% CAGR between 2026 and 2031.
- By end-user, hospitals and clinics commanded 47.12% share in 2025, yet point-of-care and home-care settings will post the fastest 9.55% CAGR to 2031.
- By Application, diagnostics secured 58.09% share in 2025, yet therapeutic segment is projected to grow at 9.33% CAGR.
- By geography, North America retained 35.02% share in 2025, while Asia-Pacific is set to climb at a 7.28% CAGR over the forecast horizon.
Note: Market size and forecast figures in this report are generated using Mordor Intelligence’s proprietary estimation framework, updated with the latest available data and insights as of 2026.
Global Blood Collection Tubes Market Trends and Insights
Drivers Impact Analysis*
| Driver | % Impact on CAGR Forecast | Geographic Relevance | Impact Timeline |
|---|---|---|---|
| Growing prevalence of chronic diseases | +1.2% | Global; strongest in North America and Europe | Long term (≥ 4 years) |
| Expansion of diagnostic testing volume | +1.8% | Global; fastest in Asia-Pacific | Medium term (2-4 years) |
| Rising surgical and trauma procedure rates | +0.9% | North America and Europe; emerging influence in Asia-Pacific | Medium term (2-4 years) |
| Increasing government blood donation drives | +0.7% | Emerging markets in particular | Long term (≥ 4 years) |
| Technological advances in vacuum systems | +1.1% | North America and Europe; extending to Asia-Pacific | Short term (≤ 2 years) |
| Rapid growth of point-of-care testing | +1.3% | Global; pronounced in Asia-Pacific | Short term (≤ 2 years) |
| Source: Mordor Intelligence | |||


Growing Prevalence of Chronic Diseases
Rising incidences of diabetes, cardiovascular ailments, and cancer elevate routine monitoring needs, causing sustained uplift in tube volumes across hospital and outpatient sites. Aging populations in Europe and North America extend baseline demand, whereas emerging economies adopt guideline-based diagnostics that were previously scarce. WHO’s patient-blood-management framework underscores reliable specimen quality as essential for anemia reduction and maternal-health programs[1]World Health Organization, “Guidance on Patient Blood Management,” who.int. Novel tube chemistries that stabilize fragile biomarkers widen the testing menu for chronic-care pathways. As AI-driven platforms gain traction, early-stage detection expands, and high-quality tubes that guard analyte integrity become indispensable, thereby reinforcing the upward trajectory of the blood collection tubes market.
Expansion of Diagnostic Testing Volume
Post-pandemic reforms have permanently enlarged laboratory and point-of-care test menus. High-throughput panels now accompany annual wellness checks, chronic-disease reviews, and targeted screening, each requiring multiple tube types per encounter. Portable analyzers such as Truvian Health’s benchtop unit deliver 98% agreement against core labs, pushing diagnostic reach into pharmacies and community clinics. Precision-medicine initiatives further intensify specimen complexity, as clinicians request biomarker suites that depend on tubes engineered for RNA, cfDNA, or trace elements. This escalating test intensity directly multiplies unit consumption, reinforcing the growth of the blood collection tubes market worldwide.
Technological Advancements in Vacuum Collection Systems
Seventy-five years after the first Vacutainer, next-generation systems marry digital identifiers, closed-loop safety, and material science. BD’s MiniDraw enables finger-stick collection with venous-grade accuracy, serving retail care and home sampling. Hybrid chemo-PET tubes deliver glass-like vapor barriers while retaining shatter resistance, extending shelf life to two years[2]SLAS Technology Editorial Board, “Hybrid Chemo-PET Blood Collection Tubes,” slastech.org. Robotic phlebotomy, spearheaded by Vitestro’s Aletta, achieves 95% first-attempt success and integrates ultrasound guidance for vein mapping. Collectively, these advances elevate efficiency, reduce hemolysis, and unlock new service models that accelerate adoption across the blood collection tubes market.
Rapid Growth of Point-of-Care Testing Market
Decentralized care shifts blood collection from central labs to pharmacies, mobile units, and homes. BD’s collaboration with Babson Diagnostics delivers comprehensive panels using six capillary drops, cutting procedural time and needle anxiety. AI-enabled handheld devices maintain lab-grade precision, empowering non-phlebotomist staff to secure viable specimens. Needle-free systems like PIVO trim preanalytical errors by 56%, improving workflow and patient comfort. These attributes resonate in Asia-Pacific’s community clinics and Europe’s retail care hubs, driving the fastest CAGR segment within the blood collection tubes market.
Restraints Impact Analysis*
| Restraints Impact Analysis | (~) % Impact on CAGR Forecast | Geographic Relevance | Impact Timeline |
|---|---|---|---|
| Risk of infection from improper handling | –0.8% | Global; higher in low-resource settings | Medium term (2-4 years) |
| Price sensitivity and reimbursement limits | –1.1% | Global; most acute in emerging markets | Short term (≤ 2 years) |
| Regulatory pressure on single-use plastics | –0.6% | Europe and North America; spreading globally | Long term (≥ 4 years) |
| Volatility in raw-material supply chains | –0.9% | Global; region-specific vulnerabilities | Short term (≤ 2 years) |
| Source: Mordor Intelligence | |||
Risk of Infection from Improper Blood Handling
Occupational-safety agencies mandate sharps controls, yet uneven training raises exposure to needlestick injuries in resource-constrained hospitals. OSHA calls for puncture-proof containers and immediate disposal, adding operational cost[3]U.S. Department of Labor, “Needlestick Safety and Prevention,” osha.gov. Extreme weather disrupted over 19,000 U.S. donations in 2024, revealing fragility in collection logistics that can escalate contamination risk. Meanwhile, the FDA increased surveillance on substandard plastic syringes, signaling tougher oversight that can delay product releases. Together, these factors temper market expansion where infrastructure and compliance budgets remain thin.
Price Sensitivity and Reimbursement Constraints
Raw-material expenses absorb up to 20% of revenue for device makers, and supply-chain shocks from geopolitical conflicts push costs higher. Emerging-market hospitals face tighter reimbursement caps, compelling tender-driven purchases that favor lower-priced alternatives, even if performance lags. Smaller manufacturers coping with thin margins may delay innovation investments, curbing competitive diversity in the blood collection tubes industry. Policymakers advocating value-based care add further price pressure, squeezing profitability and slowing uptake of premium tube technologies.
*Our forecasts treat driver/restraint impacts as directional, not additive. The impact forecasts reflect baseline growth, mix effects, and variable interactions.
Segment Analysis
By Product Type: Plasma Tubes Drive Therapeutic Innovation
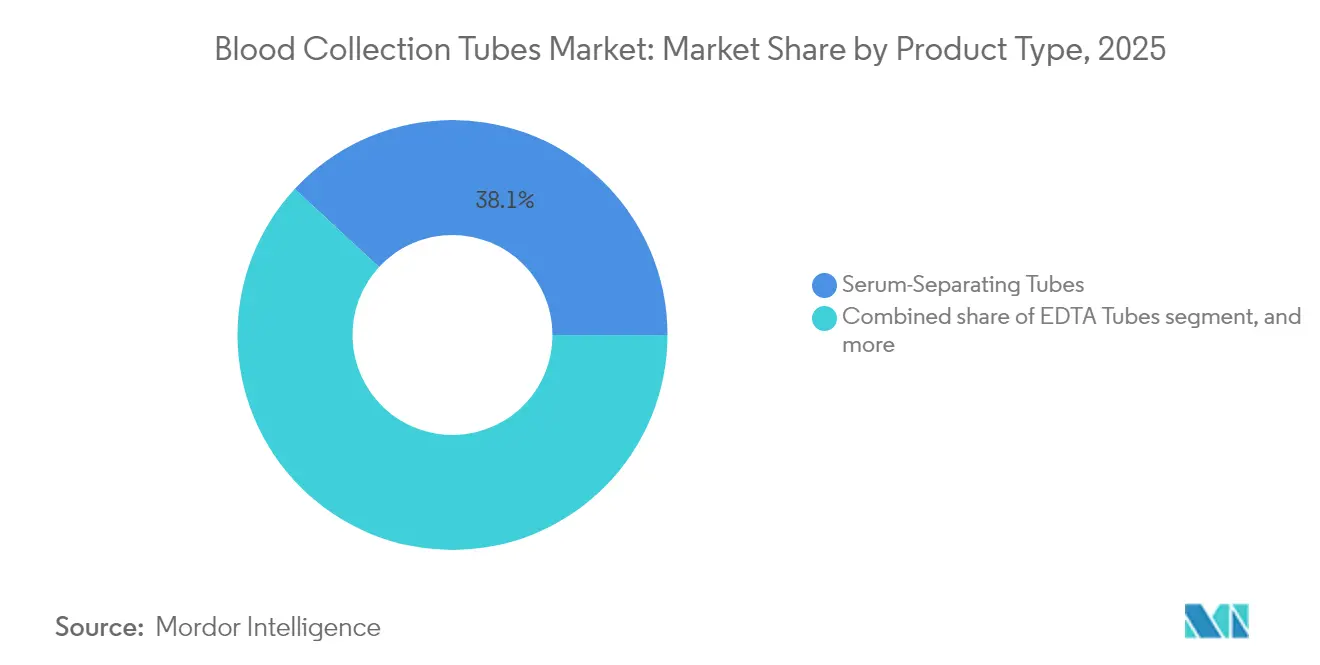
Serum-separating formats retained 38.12% share in 2025, anchored in routine chemistry panels across global labs. However, plasma-separating tubes will expand at 8.53% CAGR through 2031 on the back of regenerative-medicine protocols and cell-therapy workflows. Therapeutic applications claim 9.33% CAGR as platelet-rich plasma gains clinical favor for orthopedics and dermatology. Emerging ultrafiltration methods that enrich growth factors sharpen this demand curve and elevate the profile of specialized tubes within the blood collection tubes market.
Capillary micro-collection products are carving a niche in pediatric and point-of-care settings, buoyed by devices such as MiniDraw that reduce draw volumes without compromising analytical scope. EDTA tubes remain indispensable for hematology; rapid-serum variants fill emergency needs where turnaround time dictates clinical action. Collectively, these dynamics foster a balanced but growth-tilted portfolio, ensuring the segment contributes materially to overall blood collection tubes market growth.


By Material: Glass Resurgence Challenges Plastic Dominance
Plastic retained 54.92% of the blood collection tubes market share in 2025 due to breakage resistance and lower cost. Yet glass tubes are slated for the fastest 8.63% CAGR, propelled by sustainability mandates and superior analyte stability in trace-element studies. The EU’s Packaging and Packaging Waste Regulation compels recyclability by 2030, prompting R&D in hybrid tubes that fuse plastic robustness with glass-like vapor barriers.
Advanced chemo-PET variants now rival glass for chemical inertness while staying within biosafety guidelines, positioning them as a mid-transition solution. Recycling pilots in Denmark show promise for circular programs that may blunt regulatory penalties linked to single-use plastics. As these material shifts gain momentum, they reshape procurement criteria and reinforce the competitive stakes in the blood collection tubes market.
By Method: Automation Transforms Collection Paradigms
Vacuum devices made up 46.21% of the segment revenue in 2025, reflecting hospital standardization. Non-vacuum systems-chiefly syringe and capillary formats-will rise at 8.41% CAGR owing to rising decentralized care. Robotic phlebotomy, typified by Vitestro’s Aletta, illustrates a step-change: 95% first-stick success slashes redraws and eases staffing shortages.
Needle-free PIVO adapters integrate with existing IV lines and have demonstrated 56% lower preanalytical errors, underscoring efficiencies from technology cross-pollination. Paired with AI-driven vein visualization, these tools elevate patient experience and data reliability, ultimately reinforcing demand across the blood collection tubes market.
By End-User: Point-of-Care Settings Accelerate Decentralization
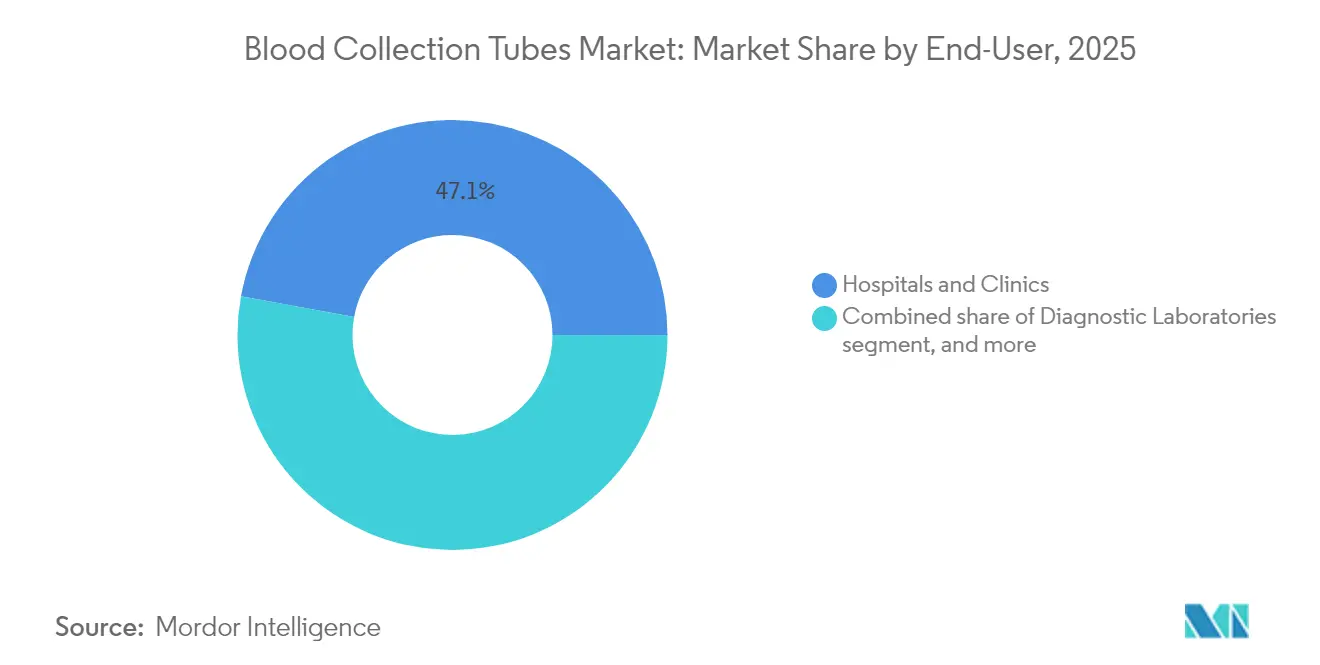
Hospitals and clinics generated 47.12% of 2025 revenue, leveraging established laboratories and high acuity caseloads. Yet point-of-care and home-based services will show the strongest 9.55% CAGR, driven by convenience, chronic-care management, and expanding telehealth programs. Diagnostic laboratories remain critical, processing high-volume submissions and mandating standardized tube performance to sustain throughput.
Blood banks and transfusion centers sustain niche but stable growth, boosted by therapeutic apheresis and immunoglobulin self-sufficiency targets set by public health agencies. Collectively, shifting sample-flow patterns intensify product diversification and help lift overall blood collection tubes market growth prospects.
By Application: Therapeutics Reshape Collection Requirements
Diagnostics secured 58.09% share in 2025 and will remain foundational, yet therapeutic uses—including transfusion and cell therapy—are set for 9.33% CAGR on the back of regenerative-medicine breakthroughs. Standardized platelet-lysate protocols across European establishments provide reproducible inputs for cell expansion, anchoring demand for plasma-optimized tubes.
National programs, such as the NHS’s push to supply home-grown plasma therapies to 17,000 patients annually, further amplify specialized-tube consumption. Integration of diagnostic-therapeutic workflows in precision medicine aligns with tubes that preserve both cellular and molecular cargo, reinforcing convergence trends within the blood collection tubes market.
Geography Analysis
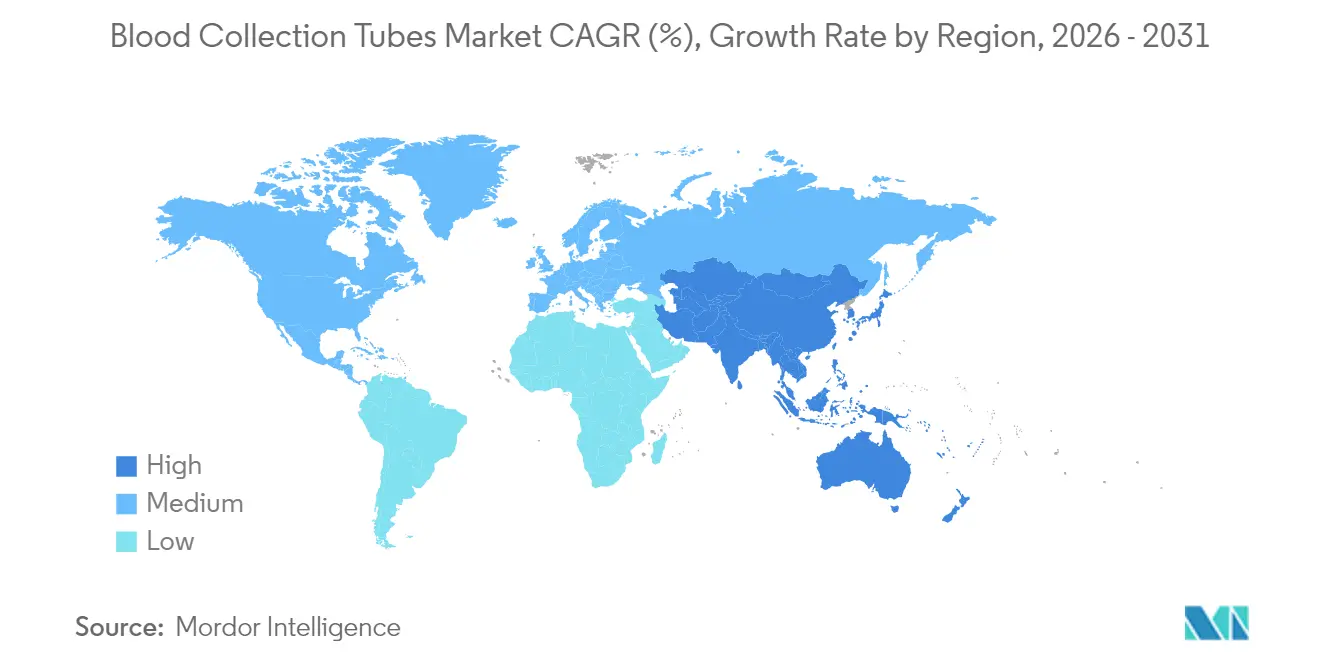
North America commanded 35.02% revenue share in 2025, a position underpinned by mature diagnostics infrastructure and early adoption of automation. The FDA’s Quality Management System Regulation, effective 2026, harmonizes requirements with ISO 13485:2016 and simplifies device clearances, encouraging domestic production and exports. BD’s pledge to invest USD 2.5 billion in U.S. capacity underscores confidence in steady regional demand. Weather-related donation shortfalls during 2024 spotlight resiliency gaps that may shape future infrastructure spending.
Asia-Pacific is projected to clock a 7.28% CAGR to 2031, powered by healthcare expansions under China’s “Healthy China 2030” and India’s widening lab networks. Terumo’s USD 15 million localization spend demonstrates the pull of regional scale and regulatory incentives. Rising per-capita outlays and government focus on AI enable leapfrog adoption of advanced collection and testing systems, positioning the region as the dynamo of blood collection tubes market growth.
Europe holds a robust share, strengthened by policy leadership in sustainability. The Packaging and Packaging Waste Regulation catalyzes material innovation, and collaborative platelet-lysate standardization across EU centers ensures high-quality therapeutic inputs. The NHS target of 25% plasma self-sufficiency by 2025 signals dependable domestic uptake, whereas smaller Eastern European markets offer incremental gains as infrastructure modernizes. Collectively, these geographies forge a balanced demand mix that underpins the global blood collection tubes market’s resilient outlook.

Regulatory Landscape
Blood collection tubes sit at the intersection of medical device and IVD quality requirements, with market access shaped by device classification, consensus standards, and conformity assessment pathways. In the United States, vacuum blood collection tubes are regulated by the FDA as Class II medical devices (21 CFR 862.1675, including Product Codes such as JKA and GIM), and they commonly require 510(k) premarket notification supported by performance and stability testing. FDA-recognized consensus standards used in validation and verification work include CLSI guidance for blood collection tubes and additives, along with handling and processing practices, while ISO 6710 remains a widely referenced international standard for single-use venous blood specimen containers.
In Europe, blood collection tubes fall under the In Vitro Diagnostic Medical Device Regulation (IVDR 2017/746), with classification typically as Class A or Class A (sterile) under Rule 5, which in turn requires technical documentation and CE marking aligned to the IVDR framework. The shift from IVDD to IVDR increases the depth of documentation and system-compatibility evidence when tubes are used as part of integrated collection and testing workflows. Regulatory maintenance activities can also affect day-to-day manufacturer operations, including the FDA updating product classification records for blood collection tubes (Product Code JKA/GIM) on June 8, 2026, which reinforces the need for active labeling, documentation, and quality system alignment.
Competitive Landscape
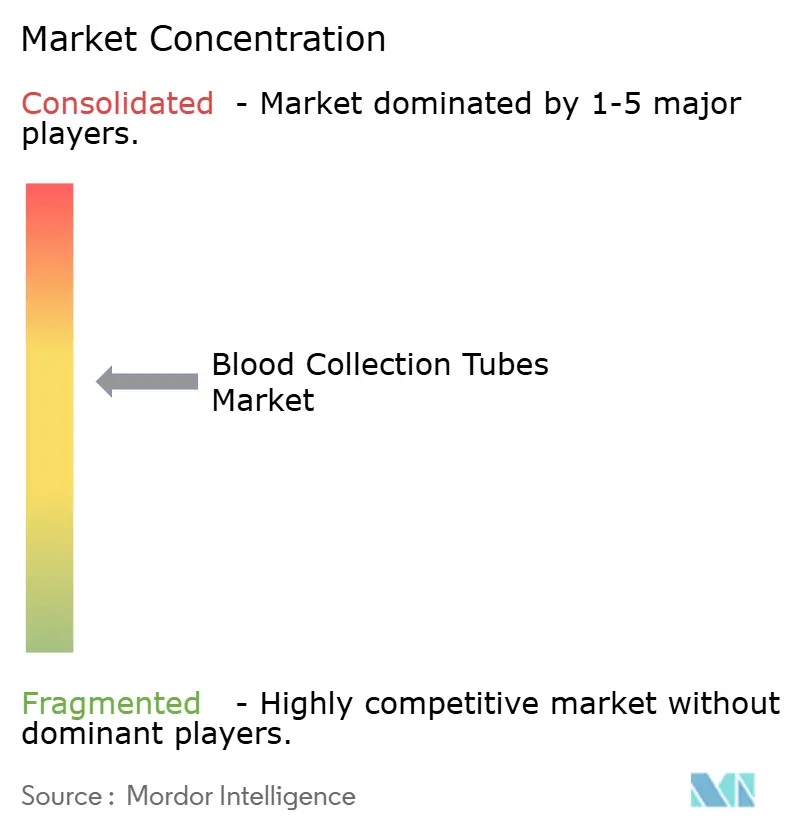
Market leadership remains moderately consolidated, with BD, Greiner Bio-One, and Terumo anchoring roughly half of global revenue. BD’s strategic spin-off of Biosciences and Diagnostic Solutions aims to create a pure-play MedTech entity focused on integrated collection-to-analysis offerings. Greiner Bio-One intensifies U.S. expansion through its Preanalytics business, leveraging a broad tube portfolio and proprietary additives. Terumo’s localization in China strengthens regional responsiveness while extending the reach of its Reveos™ automated processing platform.
Innovation rivalry orbits around three axes: autonomous phlebotomy, sustainable materials, and smart traceability. Vitestro’s CE-marked Aletta robot exemplifies disruptive potential, pairing AI with robotics to reduce dependency on skilled phlebotomists and speed large-volume draws. Material hybrids such as chemo-PET and multi-layer glass-plastic composites promise heightened analyte stability without sacrificing safety, differentiating newer entrants against incumbents.
Strategic alliances supplement organic R&D. BD’s capillary-testing pact with Babson Diagnostics broadens point-of-care reach, while Terumo’s collaboration with Sanquin automates Dutch blood-processing pipelines. As regulatory scrutiny escalates and sustainability directives tighten, competitive advantage will hinge on agility in compliance and eco-design, setting the stage for continued evolution within the blood collection tubes industry.
Blood Collection Tubes Industry Leaders
Becton, Dickinson & Company
Greiner Bio-One International GmbH
Terumo Corporation
Sarstedt AG & Co. KG
Qiagen N.V.
- *Disclaimer: Major Players sorted in no particular order

Market Opportunities and Future Outlook
Manufacturing scale-up and regionalization are creating whitespace for new supply corridors and private-label or OEM sourcing, particularly where healthcare systems prioritize continuity of consumable supply. In April 2026, SEM Plastik/SEM Biotech launched a high-capacity vacuum blood collection tube production line in Turkey using Husky Technologies ICHOR integrated medical systems, citing 500 million tubes in annual capacity. This integrated, monitored production platform supports higher throughput and traceability, aligning with regulated consumable requirements while improving competitive positioning on both cost and quality for tenders and distributor-led channels.
Safety-engineered, workflow-oriented collection configurations are a second opportunity area as laboratories and decentralized sites focus on reducing preanalytical error and standardizing specimen management. KB Medical Group (KBMED) reported commencing mass production in November 2025 with vacuum blood collection tube capacity exceeding 100 million units per month to support European laboratory supply, signaling continued investment in regional capacity and components aligned with modern collection practices. Across markets, the growing use of ISO 6710 and CLSI standards in device verification, together with the IVDR emphasis on compatibility validation for integrated systems, also supports demand for tube portfolios and kits validated across analyzers, transport conditions, and automation workflows rather than sold only as stand-alone consumables.
Recent Industry Developments
- February 2026: BD launched the BD Vacutainer Urine Complete Cup Kit, a three-tube collection system designed to expand testing capabilities and streamline specimen workflows. The bundled format supports standardization in preanalytical steps and helps laboratories reduce handling variability through a single, integrated collection configuration.
- January 2026: BD and Envetec Sustainable Technologies completed a feasibility study for recycling laboratory plastics, including blood collection tubes, into high-quality feedstock suitable for manufacturing. The initiative advances a circular-economy pathway for high-volume consumables, aligning product design and materials strategy with tightening sustainability requirements.
- November 2024: Terumo Blood and Cell Technologies invested USD 15 million to localize production of Trima Accel and Spectra Optia in China. While focused on blood and cell technologies, the localization strengthens regional supply resilience for blood collection and processing ecosystems that consume related collection consumables.


Research Methodology Framework and Report Scope
Market Definition and Coverage
For this study, the blood collection tubes market covers revenue from tubes used to collect, store, and transport blood samples for diagnostic testing, including tubes prepared with additives that support specific lab assays.
Scope exclusions: We exclude blood collection needles, holders, lancets, and downstream lab analyzers, and we also exclude blood bags used for transfusion.
Segmentation Overview
- By Product Type
- Serum-Separating Tubes
- EDTA Tubes
- Plasma-Separating Tubes
- Rapid Serum Tubes
- Capillary Micro-Collection Tubes
- Other Product Types
- By Material
- Plastic Tubes
- Glass Tubes
- By Method
- Vacuum Blood Collection Tubes
- Non-Vacuum / Syringe-Based Tubes
- By End-User
- Hospitals & Clinics
- Diagnostic Laboratories
- Blood Banks & Transfusion Centers
- Point-of-Care / Home-Care Settings
- By Application
- Diagnostics
- Therapeutics (Transfusion / Cell-therapy)
- Geography
- North America
- United States
- Canada
- Mexico
- Europe
- Germany
- United Kingdom
- France
- Italy
- Spain
- Rest of Europe
- Asia-Pacific
- China
- Japan
- India
- Australia
- South Korea
- Rest of Asia-Pacific
- Middle East & Africa
- GCC
- South Africa
- Rest of Middle East & Africa
- South America
- Brazil
- Argentina
- Rest of South America
- North America
Data Sources, Market Sizing, and Validation
Desk Research
Desk research was used to establish the demand context and operating boundaries before the model was built. We relied on public health and utilization signals, such as diagnostic testing volumes and care delivery mix, to understand where tube consumption tends to sit across settings.
Key references included public and official sources such as the US CDC, the World Health Organization, the World Bank, OECD health statistics, and peer reviewed articles indexed on PubMed. We also reviewed standards and guidance documents that influence specimen collection practices, for example tube usage order and additive suitability, along with import-export trade statistics where relevant. Company annual reports, investor presentations, and reputable press were used to map product portfolios and to sanity check pricing direction. A paid subscription focused on company financials and patent databases was used selectively for cross checks. These examples are not exhaustive, and other public and paid sources were also used for data collection, validation, and clarification.
Primary Interviews and Surveys
Primary work focused on validating how tubes are purchased and consumed across hospitals, diagnostic laboratories, and blood banks, and how ordering is split between routine chemistry, hematology, coagulation, and other common draws. Expert calls were used to test assumptions on average tubes per patient visit, the share of evacuated versus non evacuated formats, and typical price differences by additive and material. This helped close gaps left by public data.
Because the market is global, inputs were checked across major regions so that regional practice differences and procurement cycles were not averaged out incorrectly. The final assumptions were then reconciled to a consistent set of year-average currency conversions.
Distribution of primary research fieldwork respondents
| Company type | Respondent position | Region |
|---|---|---|
| Top tier: 34% | CXOs: 18% | APAC: 41% |
| Mid tier: 48% | Functional/Unit leaders: 33% | EMEA: 35% |
| Smaller Players: 18% | Managers: 49% | Americas: 24% |
Market-Sizing & Forecasting
Sizing started with a top down build where regional blood draw and diagnostic activity indicators were used to reconstruct an addressable tube demand pool. That pool was then converted into value using representative tubes per procedure and blended selling prices. We kept the math simple and traceable so each assumption could be explained and replaced when better evidence is available.
Inputs that meaningfully move the model included outpatient versus inpatient testing mix, growth in chronic disease monitoring visits, the share of evacuated tubes in routine workflows, average tubes used per patient encounter, and the pricing spread between plastic and glass tubes along with additive driven price uplift. These were adjusted by region to reflect differences in laboratory penetration and care access, and then corroborated using selective bottom up checks such as sampled price points from procurement conversations. We also ran a supplier level revenue reasonableness test to avoid unrealistic totals.
For forecasting, scenario analysis was used because adoption and utilization can shift with policy, lab consolidation, and infection control practices, which do not always follow a smooth curve. The base case growth path was tied to expected test volume growth and gradual mix shift toward higher throughput lab settings. Where primary feedback pointed to supply or reimbursement friction, growth was moderated accordingly.
Data Validation & Update Cycle
Model outputs were checked against independent signals such as healthcare utilization trends, published lab testing patterns, and regional procurement behavior shared by interviewees. When a region or tube type produced an outlier result, assumptions were reopened and rechecked, and then a second analyst reviewed the changes before sign off.
We refresh this report at least annually so new clinical practice shifts, regulatory changes, and pricing movements are captured in the next cycle. If a material event occurs between refreshes, such as a major product change or a sustained price reset, the assumptions are revisited and affected sections are updated. Before delivery, an analyst performs a final pass so clients receive the latest updated view.
Mordor Intelligence's Blood Collection Tubes Market Size Compared With Other Published Estimates
Market size numbers for blood collection tubes can vary across sources, even when the topic sounds identical at first glance. Differences typically come from what is counted as a tube, which care settings are included, whether pricing reflects list price or realized procurement price, and whether the year is the base year or a forward estimate.
By tracking key demand drivers and refresh timing, Mordor Intelligence keeps the model tied to diagnostic draw activity and limits scope creep by counting only tube revenue (not needles, holders, or blood bags), which is a common reason some totals come out higher. Other gaps usually come from blending higher priced specialty tubes into the average without showing mix logic, using aggressive test volume growth assumptions, or applying spot currency conversions that do not match a year average approach.
Benchmark comparison
| Source | Market Size | Gaps in Research Methodology |
|---|---|---|
| Mordor Intelligence | USD 2.55 B (2026) | |
| Global Consultancy A | USD 5.99 B (2025) | This estimate appears to use a broader boundary or a higher blended price base, and it is anchored to 2025 which can also shift the value if pricing and mix are not normalized to a consistent base year. |
| Industry Data Publisher B | USD 4.40 B (2025) | The published number is likely influenced by a wider inclusion set across tube categories or care settings, and it may apply different tube type mix weights (for example, a higher assumed share of premium additive tubes) without showing the usage per draw logic. |
Looking across the table, the spread is mainly explained by scope boundaries and the way average pricing is built from tube mix and year selection. Our approach stays repeatable because the total is derived from clear demand activity, practical usage rates, and price checks that can be revisited whenever new evidence is collected.


Key Questions Answered in the Report
What is the current size of the blood collection tubes market?
The blood collection tubes market size is valued at USD 2.55 billion in 2026.
Which region is growing fastest in the blood collection tubes market?
Asia-Pacific is expected to expand at a 7.28% CAGR through 2031, the highest among all regions.
Why are glass blood collection tubes regaining popularity?
Sustainability mandates and superior sample-stability qualities are pushing glass tubes to an 8.63% CAGR, outpacing plastics.
How is automation influencing blood collection practices?
Robotic and AI-guided systems, such as Vitestro’s Aletta, deliver 95% first-stick success and lower preanalytical errors, driving uptake in laboratories and clinics.
What impact will the FDA’s Quality Management System Regulation have?
The rule aligns U.S. requirements with ISO 13485:2016, streamlining global compliance for manufacturers and potentially accelerating product launches.
Which product segment is forecast to grow quickest?
Plasma-separating tubes are projected to grow at 8.53% CAGR due to expanding regenerative-medicine applications.
Page last updated on:


 Your data is secure and never sold or shared.


