
Blood Lancet Market Size and Share
Market Overview
| Study Period | 2020 - 2031 |
|---|---|
| Market Size (2026) | USD 2.06 Billion |
| Market Size (2031) | USD 2.92 Billion |
| Growth Rate (2026 - 2031) | 7.22 % |
| Fastest Growing Market | Asia Pacific |
| Largest Market | North America |
| Market Concentration | Medium |
Major Players *Disclaimer: Major Players sorted in no particular order Image © Mordor Intelligence. Reuse requires attribution under CC BY 4.0. | |
Blood Lancet Market Analysis by Mordor Intelligence
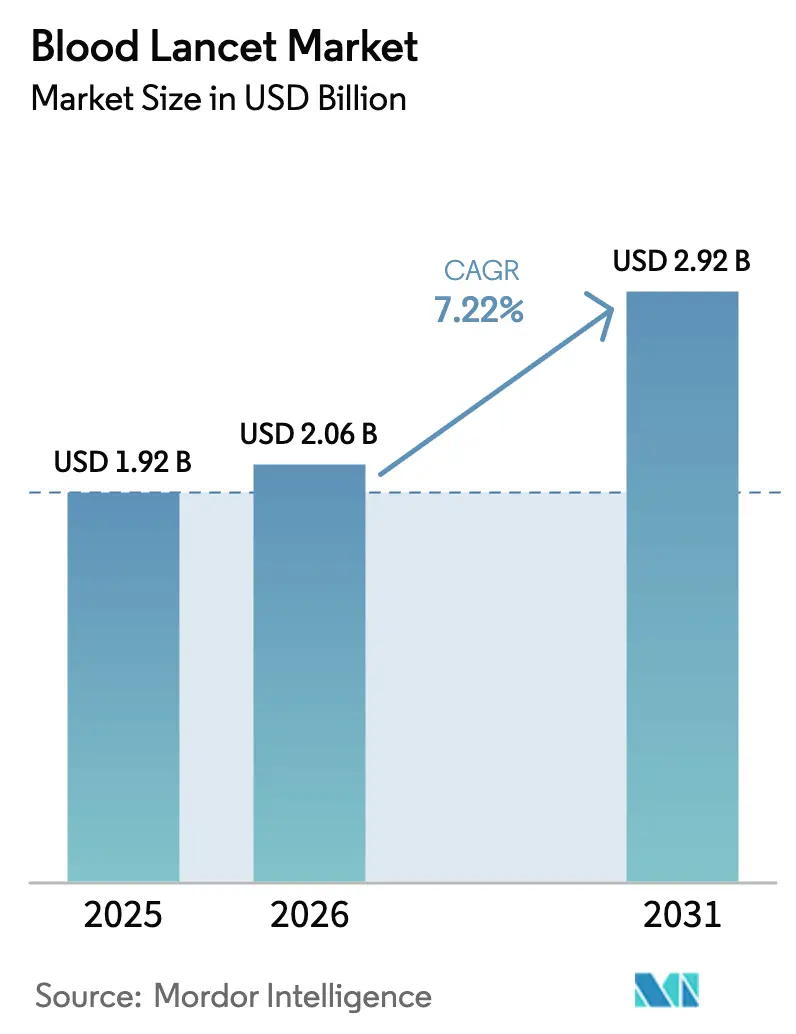
The Blood lancet market size was valued at USD 1.92 billion in 2025 and estimated to grow from USD 2.06 billion in 2026 to reach USD 2.92 billion by 2031, at a CAGR of 7.22% during the forecast period (2026-2031). Growth stems from surging diabetes prevalence, broader insurance coverage for self-monitoring supplies, and accelerating adoption of point-of-care diagnostics in hospitals, retail clinics, and homes [1]World Health Organization, “WHO Compendium of Innovative Health Technologies for Low-Resource Settings 2024,” who.int . Safety-engineered devices gain traction as regulators mandate sharps-injury prevention, while painless microneedle concepts shape long-term innovation pipelines. Sustainability priorities, raw-material cost swings, and emerging non-invasive glucose sensors collectively define the competitive playbook for the Blood lancet market through 2030.
Key Report Takeaways
- By product type, Safety lancets led with 60.74% revenue share in 2025; Standard/Personal-use lancets are projected to expand at an 8.05% CAGR to 2031.
- By end user, hospitals accounted for 50.98% of the Blood lancet market size in 2025, while diagnostic laboratories record the highest projected CAGR at 8.12% through 2031.
- By application, glucose testing captured 80.92% of Blood lancet market share in 2025 and haemoglobin testing is advancing at an 8.21% CAGR through 2031.
- By geography, North America held 41.88% Blood lancet market share in 2025; Asia-Pacific is set to grow at an 8.25% CAGR between 2026-2031.
Note: Market size and forecast figures in this report are generated using Mordor Intelligence’s proprietary estimation framework, updated with the latest available data and insights as of 2026.
Market Trends and Insights
Drivers Impact Analysis of Blood Lancet Market*
| Driver | (~) % Impact on CAGR Forecast | Geographic Relevance | Impact Timeline |
|---|---|---|---|
| Rising diabetes & other chronic disease incidence | +1.8% | Global, with highest impact in APAC and MEA | Long term (≥ 4 years) |
| Growing adoption of point-of-care diagnostics | +1.5% | North America & EU, expanding to APAC | Medium term (2-4 years) |
| Favourable reimbursement policies in OECD nations | +1.2% | North America, Europe, Australia | Medium term (2-4 years) |
| Expansion of blood-donation & screening programs | +0.9% | Global, with emphasis on developing regions | Long term (≥ 4 years) |
| Painless microneedle innovations boosting paediatric compliance | +0.7% | Global, early adoption in developed markets | Short term (≤ 2 years) |
| Home-based genetic / tele-health finger-prick kits surge | +1.0% | North America & EU, expanding globally | Short term (≤ 2 years) |
| Source: Mordor Intelligence | |||
Rising Diabetes and Other Chronic Disease Incidence
More than 588.7 million adults were living with diabetes in 2024, a number projected to hit 852.5 million by 2050. Untreated populations in emerging regions open a sizable addressable pool for capillary-blood monitoring, while aging demographics in developed economies multiply per-patient lancet use as comorbidities rise. Routine screening embedded in primary care pathways across OECD countries secures baseline demand, and national drive programs in India and China lift unit shipments sharply through 2030. Elevated chronic kidney and cardiovascular disease prevalence further widens the Blood lancet market as multiparameter finger-prick panels become standard follow-up diagnostics.
Growing Adoption of Point-of-Care Diagnostics
Decentralized testing models shorten turnaround times and improve therapeutic decision-making, prompting emergency rooms, ambulatory centers, and rural clinics to bulk-purchase disposable lancets. Portable analyzers that fit into backpack kits enable outreach in underserved zones, multiplying test frequency over a single patient episode. FDA fast-track pathways for at-home glucose and haemoglobin devices legitimize consumer self-testing, and private insurers increasingly reimburse home-based kits, stimulating retail-pharmacy demand. Integrated workflow benefits—fewer venipunctures, lower lab courier costs, immediate drug titration—cement the Blood lancet market as a foundational supply line for bedside diagnostics.
Favorable Reimbursement Policies in OECD Nations
Medicare Advantage and European national health schemes reimburse routine lancets under bundled diabetes management programs. Monthly allotments of testing supplies remove out-of-pocket barriers, encouraging regular self-monitoring. Occupational-safety clauses in these policies also absorb premium pricing for safety lancets, since reduced needlestick injuries lower workers’ compensation payouts. Reimbursement parity between in-clinic and self-administered tests sustains balanced demand across institutional and consumer channels, anchoring the Blood lancet market against short-term volume shocks.
Expansion of Blood-Donation & Screening Programs
WHO blood-management guidelines stipulate multiple sample draws during donor sessions, pushing per-donation lancet counts higher [2]World Health Organization, “WHO Compendium of Injection Safety,” who.int . Mobile collection units rely solely on single-use lancets due to sterilization limits, intensifying demand in populous countries such as Nigeria and Indonesia. International aid flows earmarked for blood-safety infrastructure routinely include lancet provisioning, stabilizing baseline volumes in resource-constrained regions and creating fresh tender opportunities for mid-tier manufacturers.
Restraints Impact Analysis of Blood Lancet Market*
| Restraint | (~) % Impact on CAGR Forecast | Geographic Relevance | Impact Timeline |
|---|---|---|---|
| Infection risk from lancet reuse & poor disposal | -0.8% | Global, particularly in resource-constrained settings | Medium term (2-4 years) |
| Emergence of non-invasive glucose-monitoring devices | -1.2% | North America & EU initially, expanding globally | Long term (≥ 4 years) |
| Sharps-waste environmental regulations raising costs | -0.6% | Europe & North America, expanding to APAC | Medium term (2-4 years) |
| Medical-grade stainless-steel supply bottlenecks | -0.4% | Global, with highest impact in Asia manufacturing hubs | Short term (≤ 2 years) |
| Source: Mordor Intelligence | |||
Infection Risk from Lancet Reuse and Poor Disposal
WHO injection-safety campaigns spotlight improper sharps disposal as a leading vector for blood-borne pathogen transmission. Compliance costs rise as clinics must provide puncture-proof bins and certified incineration agreements, eroding discretionary budgets in low-income regions. Litigation linked to healthcare-worker injuries heightens institutional risk aversion, pushing procurement toward costlier retractable models and compressing margins for basic metal-blade lines.
Emergence of Non-Invasive Glucose-Monitoring Devices
Continuous glucose monitors achieve lab-grade accuracy without routine finger-stick calibration, eliminating up to 85% of daily lancet use among insulin-dependent patients in pilot programs across Germany and Japan. Wearable optical sensors tethered to smartphone dashboards amplify user preference for painless measurement, raising a long-term substitution threat to the Blood lancet industry. Device prices remain high in 2025, but scaling economies and insurer coverage could tip adoption curves within five years.
*Our forecasts treat driver/restraint impacts as directional, not additive. The impact forecasts reflect baseline growth, mix effects, and variable interactions.
Blood Lancet Market Segment Analysis
By Product Type:
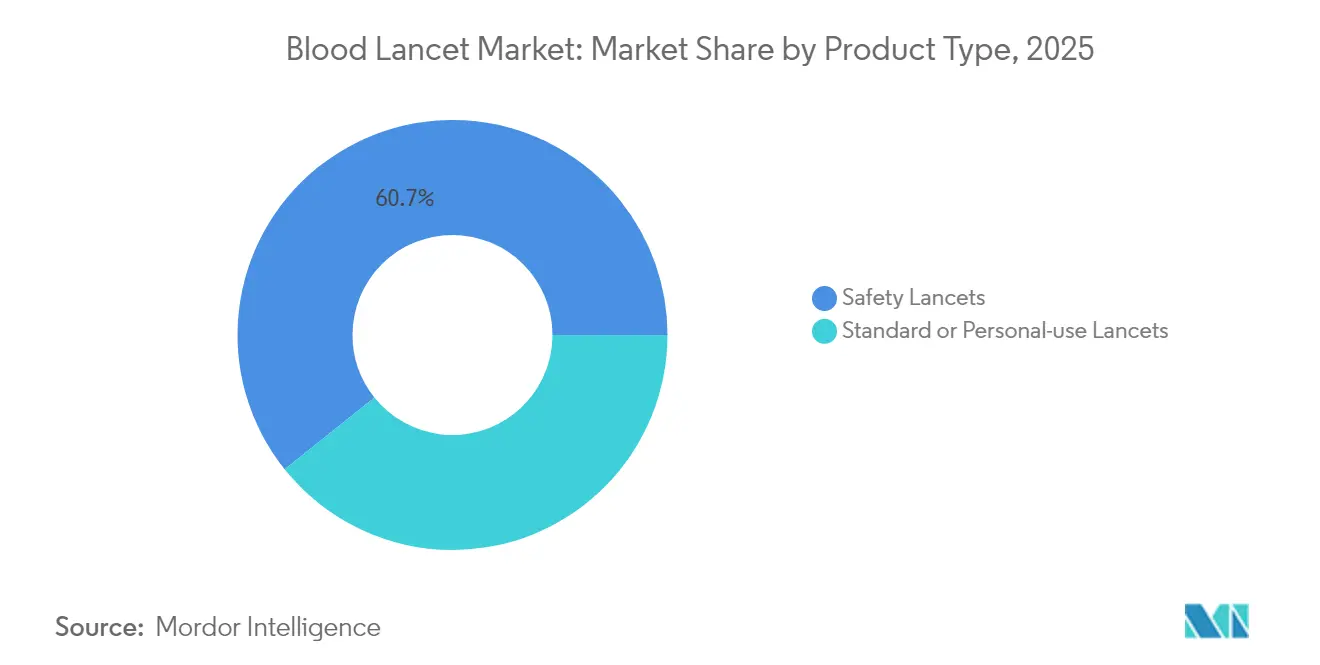
Safety Features Underpin Premium AdoptionSafety lancets captured 60.74% of Blood lancet market size in 2025, reflecting mandatory sharps-injury prevention protocols in hospital supply chains. Institutional buyers accept higher unit prices because retractable designs lower liability exposures and workers’ compensation claims. Standard or personal-use lancets, while priced 35% lower on average, deliver the fastest volume growth at an 8.05% CAGR as tele-health consults and over-the-counter diabetes packages normalize home testing routines.
Hospitals in the United States and Western Europe lock three-year supply contracts that favor ISO-certified safety models, safeguarding predictable revenue streams for market leaders. Meanwhile, e-commerce channels in Asia promote vivid color variants, ergonomic grips, and bulk refill packs that appeal to self-managing consumers. Hybrid SKUs merging protective sleeves with economical spring systems target low-to-mid income clinics, signaling future convergence within the Blood lancet market .



By End User:
Hospital Scale Meets Laboratory AgilityHospitals accounted for 50.98% share of Blood lancet market size in 2025, thanks to high-volume draws from emergency wards, oncology units, and critical-care pathways requiring serial testing. Central purchasing departments negotiate bundled deals covering lancets, alcohol swabs, and vacutainers, bolstering supplier leverage. Diagnostic laboratories, however, post the highest 8.12% CAGR to 2031 as personalized medicine panels and genomic workflows boost sample throughput.
Commercial labs invest in auto-loading workstation trays that standardize depth settings, cutting error rates and lowering wastage. Blood banks keep a steady base load, driven by WHO-aligned donor safety protocols. Fast-growing home-care agencies equip visiting nurses with pre-sterilized lancet kits, diversifying order patterns and expanding the Blood lancet market beyond brick-and-mortar health facilities.
By Application:
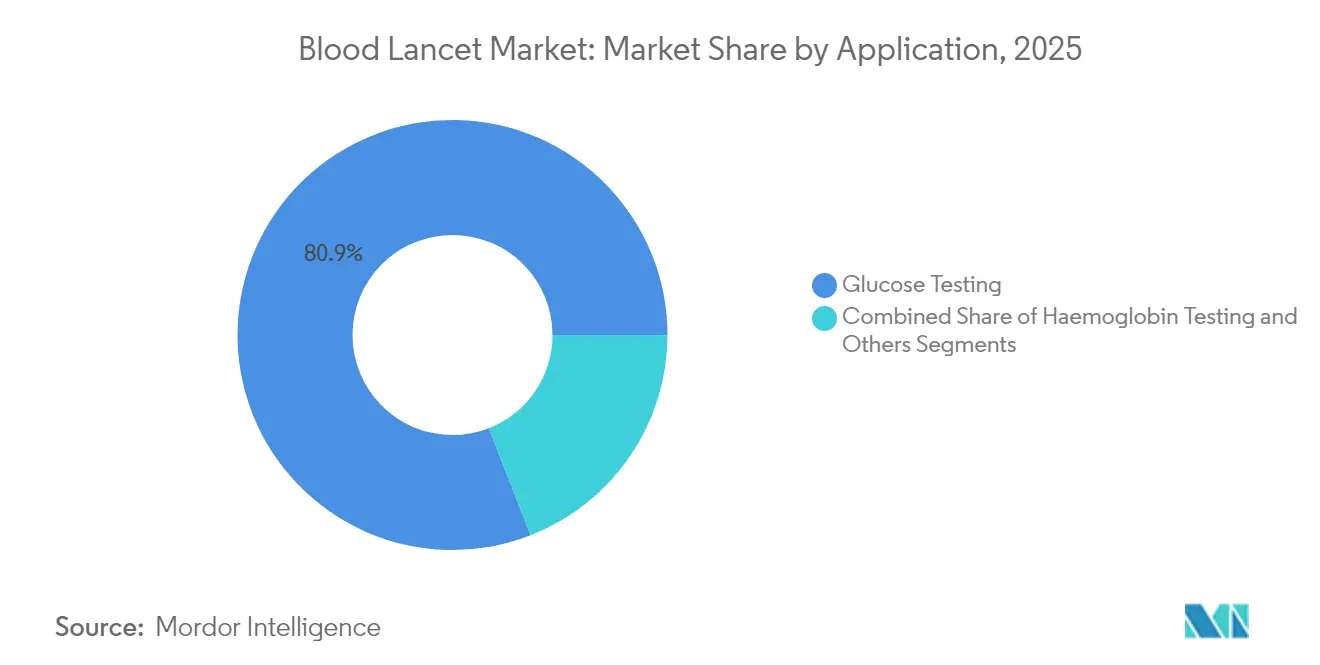
Glucose Dominance Faces Early DiversificationGlucose testing commanded 80.92% Blood lancet market share in 2025, a testament to entrenched diabetes management guidelines. Each insulin-treated patient averages three to five finger-sticks per day, translating into resilient recurrent revenue. Yet haemoglobin testing advances at an 8.21% CAGR through 2031 as anemia-screening mandates enter prenatal and geriatric care bundles worldwide, creating tailwinds for higher-gauge blade formats optimized for lower-volume draws.
Emerging applications in lipid profiling, rapid infectious-disease screens, and platelet-rich plasma procedures progressively diversify consumption. These new use cases rely on capillary micro-samples rather than venous draws, ensuring the Blood lancet market retains relevance even as non-invasive glucose monitoring gains share.
Geography Analysis
North America Blood Lancet Market
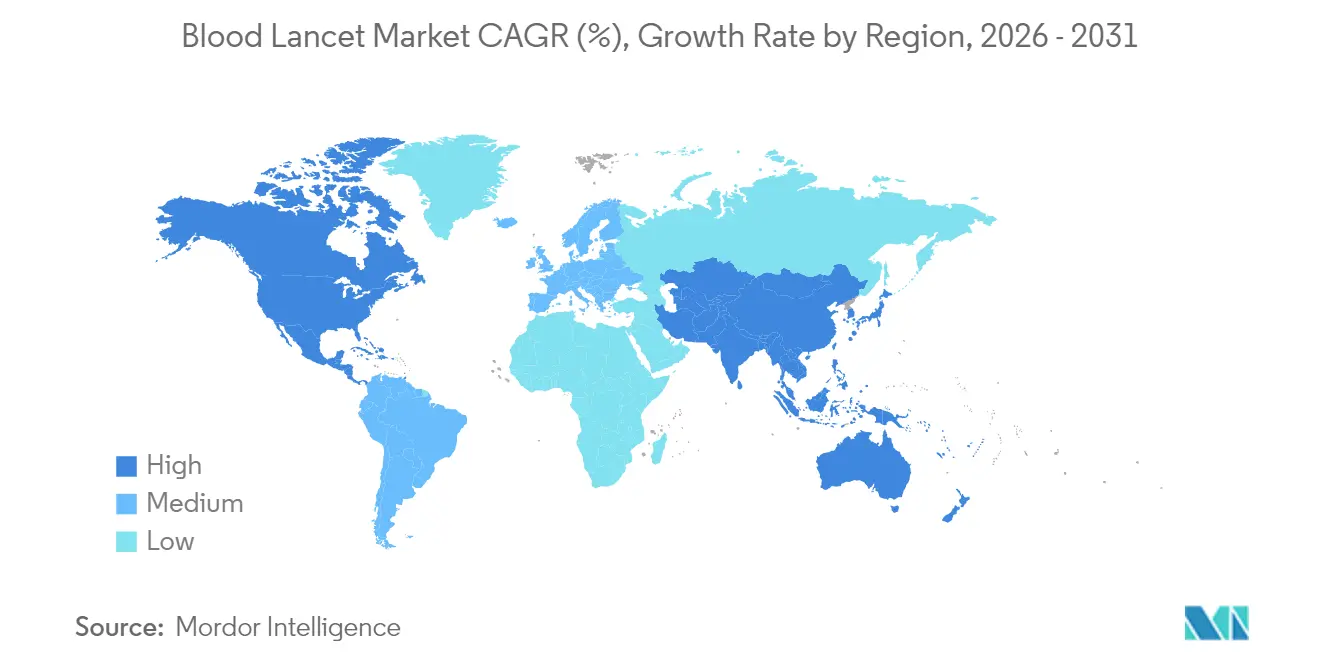
North America’s Blood lancet market size leads with a 41.88% revenue share in 2025, anchored by Medicare reimbursement for safety consumables and widespread insurance coverage for at-home diabetes supplies. Hospitals in the United States routinely adopt pain-minimized lancets to bolster patient satisfaction metrics and avert worker-safety litigation. Canadian provincial health plans deploy community-pharmacy collection hubs that distribute subsidized lancet starter kits, sustaining baseline demand.
APAC Blood Lancet Market
Asia-Pacific is the fastest-growing region, projecting an 8.25% CAGR through 2031 as India’s national non-communicable disease (NCD) program scales rural screening and China’s urban clinics adopt tele-monitoring platforms. Public-private partnerships supply low-cost safety lancets in Indonesia’s provincial health posts, while Japan’s aging society pushes daily capillary testing volumes upward in long-term-care homes. Currency-hedged contract structures and local blade machining investments protect multinational suppliers from raw-material price shocks in the region.
Europe, South America and GCC Blood Lancet Market
Europe maintains stable share through robust procurement consortia such as NHS Supply Chain, which reserve tender slabs for environmentally compliant devices. Sharps-waste directives incentivize biodegradable components, opening niche opportunities for polymer innovators. South America’s growth revolves around Brazilian Unified Health System upgrades and Argentina’s import-substitution incentives, whereas Gulf Cooperation Council states procure premium microneedle kits aimed at medical tourists. Overall, region-specific reimbursement and regulation patterns collectively broaden the Blood lancet market while tempering one-size-fits-all product strategies.

Regulatory Landscape
In the United States, blood lancets are regulated under 21 CFR 878.4850, with a use-based split that affects time-to-market and clinical positioning. Single-use blood lancets with integral sharps-injury prevention features fall under Class II and generally follow the 510(k) premarket notification route, while multiple-use lancets intended for multiple-patient use are Class III and require an approved PMA or a completed product development protocol, which materially raises evidence and compliance burdens.
FDA expectations also extend to use limitation and traceability controls. Labeling is a critical anchor, with FDA guidance emphasizing clear single-patient-use labeling to reduce bloodborne pathogen transmission risk, and establishments must complete annual FDA registration and device listing between October 1 and December 31 each year. Globally, ISO 13485:2016 remains the widely recognized quality management system baseline for medical device manufacturers, and it was reviewed and confirmed by ISO in 2025, reinforcing supplier qualification and audit requirements across multinational supply chains.
Value Chain Analysis
The blood lancet value chain starts with inputs such as medical-grade stainless steel (commonly 304/316L), polymers (HDPE, LDPE, ABS, PP), spring steel, and medical-grade adhesives, followed by precision metalworking and molding. Core manufacturing steps include wire drawing/straightening, bevel and tip grinding to achieve consistent geometry, injection molding of hubs/caps and safety components, automated assembly into spring or retractable mechanisms, and terminal sterilization (typically ethylene oxide or radiation) before packaging and labeling.
Downstream, products move through hospital and GPO tenders, national procurement systems (including the NHS Supply Chain), diagnostic laboratory distributors, retail pharmacies, and e-commerce channels for home testing. ISO 13485-aligned QMS and region-specific regulatory documentation shape supplier qualification and ongoing audits.
Competitive Landscape
The Blood lancet industry is moderately concentrated. Becton Dickinson, Roche, and Abbott leverage global distribution infrastructure, proprietary blade-coating chemistries, and high-throughput molding lines to guard share. Mid-tier players such as Owen Mumford differentiate via customizable depth settings and pediatric-friendly designs, while Asian OEMs pursue cost leadership on standard lancets. Vertical integration into needle-wire drawing and automated assembly grants incumbents scale economies that buffer commodity steel price swings.
R&D pipelines focus on pain reduction, workflow automation, and eco-friendly materials. BD’s UltraTouch set uses thinner pen-point tips that cut penetration force by up to 32%. Owen Mumford’s Unistik 3 received multi-gauge FDA clearance in 2025, widening clinical versatility. Start-ups prototype laser-based micro-perforation to sidestep disposable blades, posing a medium-term disruption threat.
Strategic moves include MTD Group’s acquisition of Ypsomed’s consumable unit, boosting annual capacity past 2.5 billion pieces and strengthening negotiating power with raw-material suppliers. Terumo invests in donor-focused devices linked to its plasma-collection systems, creating cross-selling synergies. Meanwhile, Medline’s recall of swabsticks underscores that quality-assurance lapses can ripple across adjacent single-use categories, prompting buyers to favor vendors with spotless compliance histories. Collectively, innovation cadence, supply-chain resilience, and regulatory alignment will dictate competitive outcomes within the Blood lancet market through 2030.
Blood Lancet Industry Leaders
Becton, Dickinson and Company
F. Hoffmann-La Roche Ltd
B. Braun Melsungen AG
Abbott
Terumo Corporation
- *Disclaimer: Major Players sorted in no particular order

Blood Lancet Market Companies Covered in this Report
- Becton Dickinson & Co.
- Roche
- Abbott Laboratories
- Terumo Corp.
- B. Braun
- Owen Mumford
- HTL-Strefa S.A.
- Ypsomed
- Nipro Corp.
- Greiner Bio-One GmbH
- SteriLance Medical
- Intrinsyk LLC
- Arkray
- Amkay Products Pvt Ltd
- Sarstedt
- HTD Medical Inc.
- AgaMatrix
- Feiner Technology Inc.
- Sterimed (Sagard)
- Lifescan

Market Opportunities and Future Outlook
Procurement-driven demand for safety-engineered, single-use lancets continues to create whitespace for suppliers that can demonstrate sharps-injury prevention performance, sterilization control, and sustainable packaging within tender specifications. The UK procurement environment offers a clear anchor: NHS framework specifications for blood-collection consumables reference requirements such as BS EN ISO 11135:2014+A1:2019 for ethylene oxide sterilization and expect UKCA/CE-marked products, raising the bar for compliant, audit-ready manufacturers and packaging partners.
On the product side, opportunities cluster around user-centric safety devices and capillary micro-sampling workflows that reduce variability and improve patient experience in decentralized testing. A concrete market action is KBMED Safety Lancet Series launched in June 2026 in the United States, featuring one-button activation, automatic needle retraction, and adjustable penetration depth, which reflects retailer and provider interest in differentiated safety and comfort features beyond commodity blades. Ongoing patenting activity around single-use lancing mechanisms and integrated sensing or micro-sample handling also points to an active design pipeline that suppliers can translate into premium SKUs for hospitals, diagnostic labs, and home-care kits while meeting labeling expectations for single-patient use.
Recent Industry Developments in Blood Lancet Market
- May 2026: Roche announced a definitive merger agreement to acquire PathAI to expand AI-driven capabilities within its Diagnostics division. The announcement strengthens digital pathology and analytics infrastructure that supports higher-throughput diagnostic workflows, which in turn supports demand for standardized capillary sampling and single-use consumables in labs and decentralized testing settings.
- September 2025: The acquisition by B. Braun of True Digital Surgery completed, advancing its Aesculap AEOS digital surgical microscopy platform. The deal indicates continued investment in digital platforms across medical devices that can influence procurement preferences for integrated, traceable single-use consumables in broader hospital supply chains.
- December 2024: BD announced the expansion of the BetterWay fingertip blood collection and testing system, integrating the BD MiniDraw capillary collection device, into ambulatory care settings across the United States. This expansion supports higher routine consumption of finger-prick consumables and reinforces the shift toward patient-friendly, decentralized blood sampling workflows.


Blood Lancet Market Report Scope and Research Methodology
Market Definition and Coverage
For this methodology, the blood lancet market covers sterile devices used to make a small skin puncture to collect capillary blood for testing in clinical or home settings, and revenue is captured on a value basis across major regions.
Scope exclusions: We exclude lancing devices as reusable holders, glucose meters and strips, and general phlebotomy needles that are designed for venous blood draws.
Segments Covered in This Report
- By Product Type
- Safety Lancets
- Standard / Personal-use Lancets
- By End User
- Hospitals
- Blood Banks
- Diagnostic Laboratories
- Home Care
- Others
- By Application
- Glucose Testing
- Haemoglobin Testing
- Others
- By Geography
- North America
- United States
- Canada
- Mexico
- Europe
- Germany
- United Kingdom
- France
- Italy
- Spain
- Rest of Europe
- Asia-Pacific
- China
- Japan
- India
- Australia
- South Korea
- Rest of Asia-Pacific
- Middle East and Africa
- GCC
- South Africa
- Rest of Middle East and Africa
- South America
- Brazil
- Argentina
- Rest of South America
- North America
Data Sources, Market Sizing, and Validation
Desk Research
Desk research started with public healthcare and device-use signals so the demand pool could be scoped before setting any assumptions. We referenced sources such as the International Diabetes Federation for diabetes prevalence trends, CDC for diabetes and testing behavior indicators, and WHO for broader noncommunicable disease context that affects routine monitoring.
To tighten the regulatory and supply view, we also used sources such as FDA device databases and FDA safety communications, OECD health statistics for utilization direction, and peer-reviewed clinical journals for sampling practices and safety lancet adoption cues. Company annual reports, investor presentations, and credible press releases were used to sense-check product mix shifts and manufacturing scale. Where needed, paid subscriptions were used for company financials and intelligence, news and financials, patent databases, and shipment-level import and export checks. These examples are not exhaustive, and many other public sources were reviewed for data collection, validation, and clarification.
Primary Interviews and Surveys
Primary work focused on interviews and structured surveys with manufacturers, distributors, and healthcare procurement stakeholders, followed by discussions with lab and diabetes care practitioners to validate usage patterns and pricing direction. Coverage was balanced across major regions so that differences in home testing intensity, safety-lancet uptake, and tender-driven purchasing could be captured in the final assumptions.
Distribution of primary research fieldwork respondents
| Company type | Respondent position | Region |
|---|---|---|
| Top tier: 33% | CXOs: 13% | APAC: 45% |
| Mid tier: 52% | Functional/Unit leaders: 33% | EMEA: 36% |
| Smaller Players: 15% | Managers: 54% | Americas: 19% |
Market-Sizing & Forecasting
Sizing began with a top-down build where diabetes monitoring intensity and point-of-care testing activity were translated into a capillary sampling demand pool by region, before unit usage was converted into value through typical selling price bands. Once the demand pool was shaped, it was filtered using practical factors such as self-monitoring frequency, share of users relying on fingerstick sampling, and the mix of safety versus standard lancets used across care settings.
To keep the outcome grounded, selective bottom-up approximations were then used as cross-checks, including roll-ups from a sample of suppliers and distributor channel checks that link average selling price to implied volumes. Key inputs that were tracked include diabetes prevalence trends, home care testing adoption, safety-engineered sharps policies, reimbursement or tender pricing direction in public systems, and regional distribution mix between hospital, lab, and retail channels. Forecasts were built using scenario analysis supported by expert views on price erosion, safety adoption pace, and testing frequency changes, and then smoothed so year-to-year jumps only occur when the drivers also move. Where small players are opaque, gaps were handled by applying region-specific penetration and price bands validated through primary feedback.
Data Validation & Update Cycle
Outputs were validated through triangulation across independent signals, including implied unit demand, pricing bands, and regional healthcare utilization direction, and then reviewed for variance against the historical trajectory. When a number looked off, the driver assumptions were revisited first, followed by re-checking currency timing and the mix split across safety and standard products, before any adjustment was accepted.
A multi-step internal review was used so that calculations, definitions, and assumptions are checked by another analyst before sign-off. If interviews point to a material shift such as a tender reset, a regulatory safety push, or a notable price move, respondents are re-contacted to confirm the change and its timing. The report is refreshed annually, and interim updates are made when major events can materially shift demand or pricing. Before delivery, a fresh pass is completed so clients receive the latest updated view.
Mordor Intelligence's Blood Lancet Market Size Measured Against Other Published Estimates
Published market sizes for blood lancets can look different even when the product sounds the same, because each publisher can pick its own definition, year basis, and pricing logic. Differences also come from how strictly adjacent items are separated, and whether the model leans more on epidemiology-driven demand signals or on broader device baskets.
The spread is usually explained by scope choices and by what gets counted as a lancet, along with how safety-lancet adoption and average selling prices are projected across regions. Some estimates blend the wider lancets market or include lancing devices and other fingerstick accessories, while others focus only on disposable blood lancets and may anchor value on a narrower channel mix or older base years. Currency conversion timing and refresh cadence also matter, because tender repricing and mix shifts can move the value line even when unit usage is stable.
Benchmark comparison
| Source | Market Size | Gaps in Research Methodology |
|---|---|---|
| Mordor Intelligence | USD 2.06 B (2026) | |
| Global Research Publisher A | USD 5.90 B (2024) | This figure reflects a broader lancets category that can include additional lancet types and related blood sampling use cases beyond the narrow blood-lancet definition, and it is anchored to an earlier base year which can widen the gap when mixed with different price assumptions. |
| Industry Data Publisher B | USD 1.41 B (2024) | This estimate is limited to medical disposable blood lancets and is often structured around narrower segment definitions, which can undercount value where safety-lancet mix and premium pricing are higher across clinical channels. |
The table highlights that inclusion rules and base-year choices explain most of the difference, more than any single growth driver. When disposable blood lancets are isolated from adjacent lancet baskets and pricing is tied back to region-level channel mix checks, the range narrows, which is the approach used here by Mordor Intelligence.


Key Questions Answered in the Report
What is the projected value of the Blood lancet market in 2031?
The Blood lancet market is expected to be worth USD 2.92 billion by 2031.
Which product type currently leads sales?
Safety lancets led with 60.74% revenue share in 2025 due to mandatory sharps-injury prevention rules.
Which region is growing fastest?
Asia-Pacific posts the highest growth, advancing at an 8.25% CAGR through 2031.
Why are diagnostic laboratories gaining momentum?
Personalized medicine panels and direct-to-consumer testing push diagnostic laboratories to an 8.12% CAGR, the fastest among end-user groups.
How is technology changing lancet demand?
Painless microneedle innovation and the rise of continuous glucose monitors improve user experience but also create a longer-term substitution threat for conventional lancets.
Page last updated on:


 Your data is secure and never sold or shared.


