Blood Transfusion Devices Market Size and Share
Market Overview
| Study Period | 2020 - 2031 |
|---|---|
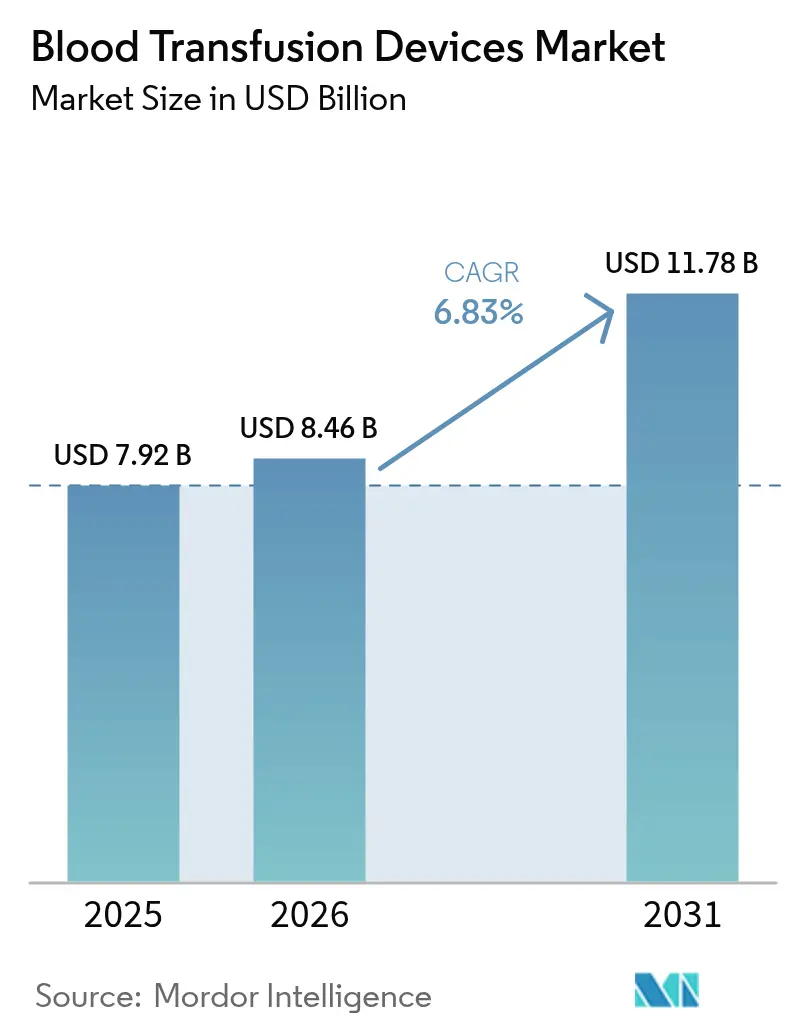
| Market Size (2026) | USD 8.46 Billion |
| Market Size (2031) | USD 11.78 Billion |
| Growth Rate (2026 - 2031) | 6.83% CAGR |
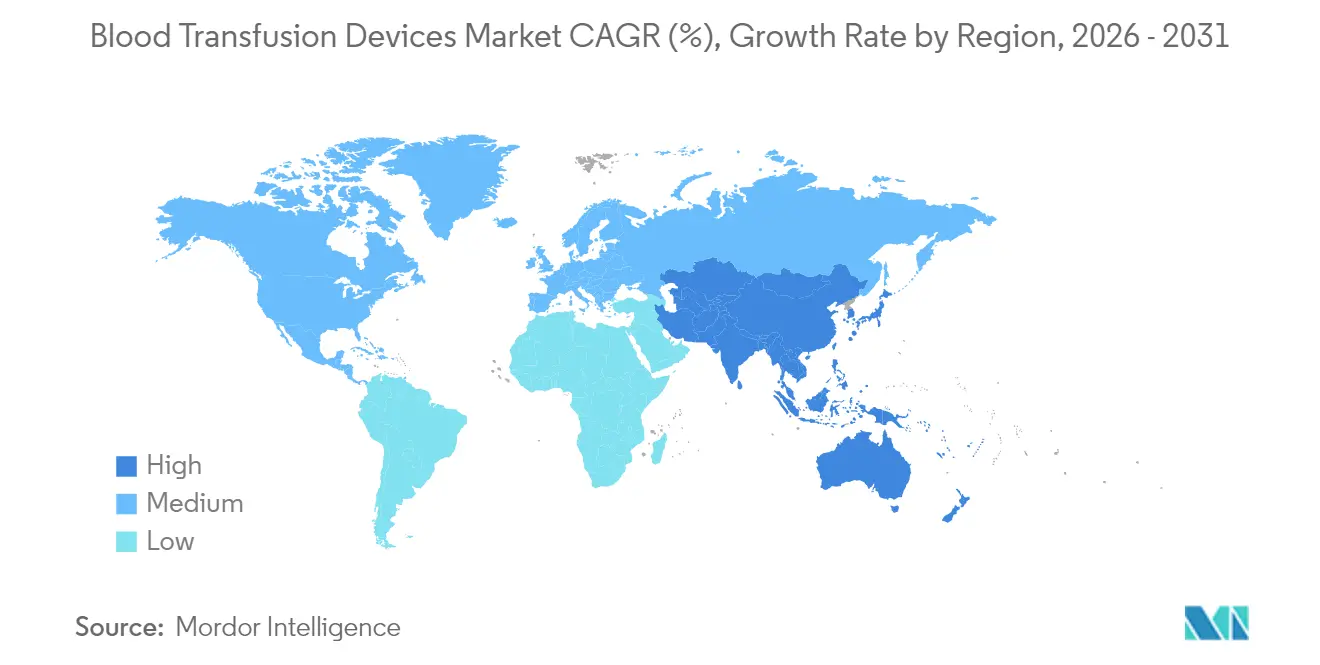
| Fastest Growing Market | Asia Pacific |
| Largest Market | North America |
| Market Concentration | Medium |
Major Players *Disclaimer: Major Players sorted in no particular order Image © Mordor Intelligence. Reuse requires attribution under CC BY 4.0. | |
Blood Transfusion Devices Market Analysis by Mordor Intelligence
Blood transfusion devices market size in 2026 is estimated at USD 8.46 billion, growing from 2025 value of USD 7.92 billion with 2031 projections showing USD 11.78 billion, growing at 6.83% CAGR over 2026-2031. Steady demand arises from higher surgical procedure volumes, a growing burden of hematological disorders, and rapid uptake of pathogen-reduction systems that neutralize emerging pathogens. Digital inventory analytics are lowering wastage, and government-backed blood-safety programs are expanding in emerging economies. Automation is rising as healthcare providers seek labor savings, while patient blood-management initiatives encourage optimized transfusion practices that, in turn, spur equipment upgrades. Although stringent regulations and cold-chain expenses weigh on profitability, industry stakeholders continue launching integrated solutions that enhance safety, efficiency, and traceability across the transfusion workflow.
Key Report Takeaways
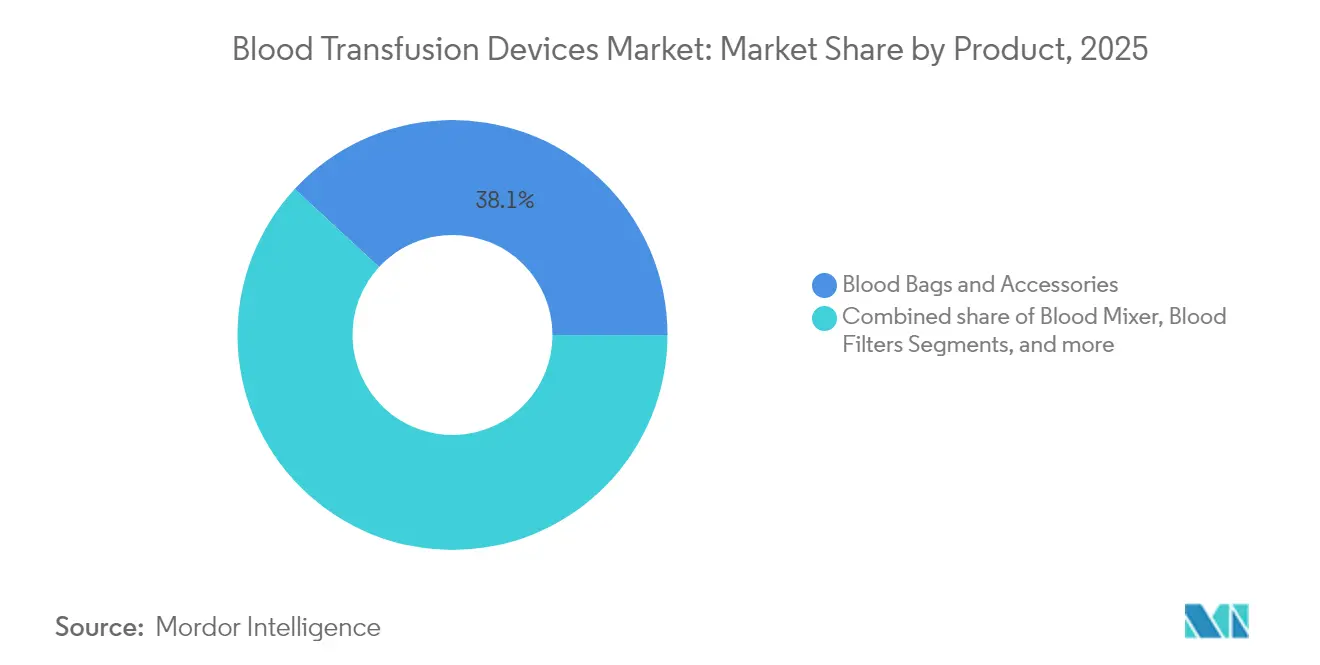
- By product category, Blood Bags & Accessories led with 38.12% of blood transfusion devices market share in 2025, whereas Pathogen Reduction Systems are forecast to advance at a 8.92% CAGR to 2031.
- By technology, Manual/Conventional platforms held 54.10% share of the blood transfusion devices market size in 2025, while Automated/Integrated solutions are projected to expand at 8.41% through 2031.
- By application, Collection accounted for 43.15% of the blood transfusion devices market size in 2025; Transfusion & Administration is growing the fastest at 9.02% CAGR to 2031.
- By end-user, Hospitals captured 47.60% revenue share in 2025; Ambulatory Surgical Centres are set to rise at a 9.88% CAGR between 2026-2031.
- By geography, North America dominated with 40.10% blood transfusion devices market share in 2025, while Asia-Pacific is poised for the quickest growth at an 8.19% CAGR through 2031.
Note: Market size and forecast figures in this report are generated using Mordor Intelligence’s proprietary estimation framework, updated with the latest available data and insights as of 2026.
Global Blood Transfusion Devices Market Trends and Insights
Driver Impact Analysis*
| Driver | % Impact on CAGR Forecast | Geographic Relevance | Impact Timeline |
|---|---|---|---|
| Rising surgical procedure volumes | +1.8% | North America, Europe, global spill-over | Medium term (2-4 years) |
| Growing prevalence of hematological disorders | +1.2% | APAC, emerging markets | Long term (≥ 4 years) |
| Rapid technological advances in transfusion equipment | +1.5% | North America, EU, accelerating APAC | Short term (≤ 2 years) |
| Government support for blood-safety initiatives | +0.9% | APAC core, MEA and Latin America spill-over | Medium term (2-4 years) |
| Deployment of patient blood-management programs | +0.7% | North America, EU, expanding APAC | Medium term (2-4 years) |
| Digital inventory analytics integration | +0.6% | Early adoption in developed markets | Short term (≤ 2 years) |
| Source: Mordor Intelligence | |||
Rising Surgical Procedure Volumes Worldwide
Global surgical demand continues to climb, with the World Health Organization projecting a 25% increase by 2030[1]World Health Organization, “Global Surgery and Blood Safety – 2025 Update,” who.int. Cardiovascular, orthopedic, and oncologic procedures consume the most blood components, making automated processing equipment essential in high-volume hospitals. Terumo’s Reveos system cuts manual steps by 65% and improves component consistency, illustrating how efficiency gains align with rising case loads. Stable procedure growth underpins equipment replacement cycles, though strained donor pools still challenge overall supply chains.
Growing Prevalence of Hematological Disorders
Greater life expectancy and better diagnostics reveal more cases of sickle cell disease, thalassemia, and hematologic cancers. Regular transfusions remain standard therapy, sustaining predictable equipment demand. Novel gene therapies temporarily lift transfusion requirements during pre-conditioning regimens, pushing apheresis device usage upward. Safety concerns for immunocompromised patients further accelerate pathogen-reduction adoption.
Rapid Technological Advancements in Transfusion Equipment
Pathogen-reduction platforms such as INTERCEPT, MIRASOL, and THERAFLEX add a critical layer of safety by inactivating viruses, bacteria, and parasites beyond current screening capabilities. Artificial-intelligence tools optimize inventory, while robotic phlebotomy reaches 87% first-stick accuracy, easing labor shortages[2]AABB, “AI and Robotic Automation in Modern Blood Banking,” aabb.org. Such convergence of automation, analytics, and robotics reshapes equipment expectations toward fully integrated solutions.
Expanding Government Support for Blood-Safety Initiatives in Emerging Markets
China’s “Healthy China 2030” plan underwrites domestic production of advanced collection systems, prompting Terumo to invest USD 15 million in local manufacturing. The EU’s Regulation (EU) 2024/1938 sets harmonized standards that stimulate adoption of next-generation devices across member states[3]European Commission, “Regulation (EU) 2024/1938 on Substances of Human Origin,” ec.europa.eu. Subsidized procurement lowers entry barriers for hospitals in Asia and Latin America, widening the install base for pathogen-reduction and automation platforms.
Restraints Impact Analysis*
| Restraints Impact Analysis | (~) % Impact on CAGR Forecast | Geographic Relevance | Impact Timeline |
|---|---|---|---|
| Stringent regulatory and quality compliance requirements | -1.4% | Global, most pronounced in North America & EU | Long term (≥ 4 years) |
| High operational costs of blood collection and cold chain | -1.1% | Global, particularly challenging in emerging markets | Medium term (2-4 years) |
| Sustainability pressures on PVC-based blood-bag materials | -0.6% | Global, driven by North America & EU regulatory attention | Medium term (2-4 years) |
| Shrinking eligible donor base due to demographic shifts | -0.8% | North America & Europe leading, spill-over to APAC | Long term (≥ 4 years) |
| Source: Mordor Intelligence | |||
Stringent Regulatory and Quality Compliance Requirements
The FDA’s 2025 agenda lists five new blood-component guidances, while Europe’s SoHO rule revamps compliance reporting. The pivot away from DEHP introduces costly material validation cycles. Smaller OEMs face submission expenses topping USD 2 million for complex devices, extending development timelines by up to five years and tilting competitive advantage toward firms with deep regulatory resources.
High Operational Costs of Blood Collection and Cold Chain
Automated processors can cost USD 500,000–2 million per site, a hurdle for mid-sized hospitals. Cold-chain energy accounts for up to 20% of blood-bank budgets, and fuel price shocks since 2022 have lifted distribution costs by 30%. Rural facilities struggle with grid reliability, amplifying wastage from temperature excursions. Staff turnover surpassing 25% in some regions further elevates training costs.
*Our forecasts treat driver/restraint impacts as directional, not additive. The impact forecasts reflect baseline growth, mix effects, and variable interactions.
Segment Analysis
By Product: Pathogen Reduction Systems Drive Safety Innovation
Blood Bags & Accessories led the segment with 38.12% blood transfusion devices market share in 2025, supported by universal demand across collection sites. The blood transfusion devices market size for Blood Bags & Accessories is expected to advance steadily through 2031 as procedure volumes increase. Pathogen-Reduction Systems, posting the quickest 8.92% CAGR, align with regulatory pushes for proactive safety and have now reached over 100 global blood centers.
The segment’s second growth driver involves automated component separators that enhance platelet quality while trimming processing time. Leukoreduction filters are now mandated in most developed markets, creating incremental replacement demand. Blood-warming devices focus on microprocessor accuracy and electronic health-record interoperability, while consumable kits face margin compression due to group-purchasing contracts.


By Technology: Automation Accelerates Despite Manual Dominance
Manual/Conventional platforms retained 54.10% share of the blood transfusion devices market in 2025, reflecting affordability for low-resource settings. Yet Automated/Integrated systems are gaining ground at 8.41% CAGR. The blood transfusion devices market size for Automated/Integrated solutions is rising as labor constraints and error-reduction targets encourage adoption. Terumo’s Reveos illustrates ROI: one device cuts platelet processing steps from 26 to 9 and yields more platelets per donation.
Artificial-intelligence modules embedded in automation suites enable predictive maintenance and quality analytics, reducing downtime. Interfaces that connect with hospital information systems improve traceability reporting and compliance. As funding models evolve, manual devices are expected to persist in lower-volume centers, while automation becomes standard in regional hubs.
By Application: Transfusion & Administration Gains Sophistication
Collection activities accounted for 43.15% share in 2025, anchoring demand for phlebotomy and storage products. The blood transfusion devices market size for Collection equipment should expand steadily with rising procedure counts, though incremental growth is moderating. Transfusion & Administration posts the highest 9.02% CAGR as smart pumps and bedside verification tools gain widespread use.
Integration of barcode and biometric confirmation at the bedside reduces mismatch risks. Processing & Separation benefits from broader use of automated platforms that standardize component quality. Storage & Preservation innovations center on cloud-connected refrigerators that alert staff before temperature deviations, helping to cut wastage.

By End-user: Ambulatory Centres Challenge Hospital Dominance
Hospitals absorbed 47.60% of overall revenue in 2025, a result of complex surgery volumes and in-house blood banks. Ambulatory Surgical Centres, rising at 9.88% CAGR, drive demand for compact, user-friendly devices. The blood transfusion devices industry must therefore tailor product designs to outpatient facilities where space and staffing differ from tertiary hospitals.
Blood banks are consolidating operations to leverage economies of scale, investing in pathogen-reduction and high-throughput separators. Specialty clinics and research labs contribute modest growth as cell therapies expand, requiring precise apheresis and storage capabilities.
Geography Analysis
North America commanded 40.10% of global revenue in 2025 thanks to stringent oversight, early pathogen-reduction adoption, and high per-patient spending. The FDA’s active guidance pipeline shapes global best practice, and suppliers benefit from predictable reimbursement. Yet donor shortages remain acute: the American Red Cross cites a 40% decline over two decades, and extreme weather led to 19,000 canceled drives in 2024 alone. Investment in automated processing and recruitment campaigns aims to stabilize supply.
Asia-Pacific is the fastest-growing region at an 8.19% CAGR through 2031. China’s localization strategy encourages domestic production of advanced systems, while Japan’s artificial-blood trials position the region at the innovation frontier. Rising surgical volumes, expanding insurance coverage, and government-subsidized safety upgrades underpin sustained equipment demand from India to Southeast Asia.
Europe sustains a sizable install base and will implement the SoHO framework by 2027, harmonizing standards and stimulating uptake of DEHP-free bags and pathogen-reduction across member states. Middle East & Africa and South America trail in total revenue but exhibit strong demand fundamentals tied to urbanization and non-communicable disease treatment expansion.

Competitive Landscape
Market rivalry is moderate, with the top six suppliers accounting for about 55% of global revenue. Becton Dickinson leverages its Medication Delivery franchise to bundle collection devices, reporting USD 5.2 billion in Q1 FY2025 revenue. Terumo extends vertically from collection to cell therapy, adding a Global Therapy Innovations unit in late 2024. Haemonetics sharpened its hospital focus by divesting whole-blood assets for USD 67.8 million to GVS in January 2025.
Strategic acquisitions deepen portfolios: BD agreed to split its Biosciences and Diagnostics arm to become a pure-play MedTech vendor, while Teleflex paid EUR 760 million for BIOTRONIK’s vascular line in May 2025. Automation partnerships, such as the 10-year Sanquin–Terumo pact, secure long-term equipment placements and recurring consumables sales. Competitive advantage now hinges on regulatory expertise, digital integration, and the ability to finance multi-year clinical programs needed for next-generation safety technologies.
Blood Transfusion Devices Industry Leaders
Becton Dickinson and Company
Terumo Corporation
Haemonetics Corporation
Grifols SA
Fresenius Kabi AG
- *Disclaimer: Major Players sorted in no particular order

Recent Industry Developments
- May 2025: Merit Medical purchased Biolife for USD 120 million, adding hemostatic technologies to its blood-management line.
- May 2025: Teleflex agreed to acquire BIOTRONIK’s Vascular Intervention business for EUR 760 million to expand its interventional portfolio.
- undefinedFebruary 2025: Haemonetics completed the sale of its whole-blood assets to GVS S.p.A for USD 67.8 million, freeing resources for apheresis expansion.
- October 2024: Terumo BCT introduced the Reveos Automated Blood Processing System in the United States with Blood Centers of America, debuting at Carter BloodCare.


Research Methodology Framework and Report Scope
Market Definitions and Key Coverage
Our study defines the blood transfusion device market as sales of equipment and associated single-use consumables that enable the collection, separation, storage, warming, and intravenous administration of whole blood and blood components in clinical settings worldwide. This includes blood bags and accessories, apheresis systems, blood component separators, mixers, filters, pathogen-reduction units, and transfusion warmers, together with the consumables used in those systems.
Scope Exclusion: diagnostic reagents, cross-matching analyzers, and stand-alone intravenous infusion pumps are excluded.
Segmentation Overview
- By Product
- Blood Bags & Accessories
- Blood Mixer
- Blood Filters
- Blood Component Separator
- Apheresis Device
- Pathogen Reduction System
- Blood & Fluid Warmer
- Blood Collection & Processing Consumables
- Other Products
- By Technology
- Manual / Conventional
- Automated / Integrated
- By Application
- Collection
- Processing & Separation
- Storage & Preservation
- Transfusion & Administration
- By End-user
- Hospitals
- Ambulatory Surgical Centres
- Blood Banks
- Other End-users
- Geography
- North America
- United States
- Canada
- Mexico
- Europe
- Germany
- United Kingdom
- France
- Italy
- Spain
- Rest of Europe
- Asia-Pacific
- China
- Japan
- India
- Australia
- South Korea
- Rest of Asia-Pacific
- Middle East & Africa
- GCC
- South Africa
- Rest of Middle East & Africa
- South America
- Brazil
- Argentina
- Rest of South America
- North America
Detailed Research Methodology and Data Validation
Primary Research
Structured interviews with transfusion service directors, procurement leads at hospitals, regional blood-bank managers, and device distributors across North America, Europe, Asia-Pacific, and key emerging economies test secondary assumptions, uncover average selling prices, and surface adoption hurdles that numbers alone cannot reveal. Follow-up surveys help benchmark usage ratios between manual and automated technologies and probable upgrade cycles.
Desk Research
Mordor analysts first map the universe of devices and users through publicly available sources such as the World Health Organization's Global Observatory on Donation & Transfusion, the US FDA 510(k)/PMA database, Eurostat hospital procedure files, national blood-bank statistics from bodies like NHSBT and the Japanese Red Cross, and trade association yearbooks such as AABB and MedTech Europe. Company 10-Ks, investor decks, customs shipment data from Volza, and tender notices captured via Tenders Info provide additional volume and pricing signals. D&B Hoovers and Dow Jones Factiva are tapped to validate corporate revenue splits. The sources listed are illustrative; many other publications inform the desk phase.
Market-Sizing & Forecasting
A blended top-down demand pool built from national surgical volumes, donation rates, and unit consumption norms is corroborated with selective bottom-up supplier roll-ups of sampled ASP × device shipments to fine-tune totals. Critical variables driving the model include elective surgery growth, trauma incidence, eligible donor pool trends, replacement interval for consumables, and regulatory shifts mandating pathogen reduction. A multivariate regression framework projects these drivers forward, while scenario analysis bounds high and low cases. Data gaps in supplier counts are bridged using weighted regional proxies derived from customs codes and tender awards.
Data Validation & Update Cycle
Outputs pass variance checks against independent indicators, import values, hospital capex data, and donor statistics before a senior review panel signs off. Reports refresh yearly; material events (e.g., pandemic shocks or major recalls) trigger interim updates, and a final pre-release sweep ensures clients receive the latest view.
Why Mordor's Blood Transfusion Devices Baseline Earns Trust
Published estimates often differ because firms choose distinct product baskets, starting years, and inflation paths.
Key gap drivers in this market are divergent inclusion of consumables, varying assumptions on automated system penetration, and the frequency with which exchange rates and donor statistics are refreshed. Mordor's page uses a 2025 anchor year updated in August 2025, counts both devices and their dedicated disposables, and converts local prices with quarterly FX averages, which are then stress-tested through hospital interviews.
Benchmark comparison
| Market Size | Anonymized source | Primary gap driver |
|---|---|---|
| USD 7.92 B (2025) | Mordor Intelligence | - |
| USD 6.04 B (2024) | Regional Consultancy A | Older baseline, excludes pathogen-reduction kits, covers five regions only |
| USD 5.43 B (2025) | Global Consultancy B | Device-only scope; hospital end-users emphasized, blood banks omitted |
| USD 5.45 B (2025) | Trade Journal C | Vendor revenue tallies without adjusting for channel mark-ups or FX fluctuations |
Taken together, the comparison shows that once scope breadth, refresh cadence, and validation depth are equalized, Mordor's 2025 figure stands as the most balanced and reproducible baseline for strategic planning.


Key Questions Answered in the Report
What is the current value of the blood transfusion devices market?
The market generated USD 8.46 billion in 2026 and is forecast to hit USD 11.78 billion by 2031.
Which region is growing the fastest for blood transfusion devices?
Asia-Pacific is set to expand at an 8.19% CAGR through 2031 thanks to healthcare modernization and government safety programs.
Why are pathogen-reduction systems gaining traction?
They inactivate a broad range of pathogens, closing gaps left by traditional screening and supporting stricter safety regulations.
How is automation influencing blood processing?
Automated systems cut manual steps, reduce errors, and integrate with digital inventory tools, driving an 8.41% CAGR for the technology segment.
What challenges limit market growth?
Stringent regulatory compliance, high capital costs for automation and cold chain, and shrinking donor pools pose headwinds to expansion.
Which end-user segment is rising quickest?
Ambulatory Surgical Centres are the fastest-growing customers, posting a 9.88% CAGR as outpatient procedures increase.
Page last updated on:


