
Blood Testing Market Size and Share
Market Overview
| Study Period | 2020 - 2031 |
|---|---|
| Market Size (2026) | USD 103.53 Billion |
| Market Size (2031) | USD 144.80 Billion |
| Growth Rate (2026 - 2031) | 6.94 % |
| Fastest Growing Market | Asia-Pacific |
| Largest Market | North America |
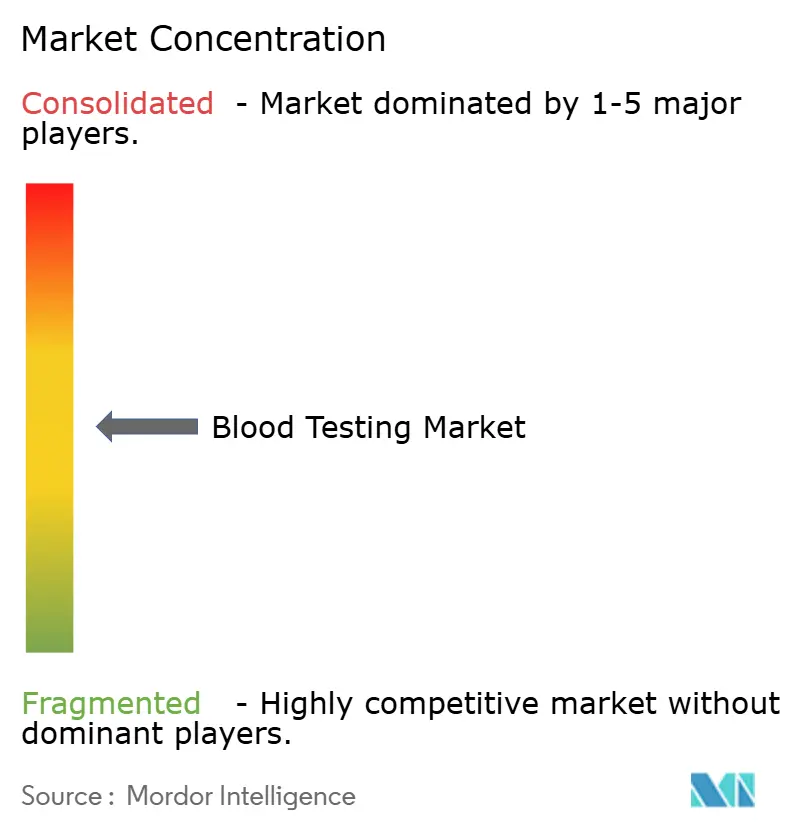
| Market Concentration | Medium |
Major Players *Disclaimer: Major Players sorted in no particular order Image © Mordor Intelligence. Reuse requires attribution under CC BY 4.0. | |
Blood Testing Market Analysis by Mordor Intelligence
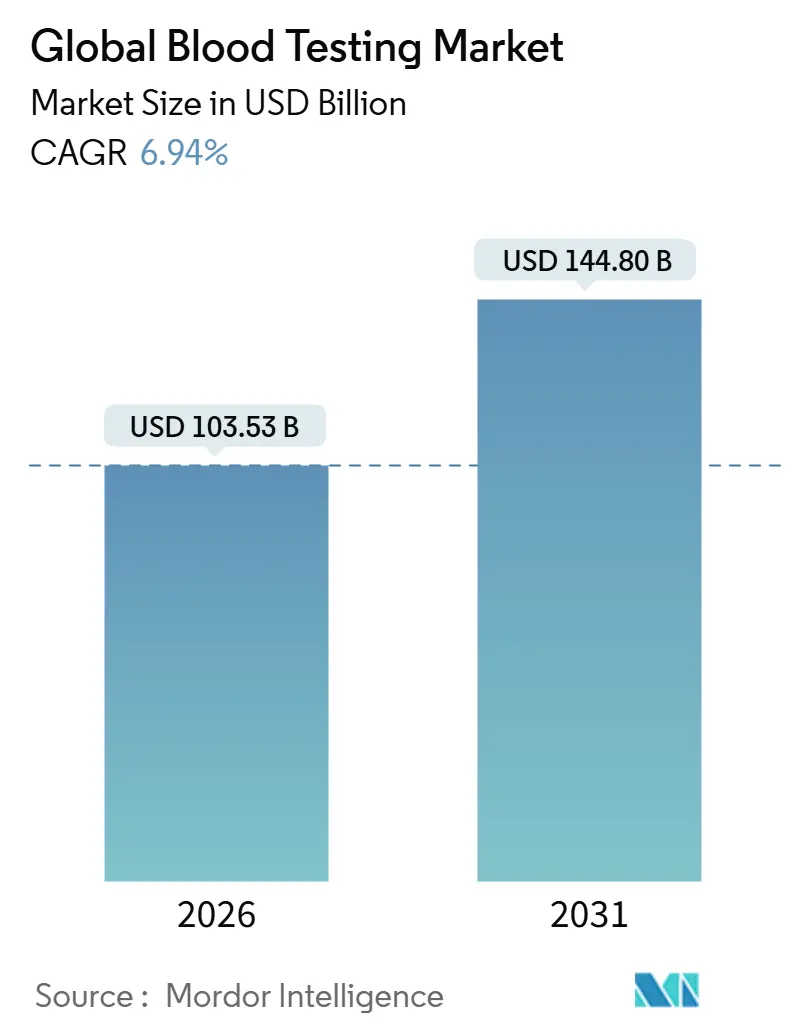
The blood testing market size is expected to reach USD 103.53 billion in 2026 and is forecast to climb to USD 144.80 billion by 2031, advancing at a 6.94% CAGR. Continuous monitoring models, preventive-care guidelines, and the reclassification of laboratory-developed tests as regulated medical devices are realigning investment toward integrated analyzers and regulatory compliance [1]U.S. Food and Drug Administration, “Laboratory Developed Tests,” FDA.gov. Aging populations, a steep rise in chronic diseases, and global screening mandates keep routine panels at the center of hospital and reference-laboratory menus. Simultaneously, rapid test automation and point-of-care (POC) innovation compress turnaround times, improve triage workflows, and open revenue streams outside the central laboratory. Platform consolidation continues as laboratories standardize on vendor ecosystems that embed middleware, reflex algorithms, and bidirectional electronic-health-record (EHR) connectivity, hedging against workforce shortages and shrinking reimbursement schedules.
Key Report Takeaways
- By test type, glucose assays retained 29.5% of the blood testing market share in 2025, while infectious-disease serology posted the fastest 8.12% CAGR through 2031 on the back of WHO hepatitis-elimination targets.
- By product, consumables generated 55.4% of 2025 revenue, yet instruments are on track for a 7.21% CAGR through 2031 as hospitals upgrade to integrated chemistry-immunoassay platforms.
- By technology, in 2025, molecular diagnostics held a dominant 45.4% share of the blood testing market, while immunoassays surged ahead with the fastest CAGR of 7.44%, projected through 2031.
- By end user, diagnostic laboratories contributed 57.5% of 2025 spending, but hospital demand is rising at a 7.69% CAGR as emergency departments adopt high-sensitivity troponin and lactate POC assays.
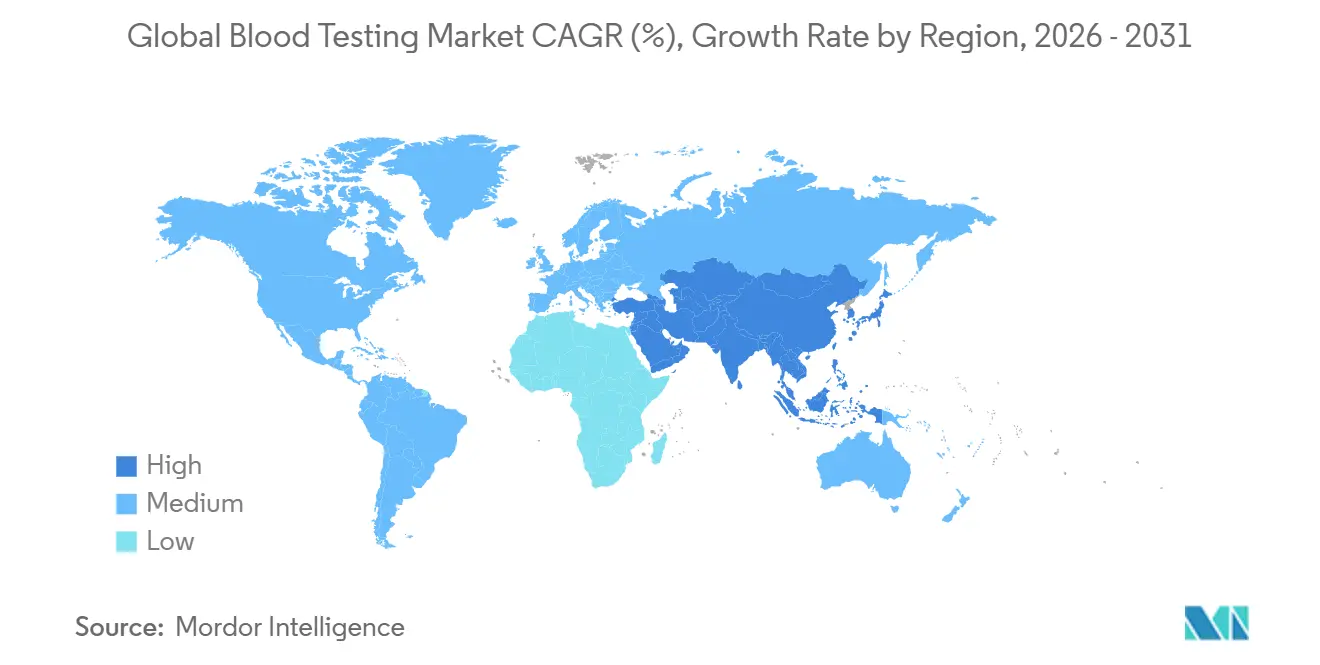
- By geography, North America captured 43.6% in 2025, whereas Asia-Pacific is set to rise at an 8.54% CAGR, the fastest regional pace.
Note: Market size and forecast figures in this report are generated using Mordor Intelligence’s proprietary estimation framework, updated with the latest available data and insights as of January 2026.
Market Trends and Insights
Drivers Impact Analysis of Blood Testing Market*
| Driver | (∼) % Impact on CAGR Forecast | Geographic Relevance | Impact Timeline |
|---|---|---|---|
| Rising chronic-disease burden | +1.8% | Global; highest in North America, Europe, urban APAC | Long term (≥ 4 years) |
| Rapid automation & POC analyzer innovation | +1.5% | North America, Europe, GCC; emerging APAC | Medium term (2-4 years) |
| Government-funded screening programs | +1.2% | China, India, Saudi Arabia, UAE, selected EU states | Medium term (2-4 years) |
| Lab reflex-testing algorithms | +0.9% | North America, Western Europe; APAC pilots | Short term (≤ 2 years) |
| Home micro-sampling & DIY phlebotomy kits | +0.7% | North America, Europe | Short term (≤ 2 years) |
| AI-driven decision support on lab datasets | +0.6% | United States, selected European health systems | Medium term (2-4 years) |
| Source: Mordor Intelligence | |||
Rising Chronic-Disease Burden Fueling Routine & Preventive Blood Panels
Cardiovascular disease, diabetes, and chronic kidney disease affect 1.5 billion people and prompt recurring lipid, hemoglobin A1c, and creatinine testing in annual checkups [2]U.S. Preventive Services Task Force, “Statin Use for the Primary Prevention of Cardiovascular Disease,” USPSTF.org. The 2024 USPSTF update expanded lipid-panel eligibility to every adult 40-75 years, widening U.S. screening by 20 million lives. Diabetes prevalence hit 537 million adults in 2024 and could reach 783 million by 2045, locking in annual glucose and A1c demand. These routine panels stabilize laboratory volumes even when discretionary testing softens, although tighter bundled-payment contracts now cap margins, prompting more reliance on high-throughput automation.
Rapid Automation & Point-of-Care Analyzer Innovation
FDA clearance of Beckman Coulter’s DxC 500i in March 2025 delivered a 400-test-per-hour platform sized for community hospitals. Abbott gained January 2025 clearance for a high-sensitivity troponin I assay on its handheld i-STAT, enabling 15-minute myocardial-infarction rule-out at the bedside. Sysmex secured CLIA-waived status for its XW-100 hematology analyzer, allowing physician offices to run complete blood counts without a technologist. While POC devices accelerate care, reagent costs run 40-60% higher than central-lab equivalents, challenging cost-sensitive sites.
Government-Funded Screening & Early-Diagnosis Programs
China’s Healthy China 2030 mandates annual exams for 400 million urban workers, propelling double-digit domestic analyzer shipments. India’s Ayushman Bharat program applies national reimbursements to routine panels for 550 million beneficiaries but settles claims in 90-120 days, pressuring small-lab liquidity. Saudi Arabia earmarked USD 64 billion under Vision 2030 for diagnostic hubs capable of 50,000 daily samples. State contracts ensure baseline volumes yet impose price ceilings that favor vertically integrated suppliers.
Lab Reflex-Testing Algorithms Reducing Reagent Waste
A 2024 academic-medical-center study showed automated reflex protocols cut repeat complete blood counts 15%, saving USD 180,000 annually. Vendors now embed configurable rule sets into middleware, but adoption clusters in health systems with dedicated informatics teams. Smaller laboratories lacking IT depth still rely on manual reviews, escalating overtime costs.
Restraints Impact Analysis of Blood Testing Market*
| Restraint | (∼) % Impact on CAGR Forecast | Geographic Relevance | Impact Timeline |
|---|---|---|---|
| Stringent multi-region regulatory approvals | -0.8% | Global, acute in EU and China | Long term (≥ 4 years) |
| High capex & consumable costs for analyzers | -0.6% | North America, Europe, urban APAC | Medium term (2-4 years) |
| Shortage of trained laboratory technologists | -0.5% | North America, Europe, Japan | Long term (≥ 4 years) |
| Data-privacy compliance hurdles | -0.3% | North America (HIPAA), Europe (GDPR) | Short term (≤ 2 years) |
| Source: Mordor Intelligence | |||
Stringent Multi-Region Regulatory Approvals
EU-IVDR reclassified thousands of assays, yet only four notified bodies were designated by end-2024, creating approval bottlenecks and shifting R&D budgets toward high-volume panels. FDA’s May 2024 LDT rule now imposes USD 500,000–2 million validation costs per analyte and 12–24-month timelines, raising barriers for hospital-developed tests. China’s NMPA demands multi-center trials enrolling 200–500 patients, stretching approvals to 30 months.
High Capex & Consumable Costs for Next-Gen Analyzers
Mid-throughput chemistry systems list at USD 100,000–250,000, while full laboratory automation tops USD 2–5 million, restricting adoption to centers running more than 500,000 tests a year. Reagent-rental contracts shift costs from capex to operating budgets but lock institutions into proprietary chemistries 15–25% above open channels and levy steep early-termination penalties.
*Our forecasts treat driver/restraint impacts as directional, not additive. The impact forecasts reflect baseline growth, mix effects, and variable interactions.
Blood Testing Market Segment Analysis
By Test Type:
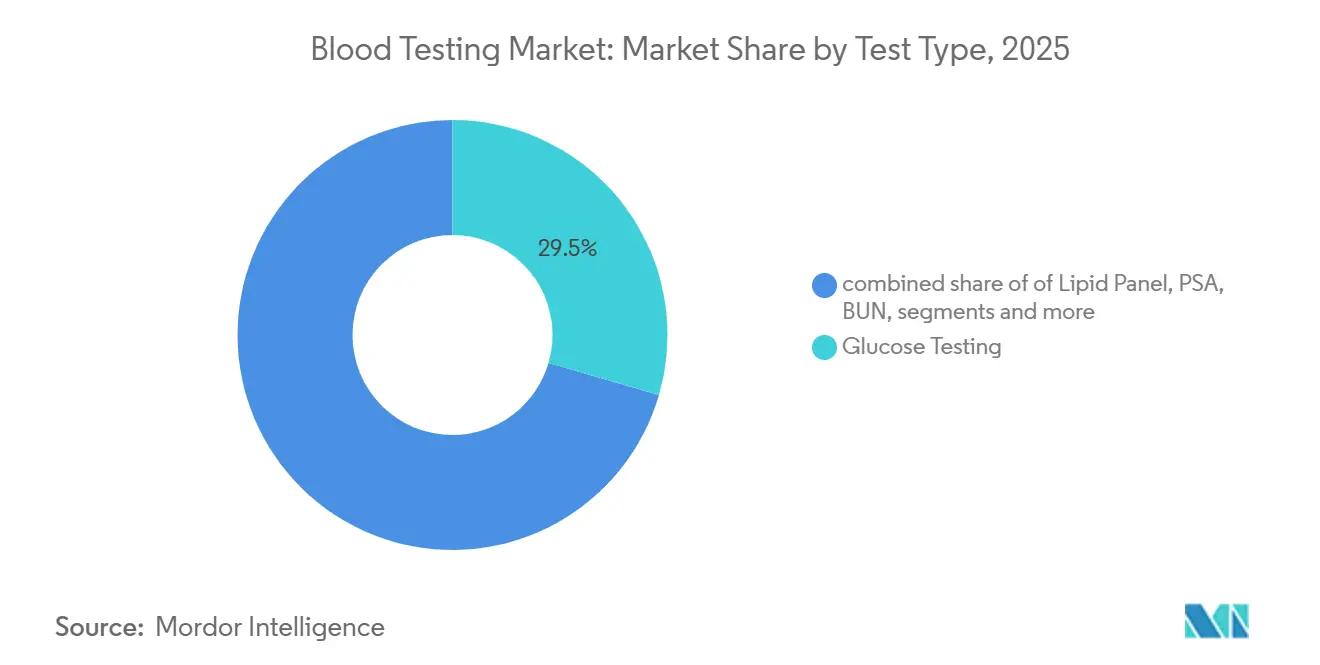
Infectious-Disease Serology Outpaces Glucose Amid WHO TargetsInfectious-disease serology is projected to post the fastest 8.12% CAGR through 2031 as the WHO pushes 90% hepatitis C diagnosis by 2030 and rapid HIV self-tests gain approval across sub-Saharan Africa. Conversely, glucose assays still held the largest blood testing market share at 29.5% in 2025, supported by 537 million individuals with diabetes. The arrival of over-the-counter continuous glucose monitors, including Dexcom’s Stelo cleared in March 2024, will gradually divert insulin-treated patients away from episodic finger-stick testing[3]Dexcom, “Stelo OTC Continuous Glucose Monitor,” FDA.gov. Lipid panels benefit from 2024 USPSTF guidelines recommending five-year screening intervals, yet retail pharmacy offerings fragment demand. PSA volumes soften as shared-decision guidelines curb annual screening, while BUN and creatinine remain stable due to chronic kidney disease prevalence. TSH and vitamin D utilization face payer scrutiny, trimming low-yield preventive orders, whereas hs-CRP retains a niche in cardiology risk stratification.
Demand diversity underscores a structural pivot from single-analyte orders to algorithm-guided panels that optimize reagent spend and clinical value. Laboratories that bundle serology, glucose, and lipid assays into preventive-care panels achieve higher throughput and amortize analyzer investments over more billable units. As the blood testing market size for infectious-disease serology climbs, platform vendors that broaden antigen libraries and develop multiplex rapid cards will seize share in public-health tenders. Meanwhile, growth in self-monitoring technologies shifts revenue from central labs to retail channels, signaling a gradual tilt in the blood testing market toward decentralized ecosystems.



By Product:
Consumables Dominate, Instruments AccelerateConsumables represented 55.4% of 2025 revenue, consistent with laboratories’ recurring reagent spend and the ubiquity of BD Vacutainer tubes, which hold an estimated significant global share. Shrinking fee schedules drive laboratories to negotiate high-volume reagent contracts and adopt reflex logic that trims low-yield follow-ons. Yet instruments are set for a 7.21% CAGR through 2031 as facilities replace aging analyzers with integrated chemistry-immunoassay platforms that automate pre-analytic sorting and barcode verification. Such upgrades lower error rates, shorten turnaround, and alleviate technologist shortages.
Capital budgets favor analyzers that run open channels and support middleware interoperability. The blood testing market size for instruments further expands as point-of-care devices penetrate ambulatory and emergency settings, despite higher per-test reagent costs. Total laboratory automation remains a premium niche but gains traction among academic centers processing more than 1 million annual tests, where 30–40% labor savings justify USD 2–5 million outlays. Overall, suppliers that bundle instrument placements with reagent-rental models lock in multi-year consumable cash flows, reinforcing consumables’ revenue dominance even as instrument volumes rise.
By Technology:
Molecular Diagnostics Dominates, Immunoassay AcceleratesMolecular diagnostics generated 45.4% of the blood testing market share in 2025, illustrating how the blood testing market size is shifting toward genomic-level insight that extends well beyond traditional PCR respiratory panels. Liquid-biopsy assays that profile circulating tumor DNA now allow oncologists to track minimal residual disease from a single tube of blood, transforming the sample from a metabolic snapshot into a continuous genomic surveillance tool. Cepheid’s GeneXpert processed 23 million test cartridges in 2024, with tuberculosis and HIV viral-load panels making up 60% of volume in sub-Saharan Africa and South Asia where point-of-care systems bypass cold-chain limits and skilled-technologist shortages.
In the United States, Abbott’s ID NOW rapid PCR network reached 18,000 physician offices and urgent-care clinics by 2024, delivering influenza and strep results in 13 minutes and cutting unnecessary antibiotic use by roughly one-quarter. Immunoassay technology, led by high-sensitivity troponin I and expanding thyroid, fertility, and tumor-marker menus, is projected to advance at a 7.44% CAGR to 2031, the fastest pace among technologies as emergency departments compress myocardial-infarction rule-out protocols from three hours to one hour and outpatient wellness programs monetize consumer demand for hormone and cancer-risk insight.

By End User:
Hospitals Narrow the Gap with Diagnostics LaboratoriesDiagnostics laboratories accounted for 57.5% of 2025 spending as Quest Diagnostics, LabCorp, and Sonic Healthcare centralize routine panels and esoteric tests. Quest alone handled 165 million requisitions in 2024 through 2,200 sites. Hospital laboratories, however, are gaining ground with a 7.69% CAGR to 2031. Emergency-department protocols relying on high-sensitivity troponin, lactate, and blood-gas POC analyzers shrink door-to-decision times from hours to minutes, reducing admissions and boosting bed turnover.
Hospitals also monetize outpatient phlebotomy clinics and capture send-out leakage by insourcing high-volume chemistry and immunoassay panels as analyzer footprints shrink. Meanwhile, thousands of physician offices, urgent-care sites, and retail pharmacies adopt CLIA-waived devices, fragmenting low-volume testing. Although this “other” segment grows appreciably, its dispersed nature yields limited bargaining power, keeping reagent costs elevated. Over the forecast, hospital consolidation and the deployment of middleware that routes tests dynamically between in-house labs and reference partners will rebalance volumes across segments, reshaping competitive dynamics in the blood testing market.
Geography Analysis
North America Blood Testing Market
North America held 43.6% of global 2025 revenue, propelled by Medicare coverage for preventive panels and the outsized scale of Quest Diagnostics and LabCorp. U.S. laboratories processed 14 billion tests in 2024 for USD 85 billion but face Clinical Laboratory Fee Schedule cuts averaging 8% on 20 high-volume assays, compressing margins. A workforce deficit looms: 70% of labs reported staffing shortages in 2023, and BLS projects just 11% technologist employment growth through 2033, below retirement-replacement needs. Canada centralizes routine testing into provincial hubs, saving cost but extending outpatient turnaround to 24-48 hours.
APAC Blood Testing Market
Asia-Pacific is the fastest-growing region at an 8.54% CAGR. China’s Healthy China 2030 policy mandates annual exams for 400 million workers, stimulating demand for Mindray, Autobio, and Maccura analyzers priced 20–30% below multinationals. India’s Ayushman Bharat covers 550 million lives, yet 90-day claim lags strain small labs. Japan’s super-aged population fuels lipid and kidney-function testing, but government price ceilings trimmed lab reimbursement by 5–7% in 2024, motivating automation investment.
EMEA and South America Blood Testing Market
Europe balances IVDR transition hurdles with budget caps that restrict spending growth to 1–2% annually. Germany’s 8,000 lab sites consolidated rapidly after a 6% fee cut in 2024, while the U.K. experienced a three-week service disruption in June 2024 when a ransomware attack hit Synnovis, prompting NHS cybersecurity mandates. France’s price-scheduled lab networks invest heavily in automation to maintain 8–12% margins. Gulf Cooperation Council states allocate oil-backed budgets to diagnostic hubs—Saudi Arabia alone earmarked USD 64 billion whereas sub-Saharan Africa relies heavily on donor programs for HIV and malaria testing, leaving the blood testing industry underpenetrated by commercial labs. South America’s middle-class expansion lifts demand, but currency volatility and inconsistent regulations deter multinationals, enabling regional chains such as Dasa and Chopo to dominate through localized cash-pay models.

Regulatory Landscape
Regulatory oversight for blood testing is tightening around high-risk IVDs and digital decision support, with notable regional divergence. In the European Union, IVDR implementation continues to add external scrutiny for Class D devices through EU Reference Laboratories (EURLs), which began independent performance verification and batch testing for initial Class D categories from October 1, 2024. Additional EURL verification requirements took effect on May 1, 2026 under Commission Implementing Regulation (EU) 2025/2526 for certain parasite infection markers and blood grouping markers, increasing documentation and verification work for manufacturers supplying transfusion-related and infectious disease assays.
In the United States, FDA device quality and listing requirements remain a central compliance anchor for IVD manufacturers, alongside the Quality Management System Regulation (QMSR), which became effective February 2, 2026 and aligns device quality requirements more closely with ISO 13485 concepts. The FDA also set May 6, 2026 as a compliance milestone for establishment registration and device listing requirements for most IVDs manufactured by laboratories. In Great Britain, MHRA guidance and the UK Government consultation on Common Specifications for Class D IVDs point to continued alignment efforts for high-risk assays, including proposals to amend the UK MDR 2002 and remove the Coronavirus Test Device Approvals (CTDA) process as the market transitions away from pandemic-era pathways.
Competitive Landscape
The blood testing market remains moderately fragmented: Roche Diagnostics, Abbott Laboratories, Siemens Healthineers, Danaher (Beckman Coulter), and Sysmex together control the majority of the revenue. Roche’s cobas and Abbott’s Alinity platforms lock customers into reagent-rental agreements that guarantee multiyear consumable streams. DiaSorin leverages infectious-disease serology strengths to win public-health tenders where assay breadth outranks platform uniformity.
Mindray’s dominant hospital share in China illustrates how localized service, spare-parts proximity, and 30% price discounts unsettle incumbents, a blueprint Indian manufacturer Transasia now exports across South Asia. Patent filings for dried-blood-spot stabilization climbed 35% from 2023-2025, reflecting R&D momentum even as reimbursement remains unsettled.
Private-equity consolidation accelerated: U.S. deals in 2024-2025 aggregated independent labs to enhance payer-contract clout. By 2030, a significant share of the United States testing volume could reside with the top 10 operators. Yet regional specialists in serology, genetic testing, and rapid POC remain acquisition targets, ensuring a dynamic deal pipeline over the forecast.
Blood Testing Industry Leaders
F.Hoffman La Roche
Abbott Laboratories
Siemens Healthineers
Danaher Corporation
Sysmex
- *Disclaimer: Major Players sorted in no particular order
Blood Testing Market Companies Covered in this Report
- Abbott Laboratories
- Beckton Dickinson
- bioMérieux
- Bio-Rad Laboratories
- Cepheid
- Danaher (-Beckman Coulter)
- DiaSorin
- Roche
- Grifols
- Hologic
- Laboratory Corp of America
- Mindray Medical
- Ortho Clinical Diagnostics
- PerkinElmer (-Revvity)
- Quest Diagnostics
- QuidelOrtho
- Siemens Healthineers
- Sysmex
- Thermo Fisher Scientific
- Trinity Biotech

Market Opportunities and Future Outlook
Regulatory-driven modernization and acute-care turnaround-time demands are expanding whitespace for automated sample-to-answer systems in high-volume hospital and reference lab workflows. A near-term commercialization proof point is FDA 510(k) clearance activity in 2026 for blood-testing systems and assays that broaden routine and specialty menus, including the BD BACTEC FXI Culture System cleared in June 2026 to automate vial loading and detection for bloodstream infection diagnostics and improve time-to-detection versus prior models. That outcome supports purchasing strategies that favor standardized automation to manage staffing constraints and to reduce manual steps in microbiology and critical-care pathways.
Opportunities are also emerging around algorithm-enabled and decentralized blood testing workflows that connect instruments, middleware, and clinical decision support. Roche's May 2026 launch of the Liver Disease Panel with a certified LiverPRO algorithm underscores a shift from single-analyte reporting toward integrated biomarker-plus-software offerings deployable across routine chemistry and immunoassay footprints. In parallel, device and microfluidics research momentum in centrifuge-free plasma separation and compact point-of-care sample processing is reinforcing product roadmaps aimed at moving more testing into emergency departments, physician offices, and outpatient settings where CLIA-waived and rapid systems reduce reliance on central laboratory capacity.
Recent Industry Developments in Blood Testing Market
- July 2026: Roche received CE Mark for a blood test designed to identify tuberculosis infection. The approval expands Roche's infectious disease blood testing portfolio in Europe and supports laboratories that are standardizing on cobas-linked assay menus for high-throughput deployment.
- June 2025: Abbott obtained FDA 510(k) clearance for the Alinity i Rubella IgG assay. The clearance strengthens the infectious disease and serology menu on the Alinity i platform, reinforcing the value of installed-base expansion through incremental assay additions.
- March 2024: Dexcom received FDA clearance for Stelo, an over-the-counter continuous glucose monitor. Broader OTC access accelerates decentralization of glucose monitoring and shifts a portion of diabetes testing activity away from episodic lab-based finger-stick style testing toward continuous sensing ecosystems.


Blood Testing Market Report Scope and Research Methodology
Market Definition and Coverage
For this study, the blood testing market is defined as revenues generated from blood-based diagnostic tests, along with the instruments, reagents, and related testing workflows used to generate and report results across care settings.
Scope exclusions: We exclude non-blood specimens (such as urine, saliva, and tissue) and standalone therapeutic procedures that do not include a diagnostic blood test result.
Segments Covered in This Report
- By Test Type
- Glucose
- Lipid Panel
- PSA
- BUN
- TSH
- Infectious-Disease Serology
- Vitamin D
- High-sensitivity CRP
- By Product
- Instruments
- Consumables (Kits, Reagents and others)
- By Technology
- Clinical Chemistry
- Molecular Diagnostics
- Immunoassay
- Others
- By End User
- Diagnostics Laboratories
- Hospitals
- Others
- By Geography
- North America
- United States
- Canada
- Mexico
- South America
- Brazil
- Argentina
- Rest of South America
- Europe
- Germany
- United Kingdom
- France
- Italy
- Spain
- Rest of Europe
- Asia-Pacific
- China
- Japan
- India
- South Korea
- Australia
- Rest of APAC
- Middle East and Africa
- GCC
- South Africa
- Rest of MEA
- North America
Data Sources, Market Sizing, and Validation
Desk Research
Desk research was used to set the market context and build clean starting assumptions before interviews were run. We reviewed public health statistics and screening guidance from sources such as the CDC and NIH, and we also used WHO and OECD health indicators to sense-check testing intensity across regions.
On the supply side, we leaned on FDA communications for diagnostic and laboratory policy shifts, alongside peer-reviewed clinical journals for test adoption patterns and assay migration trends. Company annual reports, investor presentations, and reputable press were used to map typical product revenue splits and pricing direction. For specific company-level financial signals and patent activity, paid subscriptions for company financial intelligence, news and financials, and patent databases were referenced selectively. The sources listed here are illustrative only, and many other public references were also checked for data collection, validation, and clarification.
Primary Interviews and Surveys
Primary work focused on validating what share of testing volume sits in routine panels versus specialized assays, and how procurement and utilization differ by site of care. We spoke with a mix of diagnostic labs, hospital labs, point-of-care program leads, and distributor or channel specialists across major regions, so gaps from desk research could be closed and pricing and volume assumptions could be confirmed.
Distribution of primary research fieldwork respondents
| Company type | Respondent position | Region |
|---|---|---|
| Top tier: 29% | CXOs: 14% | APAC: 49% |
| Mid tier: 56% | Functional/Unit leaders: 32% | EMEA: 31% |
| Smaller Players: 15% | Managers: 54% | Americas: 20% |
Market-Sizing & Forecasting
Sizing was built using both top-down and bottom-up logic, with the top-down path anchored on healthcare activity signals that reconstruct the test demand pool by geography and care setting. We then translated those demand pools into value using a practical mix of test-mix shares, average tests per encounter where relevant, and an average selling price ladder that separates instrument-related revenue from recurring consumables.
To keep totals realistic, selective bottom-up checks were then used, such as sampled supplier revenue roll-ups, channel checks on analyzer placements, and ASP x volume approximations for high-volume routine panels. Where bottom-up data was incomplete, for example for smaller labs or fragmented outpatient testing, we filled gaps using penetration assumptions that were validated through interviews and then rechecked against public utilization signals.
Key model inputs included: chronic disease testing intensity (diabetes and lipid monitoring as recurring drivers), aging population share as a proxy for routine panel frequency, point-of-care adoption and decentralization rates, automation and middleware uptake that affects throughput, and regulatory policy signals that can shift test menus and lab-developed test conversion. Forecasting relied on scenario analysis supported by expert consensus on how these variables move together over time, and the scenario outputs were smoothed to avoid unrealistic year-to-year jumps.
Data Validation & Update Cycle
Validation was done in layers so the final number stayed consistent with observable market behavior. We compared the modeled totals against independent indicators like diagnostic utilization direction, instrument placement momentum, and broad healthcare spend signals, then reviewed any large variance at the country and region level before sign-off.
During review, outliers were traced back to the exact assumption that created them, which was then adjusted or defended with a supporting reference or interview input. If a material change was spotted, such as a major reimbursement shift or a notable policy update, follow-up calls were triggered to confirm the impact on volumes and pricing. Reports are refreshed annually, and we also do interim updates for material events, followed by a final pre-delivery pass so clients receive the latest updated view.
Mordor Intelligence's Blood Testing Market Estimate Compared With Other Published Estimates
Published blood testing market numbers can look far apart, even when they seem to talk about the same thing, because the counted revenue streams and the time base are not always aligned. Differences also show up when one study leans more on reported company revenues and another leans more on utilization proxies, and the gap widens further when pricing is treated in a simple way.
Some published figures appear to extend into broader diagnostics and adjacent specimen categories, and a few also pull forward aggressive pricing and test frequency assumptions based on peak years. In Mordor Intelligence, totals are limited to blood-based testing revenues and are built from test demand signals and care setting mix, and then validated using instrument placement and consumables run-rate checks so the pricing curve does not overstate growth in routine panels.
Benchmark comparison
| Source | Market Size | Gaps in Research Methodology |
|---|---|---|
| Mordor Intelligence | USD 103.53 B (2026) | |
| Global Consultancy A | USD 104.00 B (2025) | Uses a 2024 base with a 2025 value and may blend in wider diagnostics revenue lines and faster ASP expansion, which can inflate near-term totals when routine panels dominate volume. |
| Industry Publisher B | USD 104.40 B (2024) | Anchors on a 2024 snapshot and extends a long forecast window with broad test lists, and it does not clearly show how instrument versus consumable revenue is separated year to year. |
The spread is mainly explained by year selection and how tightly the model sticks to blood-only testing revenues, plus how transparently pricing and test mix are carried through the forecast. When scope, currency timing, and the instrument-to-consumables split are kept consistent, the resulting market size becomes easier to trace and repeat in future updates.


Key Questions Answered in the Report
How big is the Global Blood Testing Market?
The blood testing market size is expected to reach USD 103.53 billion in 2026 and is projected to grow at a 6.94% CAGR to USD 144.80 billion by 2031.
Which test type is expanding the fastest?
Infectious-disease serology leads growth with an 8.12% CAGR through 2031, spurred by hepatitis and HIV screening goals.
Why are hospitals increasing onsite blood-testing capacity?
Emergency-department adoption of high-sensitivity troponin and lactate POC assays reduces decision times and drives a 7.69% CAGR for hospital laboratories.
How will new FDA rules affect laboratory-developed tests?
The May 2024 rule subjects LDTs to 510(k) review, adding USD 0.5–2 million validation costs per analyte and extending approval timelines by up to two years.
Which regions will post the highest growth?
Asia-Pacific will register the fastest regional expansion at an 8.54% CAGR, led by large-scale screening initiatives in China and India.
How fragmented is supplier competition?
The top five players hold a majority of revenue, indicating moderate consolidation with significant room for regional and niche competitors.
Page last updated on:


 Your data is secure and never sold or shared.


