
Barley Market Size and Share
Barley Market Analysis by Mordor Intelligence
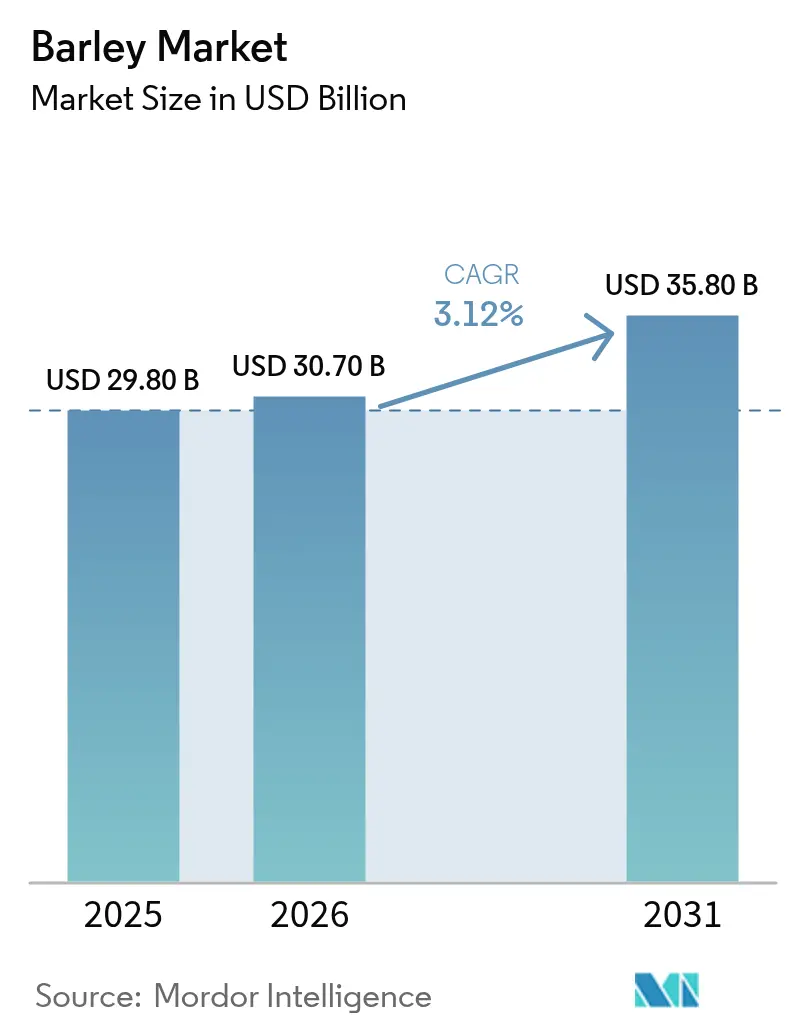
The barley market size was valued at USD 28.9 billion in 2025 and estimated to grow from USD 30.70 billion in 2026 to reach USD 35.80 billion by 2031, at a CAGR of 3.12% during the forecast period (2026-2031). Asia Pacific has recorded a significant growth rate because craft-beer demand in China and expanding feed-barley imports counterbalance corn price volatility. Feed barley continues to anchor volume, although specialty hull-less and high beta-glucan cultivars advance at more than double the overall growth rate as food processors seek higher extraction yields and cholesterol-health claims. Government programs that subsidize climate-resilient cereals and carbon-credit schemes priced at USD 15 to USD 30 per metric ton of carbon dioxide equivalent offer growers alternative revenue streams that stabilize returns during commodity price swings.
Key Report Takeaways
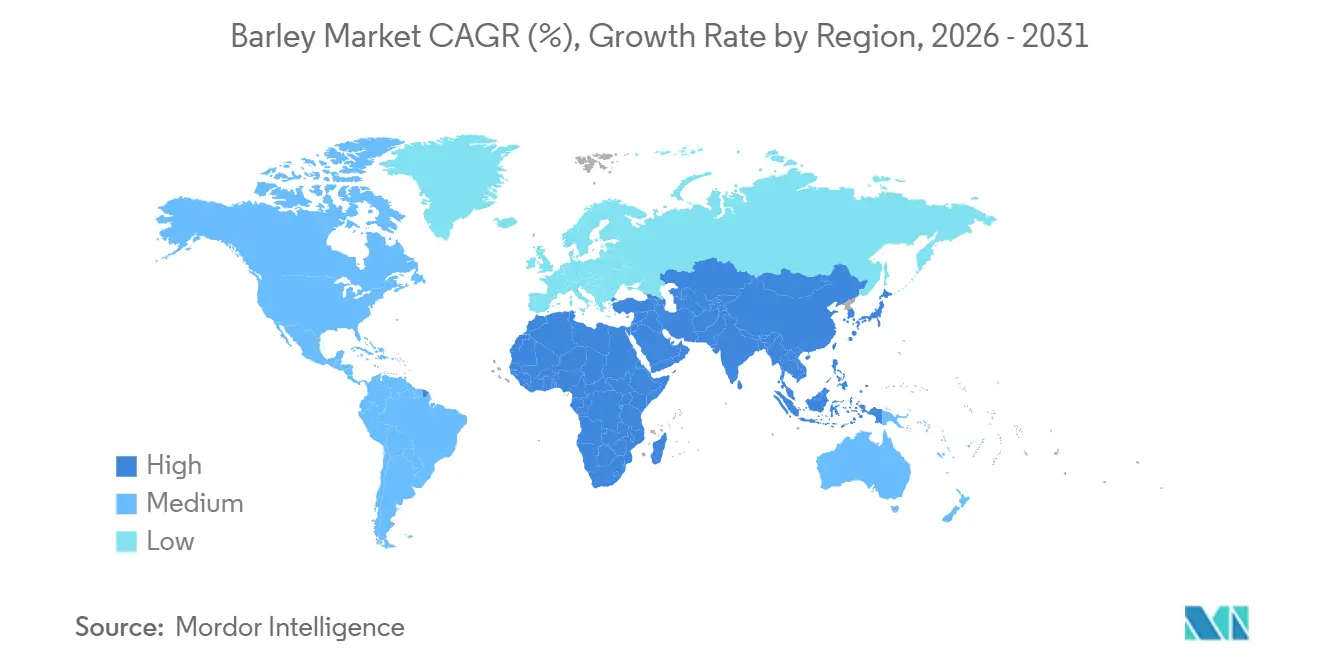
- By geography, Europe led with a 34.8% share of the barley market in 2025, while Asia Pacific records the highest regional CAGR at 4.5% to 2031
Note: Market size and forecast figures in this report are generated using Mordor Intelligence’s proprietary estimation framework, updated with the latest available data and insights as of 2026.
Global Barley Market Trends and Insights
Drivers Impact Analysis*
| Driver | (~) % Impact on CAGR Forecast | Geographic Relevance | Impact Timeline |
|---|---|---|---|
| Expanding craft-beer demand from emerging economies | + 0.5% | Global, with concentration in Asia-Pacific and spillover to the Middle East and Africa | Medium term (2-4 years) |
| Growing usage in animal feed rations | + 0.6% | Global, particularly North America and Europe, during high-corn-price cycles | Short term (≤ 2 years) |
| Government incentives for climate-resilient cereals | + 0.4% | Global, strongest in the Middle East, Africa, and South Asia | Long term (≥ 4 years) |
| Increasing adoption of genome-edited hull-less barley | + 0.3% | Asia-Pacific and North America, with early regulatory approvals | Medium term (2-4 years) |
| Rising demand for beta-glucan fortified functional foods | + 0.4% | Global, led by Asia-Pacific and North America, health-conscious segments | Medium term (2-4 years) |
| Carbon-credit revenue streams for low-input barley rotations | + 0.2% | North America and Europe, with emerging adoption in Oceania | Long term (≥ 4 years) |
| Source: Mordor Intelligence | |||
Expanding Craft-Beer Demand from Emerging Economies
Microbrewery proliferation in China boosted craft-beer sales from USD 971 million in 2023 to a projected USD 1.5 billion by 2028, prompting maltsters to source higher-protein barley varieties outside domestic feed channels [1]. India, backed by rising disposable incomes in Bangalore and Pune, imports specialty malt to meet the needs of new brewpubs that lack access to consistent local grain. United Arab Emirates licensing reforms add incremental volumes that require malt with 11.5% to 13% protein, a specification typically available only from Canadian and Australian exporters. These shifting flows tighten supply for traditional buyers in Europe during peak contract windows. The premiumization trend is underappreciated because aggregated beer output masks the shift toward higher-value styles. Contract clauses now mandate enzyme activity thresholds and carry premiums of USD 50 to USD 80 per metric ton over feed grades.
Growing Usage in Animal Feed Rations
Corn price spikes during 2024 drought conditions in the United States prompted feed formulators to raise barley inclusion from 15% to 30%, with enzyme supplementation bridging digestibility gaps and saving USD 20 to USD 40 per metric ton of finished ration [2]. Western Canada, where barley is the dominant feed grain, benefited from logistics proximity that allowed rapid shifts in train loadouts bound for beef feedlots. Similar patterns emerged in Australia as drought-tolerant barley varieties cushioned sorghum shortfalls during El Nino years. This counter-cyclical demand profile provides grain traders a natural hedge that balances exposure to corn markets. The cyclical substitution underscores the importance of maintaining adequate feed barley carryout stocks in exportable surplus regions such as Canada.
Government Incentives for Climate-Resilient Cereals
The United States Department of Agriculture allocated USD 3.1 billion to 141 climate-smart projects in 2024 and 2025, several of which compensate growers for water savings when rotating barley after corn. Australia’s Future Drought Fund disbursed AUD 39.7 million (USD 26 million) toward drought-resilient barley cultivars that enhance root architecture to maintain yields in semi-arid zones [3]. The United Kingdom offers GBP 596 (USD 755) per hectare per year for rotations that include barley and sequester soil carbon under Environmental Land Management schemes. These incentives alter planting intentions in Morocco, Iran, and Ethiopia, where food security considerations outweigh export ambitions. The subsidy impact surfaces in acreage only after two to three seasons because growers wait for program rules to stabilize.
Increasing Adoption of Genome-Edited Hull-Less Barley
Clustered Regularly Interspaced Short Palindromic Repeats (CRISPR)-Cas9 edits to the nud gene raise extraction rates to 92% to 95% compared to 65% to 70% for hulled lines, lowering milling costs by USD 30 to USD 50 per metric ton for breakfast cereal processors. Additional edits that reduce haze-forming proteins improve malting quality and help microbreweries meet clarity standards without the need for filtration additives. Regulatory approvals in the United States and Japan treat such lines as non-genetically modified organisms if no foreign DNA is present, accelerating commercialization. Europe lags because Directive 2001/18/EC subjects genome editing to strict approval pathways that extend timelines by five years or more. Early adopters in North America expect cost advantages that could erode Europe’s traditional leadership in premium malt barley.
Restraints Impact Analysis*
| Restraint | (~) % Impact on CAGR Forecast | Geographic Relevance | Impact Timeline |
|---|---|---|---|
| Volatile global commodity price cycles | -0.7% | Global, with acute impacts in import-dependent Middle East and Africa | Short term (≤ 2 years) |
| Agronomic challenges related to soil salinity, pests, and lodging | -0.5% | Global, most severe in Africa, the Middle East, and South Asia | Medium term (2-4 years) |
| Competition from alternative gluten-free grains | -0.3% | Global, concentrated in the Asia-Pacific and North America food segments | Medium term (2-4 years) |
| Climate-change-driven water scarcity in semi-arid belts | -0.6% | Middle East, North Africa, and South Asia | Long term (≥ 4 years) |
| Source: Mordor Intelligence | |||
Volatile Global Commodity Price Cycles
Barley traded between USD 4.50 and USD 6.50 per bushel from 2020 to 2024, and the narrowing of export pipelines during harvest peaks compounded logistics costs for maltsters that rely on predictable basis differentials. Chicago Mercantile Exchange feed-barley futures remain thin with open interest below 5,000 contracts, a scale too small for medium-sized feed mills that cannot weather large margin calls. Currency depreciation in Egypt and Nigeria raised landed costs by 30% to 40% during the same period, negating nominal price declines. Investment in dedicated malting plants slows because feasibility studies assume stability in raw material costs over 7 to 10 years. Risk-averse investors instead upgrade multipurpose facilities that switch between wheat and barley, reducing specialized capacity expansion.
Agronomic Challenges Related to Soil Salinity, Pests, and Lodging
Soil salinity affects about one-fifth of irrigated barley acreage worldwide, lowering yields by up to 50% as sodium inhibits water uptake and creates osmotic stress. The Russian wheat aphid and barley yellow dwarf virus collectively reduce potential output by 5% to 10% each season, with documented cases of insecticide resistance in Australia and Argentina. Lodging risk increases when nitrogen rates exceed recommended thresholds, especially in wet springs, leading to higher kernel moisture that disqualifies malting lots with moisture above 13.5%. Extension services in many African and South Asian regions lack precision agriculture tools, leaving growers dependent on broad recommendations that fail to match site-specific conditions. Yield variability discourages investment in certified seed and modern agronomy, perpetuating a performance gap.
*Our forecasts treat driver/restraint impacts as directional, not additive. The impact forecasts reflect baseline growth, mix effects, and variable interactions.
Geography Analysis
Europe commanded 34.8% of the barley market share in 2025, reflecting the region’s integrated malting and brewing infrastructure and dense grain-elevator network. Robust logistics connect French and German production hubs to more than 4,000 breweries, ensuring reliable demand and premium pricing for protein-optimized lots. Asia Pacific is projected to advance at a 4.5% CAGR through 2031 as Chinese craft brewers, Japanese maltsters, and Indian feed buyers widen import programs to secure quality supply. Rising disposable incomes and dietary shifts toward premium beer and animal protein reinforce these two regions' leadership in shaping global trade flows.
North America leverages efficient rail and port assets that funnel Canadian and United States grain to Asian buyers, while domestic feedlots adopt barley in rations when corn prices spike. Middle Eastern and African importers, led by Saudi Arabia and Morocco, rely on government tenders to stabilize feed costs and support the expansion of dairy and poultry sectors. South American exporters, especially Argentina, capitalize on counter-seasonal harvests to fill Northern Hemisphere supply gaps despite volatile freight spreads. Oceania, anchored by Australia, remains a pivotal supplier of high-enzyme malting barley that meets stringent quality protocols in Japan and South Korea.
Looking ahead, subsidy programs that reward climate-resilient cereals are anticipated to contribute growing acreage toward barley in water-stressed zones across North America, Europe, and South Asia, along with infrastructure upgrades at Canadian ports. Ongoing tariff liberalization between Australia and China and infrastructure upgrades at Canadian ports will streamline bulk and containerized shipments, reducing transit times for premium malt. Investments in genome-edited cultivars and blockchain traceability platforms should help regions differentiate on quality rather than volume, attracting food and beverage processors that pay sustainability premiums. Collectively, these regional dynamics are set to widen participation in the barley trade and underpin steady expansion of the global market during the forecast horizon.
Regulatory Landscape
Barley trade and import compliance is shaped by tariff administration and phytosanitary and contaminants controls, which vary by destination market. In Canada, barley and barley products are administered under tariff rate quotas. The 2025-2026 TRQ levels are set at 399,000 tonnes for barley and 19,131 tonnes for barley products (grain equivalent), and the Import Control List was updated effective July 1, 2026 to align Within Access Commitment and Over Access Commitment coding following implementation of the CBSA Assessment and Revenue Management (CARM) system.
In the European Union, market access is governed by plant health and food safety frameworks that affect both grain and seed movements. EU plant-health requirements under Regulation (EU) 2016/2031 continue to drive pest-risk management, while the European Commission adopted Implementing Regulation (EU) 2026/1110 in May 2026 to set specific exemptions for certain seeds from measures aimed at preventing regulated non-quarantine pests. For food and feed uses, contaminant limits under EU rules (including the consolidated framework based on Regulation (EU) 2023/915) shape testing, segregation, and documentation needs across the supply chain.
Value Chain Analysis
The barley value chain runs from input suppliers (seed developers, fertilizer and crop protection providers) to farm production, aggregation (country elevators, cooperatives, and merchant silos), primary processing (malting, pearling, milling), and finally end users in feed, brewing and distilling, and food ingredients. Upstream genetics and certified seed availability have become more strategic as hull-less and malting-quality traits command premiums, and consolidation in breeding portfolios, such as RAGT integrating Syngenta's malting barley seed assets, supports faster commercialization and broader regional placement.
Midstream logistics and quality assurance are critical cost and risk points because barley is routinely segregated by protein, germination, and mycotoxin thresholds for malting versus feed. Weather-driven quality variability remains a recurring disruptor. In the United States, North Dakota faced elevated DON risk in 2025 that constrained malting-grade supply, while in the United Kingdom, the 2025 harvest saw high screenings reported by Simpsons Malt (up to 30% in some areas), diverting volumes from malting to feed. Supply balances and sourcing behavior also shift by origin, highlighted by record-low seeded area in the United States in 2025 (2.30 million acres), alongside stronger Canadian output in Western Canada (about 9.448 million tonnes, up 20% year over year), which reinforces the role of Canadian export channels and diversified procurement for both maltsters and feed compounders.
Competitive Landscape
The top five grain merchants hold the majority of global barley revenues, underscoring a moderately concentrated market structure. Cargill Incorporated uses an integrated origination, storage, and malting network to capture value from the farm gate to the brewery, and recently invested USD 120 million in its Victoria malting plant to add 150,000 metric tons of capacity. Archer Daniels Midland Company pairs barley sourcing with its oilseed and corn portfolios, offering bundled feed solutions that deepen ties with large livestock integrators. Both enterprises leverage proprietary trading platforms and port terminals to optimize freight spreads and secure long-term supply contracts.
Louis Dreyfus Company concentrates on export logistics, acquiring a 60% stake in a Moroccan processor that positions it near fast-growing North African feed markets. Viterra Limited, now aligned with Bunge, upgraded its Regina terminal with optical sorters that isolate protein bands preferred by Japanese maltsters, improving contract compliance and margin capture. Olam International differentiates through blockchain traceability for organic and sustainability certified loads, winning accounts with European brewers subject to due diligence mandates. Regional specialists such as Sunrise Foods International and Compac S.A. service organic and niche segments that larger merchants find hard to segregate profitably.
Forward plans point to deeper vertical integration and digitalization across the leading firms. Genome edited seed licensing, carbon credit aggregation, and Internet of Things sensor networks are being piloted to create premium tiers based on quality and verified sustainability. Expansion of malting capacity in Australia, terminal upgrades in Canada, and tariff liberalization between China and Australia will shorten supply chains and lower delivery risk. These moves are anto enlarge addressable demand, improve pricing power, and keep competitive dynamics in flux through the forecast period.
Market Opportunities and Future Outlook
Opportunities are emerging at the intersection of sustainability reporting, localized malting capacity, and higher-value barley specifications. Brewer and maltster programs that quantify and reduce on-farm emissions create room for identity-preserved supply and service models, such as the American Malting Barley Association's Baselining Barley project launched in May 2025 to track greenhouse-gas emissions, soil health, and water quality using farm records. This framework supports premium procurement for customers with scope-3 disclosure needs and encourages growers and grain handlers to invest in measurement, segregation, and traceability.
Processing and sourcing localization is also creating new demand nodes for malting barley and tighter integration with growers. In India, United Breweries Limited and Soufflet Malt announced a partnership in February 2026 to build a 110,000-tonne per year malthouse in South Rajasthan, and AB InBev India communicated plans to procure over 16,000 tons of domestically grown barley in 2026. Together, these announcements point to more structured domestic procurement channels for malting-grade barley. Regulatory acceptance of genome-edited barley as non-GMO in markets such as the United States and Japan (when no foreign DNA is present) also lowers pathway friction for hull-less and quality-enhancing edits. In parallel, agronomy improvements validated in field research, including integrated soil amendment and bio-stimulant approaches reported in 2026 studies, support the case for yield and quality stability in stress-prone production zones.
Recent Industry Developments
- July 2026: Anheuser-Busch announced a USD 4 million investment in its Idaho Falls operations and provided a research grant to the University of Idaho focused on barley agronomy. The move reinforces domestic supply-chain support around a key barley-producing region and links operational upgrades with applied research aimed at improving on-farm outcomes relevant to malting and feed quality.
- June 2026: The Ethiopian Agricultural Research Institute (EIAR) signed a memorandum of understanding with Asella Malt Factory, Gondar Malt Factory, Soufflet, and Boortmalt to collaborate on research and development of improved malt barley varieties. The partnership formalizes an industry-research pipeline intended to expand reliable local malt barley supply and reduce reliance on imported malt or barley in a fast-developing brewing ecosystem.
- May 2024: The United States Department of Agriculture allocated climate-smart agriculture funding across a portfolio of projects that includes practices compensating growers for water savings and low-input rotations where barley is used after corn. This program-level support strengthens the business case for barley within climate-resilient crop plans and connects agronomic practices to measurable outcomes needed for sustainability-linked procurement.
Research Methodology Framework and Report Scope
Market Definition and Coverage
For this study, the barley market is measured as the value of raw barley grain at the first point of commercial sale, across key uses such as feed, malting, food, and seed, and aggregated at a global level.
Scope exclusions: Processed barley derivatives and byproducts (such as malt extracts, beta-glucan concentrates, and brewer's spent grain) are not counted in this market value.
Segmentation Overview
- Geography
- North America
- United States
- Production Analysis (Area Harvested, Yield, and Production Volume)
- Consumption Analysis (Consumption Value and Volume)
- Import Market Analysis (Import Value, Volume, and Key Supplying Markets)
- Export Market Analysis (Export Value, Volume, and Key Destination Markets)
- Wholesale Price Trend Analysis and Forecast
- Regulatory Framework
- List of Key Players
- Logistics and Infrastructure
- Seasonality Analysis
- Canada
- Production Analysis (Area Harvested, Yield, and Production Volume)
- Consumption Analysis (Consumption Value and Volume)
- Import Market Analysis (Import Value, Volume, and Key Supplying Markets)
- Export Market Analysis (Export Value, Volume, and Key Destination Markets)
- Wholesale Price Trend Analysis and Forecast
- Regulatory Framework
- List of Key Players
- Logistics and Infrastructure
- Seasonality Analysis
- Mexico
- Production Analysis (Area Harvested, Yield, and Production Volume)
- Consumption Analysis (Consumption Value and Volume)
- Import Market Analysis (Import Value, Volume, and Key Supplying Markets)
- Export Market Analysis (Export Value, Volume, and Key Destination Markets)
- Wholesale Price Trend Analysis and Forecast
- Regulatory Framework
- List of Key Players
- Logistics and Infrastructure
- Seasonality Analysis
- United States
- Europe
- Germany
- Production Analysis (Area Harvested, Yield, and Production Volume)
- Consumption Analysis (Consumption Value and Volume)
- Import Market Analysis (Import Value, Volume, and Key Supplying Markets)
- Export Market Analysis (Export Value, Volume, and Key Destination Markets)
- Wholesale Price Trend Analysis and Forecast
- Regulatory Framework
- List of Key Players
- Logistics and Infrastructure
- Seasonality Analysis
- France
- Production Analysis (Area Harvested, Yield, and Production Volume)
- Consumption Analysis (Consumption Value and Volume)
- Import Market Analysis (Import Value, Volume, and Key Supplying Markets)
- Export Market Analysis (Export Value, Volume, and Key Destination Markets)
- Wholesale Price Trend Analysis and Forecast
- Regulatory Framework
- List of Key Players
- Logistics and Infrastructure
- Seasonality Analysis
- Russia
- Production Analysis (Area Harvested, Yield, and Production Volume)
- Consumption Analysis (Consumption Value and Volume)
- Import Market Analysis (Import Value, Volume, and Key Supplying Markets)
- Export Market Analysis (Export Value, Volume, and Key Destination Markets)
- Wholesale Price Trend Analysis and Forecast
- Regulatory Framework
- List of Key Players
- Logistics and Infrastructure
- Seasonality Analysis
- Spain
- Production Analysis (Area Harvested, Yield, and Production Volume)
- Consumption Analysis (Consumption Value and Volume)
- Import Market Analysis (Import Value, Volume, and Key Supplying Markets)
- Export Market Analysis (Export Value, Volume, and Key Destination Markets)
- Wholesale Price Trend Analysis and Forecast
- Regulatory Framework
- List of Key Players
- Logistics and Infrastructure
- Seasonality Analysis
- Ukraine
- Production Analysis (Area Harvested, Yield, and Production Volume)
- Consumption Analysis (Consumption Value and Volume)
- Import Market Analysis (Import Value, Volume, and Key Supplying Markets)
- Export Market Analysis (Export Value, Volume, and Key Destination Markets)
- Wholesale Price Trend Analysis and Forecast
- Regulatory Framework
- List of Key Players
- Logistics and Infrastructure
- Seasonality Analysis
- Germany
- Asia-Pacific
- China
- Production Analysis (Area Harvested, Yield, and Production Volume)
- Consumption Analysis (Consumption Value and Volume)
- Import Market Analysis (Import Value, Volume, and Key Supplying Markets)
- Export Market Analysis (Export Value, Volume, and Key Destination Markets)
- Wholesale Price Trend Analysis and Forecast
- Regulatory Framework
- List of Key Players
- Logistics and Infrastructure
- Seasonality Analysis
- Australia
- Production Analysis (Area Harvested, Yield, and Production Volume)
- Consumption Analysis (Consumption Value and Volume)
- Import Market Analysis (Import Value, Volume, and Key Supplying Markets)
- Export Market Analysis (Export Value, Volume, and Key Destination Markets)
- Wholesale Price Trend Analysis and Forecast
- Regulatory Framework
- List of Key Players
- Logistics and Infrastructure
- Seasonality Analysis
- India
- Production Analysis (Area Harvested, Yield, and Production Volume)
- Consumption Analysis (Consumption Value and Volume)
- Import Market Analysis (Import Value, Volume, and Key Supplying Markets)
- Export Market Analysis (Export Value, Volume, and Key Destination Markets)
- Wholesale Price Trend Analysis and Forecast
- Regulatory Framework
- List of Key Players
- Logistics and Infrastructure
- Seasonality Analysis
- Pakistan
- Production Analysis (Area Harvested, Yield, and Production Volume)
- Consumption Analysis (Consumption Value and Volume)
- Import Market Analysis (Import Value, Volume, and Key Supplying Markets)
- Export Market Analysis (Export Value, Volume, and Key Destination Markets)
- Wholesale Price Trend Analysis and Forecast
- Regulatory Framework
- List of Key Players
- Logistics and Infrastructure
- Seasonality Analysis
- New Zealand
- Production Analysis (Area Harvested, Yield, and Production Volume)
- Consumption Analysis (Consumption Value and Volume)
- Import Market Analysis (Import Value, Volume, and Key Supplying Markets)
- Export Market Analysis (Export Value, Volume, and Key Destination Markets)
- Wholesale Price Trend Analysis and Forecast
- Regulatory Framework
- List of Key Players
- Logistics and Infrastructure
- Seasonality Analysis
- Japan
- Production Analysis (Area Harvested, Yield, and Production Volume)
- Consumption Analysis (Consumption Value and Volume)
- Import Market Analysis (Import Value, Volume, and Key Supplying Markets)
- Export Market Analysis (Export Value, Volume, and Key Destination Markets)
- Wholesale Price Trend Analysis and Forecast
- Regulatory Framework
- List of Key Players
- Logistics and Infrastructure
- Seasonality Analysis
- China
- South America
- Brazil
- Production Analysis (Area Harvested, Yield, and Production Volume)
- Consumption Analysis (Consumption Value and Volume)
- Import Market Analysis (Import Value, Volume, and Key Supplying Markets)
- Export Market Analysis (Export Value, Volume, and Key Destination Markets)
- Wholesale Price Trend Analysis and Forecast
- Regulatory Framework
- List of Key Players
- Logistics and Infrastructure
- Seasonality Analysis
- Argentina
- Production Analysis (Area Harvested, Yield, and Production Volume)
- Consumption Analysis (Consumption Value and Volume)
- Import Market Analysis (Import Value, Volume, and Key Supplying Markets)
- Export Market Analysis (Export Value, Volume, and Key Destination Markets)
- Wholesale Price Trend Analysis and Forecast
- Regulatory Framework
- List of Key Players
- Logistics and Infrastructure
- Seasonality Analysis
- Brazil
- Middle East
- Saudi Arabia
- Production Analysis (Area Harvested, Yield, and Production Volume)
- Consumption Analysis (Consumption Value and Volume)
- Import Market Analysis (Import Value, Volume, and Key Supplying Markets)
- Export Market Analysis (Export Value, Volume, and Key Destination Markets)
- Wholesale Price Trend Analysis and Forecast
- Regulatory Framework
- List of Key Players
- Logistics and Infrastructure
- Seasonality Analysis
- Turkey
- Production Analysis (Area Harvested, Yield, and Production Volume)
- Consumption Analysis (Consumption Value and Volume)
- Import Market Analysis (Import Value, Volume, and Key Supplying Markets)
- Export Market Analysis (Export Value, Volume, and Key Destination Markets)
- Wholesale Price Trend Analysis and Forecast
- Regulatory Framework
- List of Key Players
- Logistics and Infrastructure
- Seasonality Analysis
- Iran
- Production Analysis (Area Harvested, Yield, and Production Volume)
- Consumption Analysis (Consumption Value and Volume)
- Import Market Analysis (Import Value, Volume, and Key Supplying Markets)
- Export Market Analysis (Export Value, Volume, and Key Destination Markets)
- Wholesale Price Trend Analysis and Forecast
- Regulatory Framework
- List of Key Players
- Logistics and Infrastructure
- Seasonality Analysis
- United Arab Emirates
- Production Analysis (Area Harvested, Yield, and Production Volume)
- Consumption Analysis (Consumption Value and Volume)
- Import Market Analysis (Import Value, Volume, and Key Supplying Markets)
- Export Market Analysis (Export Value, Volume, and Key Destination Markets)
- Wholesale Price Trend Analysis and Forecast
- Regulatory Framework
- List of Key Players
- Logistics and Infrastructure
- Seasonality Analysis
- Saudi Arabia
- Africa
- Morocco
- Production Analysis (Area Harvested, Yield, and Production Volume)
- Consumption Analysis (Consumption Value and Volume)
- Import Market Analysis (Import Value, Volume, and Key Supplying Markets)
- Export Market Analysis (Export Value, Volume, and Key Destination Markets)
- Wholesale Price Trend Analysis and Forecast
- Regulatory Framework
- List of Key Players
- Logistics and Infrastructure
- Seasonality Analysis
- Ethiopia
- Production Analysis (Area Harvested, Yield, and Production Volume)
- Consumption Analysis (Consumption Value and Volume)
- Import Market Analysis (Import Value, Volume, and Key Supplying Markets)
- Export Market Analysis (Export Value, Volume, and Key Destination Markets)
- Wholesale Price Trend Analysis and Forecast
- Regulatory Framework
- List of Key Players
- Logistics and Infrastructure
- Seasonality Analysis
- South Africa
- Production Analysis (Area Harvested, Yield, and Production Volume)
- Consumption Analysis (Consumption Value and Volume)
- Import Market Analysis (Import Value, Volume, and Key Supplying Markets)
- Export Market Analysis (Export Value, Volume, and Key Destination Markets)
- Wholesale Price Trend Analysis and Forecast
- Regulatory Framework
- List of Key Players
- Logistics and Infrastructure
- Seasonality Analysis
- Nigeria
- Production Analysis (Area Harvested, Yield, and Production Volume)
- Consumption Analysis (Consumption Value and Volume)
- Import Market Analysis (Import Value, Volume, and Key Supplying Markets)
- Export Market Analysis (Export Value, Volume, and Key Destination Markets)
- Wholesale Price Trend Analysis and Forecast
- Regulatory Framework
- List of Key Players
- Logistics and Infrastructure
- Seasonality Analysis
- Morocco
- North America
Data Sources, Market Sizing, and Validation
Desk Research
Desk work starts with building a dependable fact base for barley supply, trade, and pricing, and then mapping those indicators into the market definition used for this report. We relied on public statistics and reference series such as FAOSTAT for crop production and yields, USDA and Eurostat releases for grains balance sheets and trade, UN Comtrade for customs flows, and national agriculture ministries for area, procurement, and policy updates.
Along with these, we reviewed company filings and investor presentations for large grain handlers and malt-related participants to track how contracts and realized pricing are described. We also used reputable press and exchange commentary to understand price movements and seasonality. To reduce gaps where public data is delayed or aggregated, we used paid subscriptions for company financials and intelligence, shipment-level import and export visibility, and patent databases to spot process changes that may shift demand. The sources named above are illustrative rather than exhaustive, and many other public and paid references were used for collection, cross-checking, and clarification.
Primary Interviews and Surveys
Primary work was used to pressure test the desk assumptions, especially around commercial pricing behavior, contract timing, and how much barley is channeled into feed versus malting in different crop years. We spoke with a mix of growers and cooperatives, grain traders, processors, and downstream buyers across APAC, EMEA, and the Americas, and then aligned inputs so regional trade patterns and harvest variability were reflected consistently.
Distribution of primary research fieldwork respondents
| Company type | Respondent position | Region |
|---|---|---|
| Top tier: 37% | CXOs: 16% | APAC: 45% |
| Mid tier: 43% | Functional/Unit leaders: 32% | EMEA: 32% |
| Smaller Players: 20% | Managers: 52% | Americas: 23% |
Market-Sizing & Forecasting
Sizing is built using a top-down and bottom-up approach, where production, trade, and carryover signals are reconstructed into an annual value pool, and then aligned to the first-sale pricing point that the market definition requires. For each major geography, we translate volumes into value using observable pricing references and crop-year context, and then adjust for typical quality and usage mix when needed to keep the price assumption realistic.
To keep the totals honest, we corroborate results with selective bottom-up approximations, such as sampled supplier and trader revenue checks and channel conversations on average realized prices, and we run volume sanity checks against malting demand and feed substitution behavior. Inputs that most often move the model include harvested area and yield trends, stock-to-use changes, import and export flows, weather-linked supply shocks, and indicative farmgate or wholesale barley prices. Where a bottom-up trail is incomplete for smaller producing countries, we use trade mirror statistics and regional yield benchmarks before rolling totals into the global figure.
Forecasting uses scenario analysis supported by variable-level expectations gathered in interviews, because barley is sensitive to harvest volatility and policy-driven demand changes. The base case is then stress tested by shifting yield, planted area, and price paths within a realistic range, and the forecast is accepted only after outputs remain consistent with the demand pool and trade balance logic.
Data Validation & Update Cycle
Validation is done in layers so one unusual data point does not tilt the full market value. We compare model outputs against independent signals such as global production totals, trade volumes, and price direction, and we investigate variances that look too large for a normal crop-year swing.
Before sign-off, the numbers go through an analyst review cycle where assumptions are checked for internal consistency and for alignment with what was heard in interviews. When a material shift is observed, such as a major crop revision, a policy change affecting trade, or an abrupt price move, respondents are re-contacted to confirm what changed and how it affects first-sale values. Reports refresh annually, with interim updates for material events, and a final pre-delivery pass is completed so clients receive the latest updated view.
Mordor Intelligence's Barley Market Size Versus Other Published Estimates
Published barley market values often do not match, even when they look like they cover the same crop, because the counting point and scope can be different. Differences usually come from whether the estimate is at farmgate versus later in the chain, whether processed derivatives are included, and how pricing is averaged across a crop year.
The main gap comes from mixing raw grain value with downstream barley-based products, where Mordor Intelligence counts only the first-sale value of barley grain and keeps malt extracts and other derivatives outside the total. Another driver is timing, since some sources use calendar-year averages while others track crop-year supply shocks, which can swing the assumed price per ton and the implied value even if volumes are similar.
Benchmark comparison
| Source | Market Size | Gaps in Research Methodology |
|---|---|---|
| Mordor Intelligence | USD 30.70 B (2026) | |
| Trade Data Publisher A | USD 48.80 B (2024) | Uses producer and importer revenues in nominal wholesale prices for 2024, which can reflect different price timing and a revenue concept that does not always align to a first-sale grain valuation. |
| Industry Research Group B | USD 25.00 B (2025) | Builds the total around broader commercial categorizations (such as multiple grades and channels) with a different base year, which can shift what is treated as in-scope value for raw barley versus adjacent barley-related sales. |
The spread shown in the table is mostly explained by scope and valuation timing, not just by demand direction. By tying the market to observable production and trade volumes and then applying price assumptions that are checked with channel feedback, we keep the final number traceable and repeatable when the next crop-year data releases arrive.
Key Questions Answered in the Report
What is the current global value of the barley market?
The barley market size is USD 30.7 billion in 2026 and is projected to reach USD 35.8 billion by 2031.
Which region is growing fastest for barley demand?
Asia Pacific posts the highest regional CAGR at 4.5% through 2031 due to Chinese craft beer expansion and rising feed imports.
Why is specialty barley gaining traction?
High beta-glucan and hull-less cultivars deliver higher extraction yields, enable cholesterol health claims, and attract premiums of up to USD 80 per metric ton.
What premium do organic barley growers receive?
Certified organic barley commands 20% to 40% price premiums which currently offset lower yields and certification costs.
How concentrated is the competitive landscape?
The top five merchants control about majority of revenues, indicating moderate concentration with substantial room for regional specialists.