Rye Market Size and Share

Rye Market Analysis by Mordor Intelligence
The global rye market, valued at USD 3.80 billion in 2026, is projected to reach USD 4.60 billion by 2031, growing at a CAGR of 4.20%. Momentum stems from steady bakery demand in Europe, rising interest from North American distillers, and expanding feed use across Asia[3]Source: Food and Agriculture Organization, “FAOSTAT Crops Database,” fao.org . Tight Black Sea supplies have redirected trade toward Poland and Canada, while carbon-credit programs in the United States and Canada help growers offset lower grain prices. Craft spirits premiums, hybrid-seed yield gains, and health-driven consumer preferences for whole-grain products further buoy sentiment, though recurring fungal pressure, acreage competition, and stricter food-safety limits temper the outlook.
Key Report Takeaways
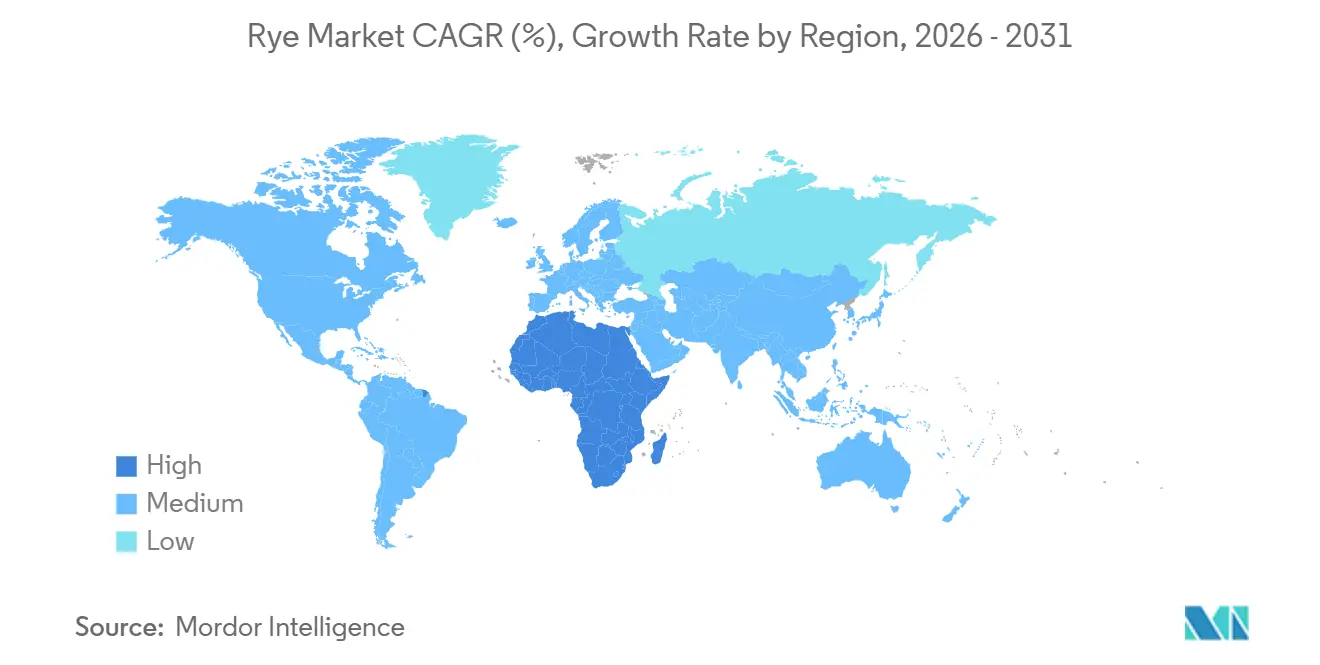
- By geography, Europe dominated the rye market with a 42% share in 2025, while the Asia-Pacific region is anticipated to register a CAGR of 5.4% during the forecast period through 2031.
Note: Market size and forecast figures in this report are generated using Mordor Intelligence’s proprietary estimation framework, updated with the latest available data and insights as of January 2026.
Global Rye Market Trends and Insights
Drivers Impact Analysis*
| Driver | (~) % Impact on CAGR Forecast | Geographic Relevance | Impact Timeline |
|---|---|---|---|
| Expansion in certified organic acreage | +0.8% | North America and Europe, with emerging adoption in South America | Medium term (2 to 4 years) |
| Government-backed export incentives for low-protein rye grades | +0.6% | Europe, North America, spillover to South America | Short term (≤ 2 years) |
| Surging demand from bakery and breakfast-cereal manufacturers | +1.2% | Global, with concentration in Europe, North America, and urban Asia-Pacific | Long term (≥ 4 years) |
| Emergence of rye-based craft spirits and specialty beers | +0.9% | North America, Europe, and select Asia-Pacific markets | Medium term (2 to 4 years) |
| Carbon-credit monetization of winter-rye cover crops | +0.5% | North America, pilot programs in Europe | Long term (≥ 4 years) |
| Uptake of hybrid rye in high-fiber livestock diets | +0.7% | Europe, North America, and Asia-Pacific | Medium term (2 to 4 years) |
| Source: Mordor Intelligence | |||
Expansion in Certified Organic Acreage
Retail premiums for organic rye flour have stayed several times higher than conventional grades, encouraging farmers to complete the three-year transition that unlocks certification[1]Source: USDA Risk Management Agency, “Organic Price Elections,” rma.usda.gov. Contracts with regional millers give growers predictable floor prices, while European eco-scheme payments sweeten returns and reduce exposure to grain-price swings. The shift lowers synthetic fungicide use, indirectly easing ergot pressure, yet it also raises the need for tighter agronomic monitoring to keep yields on par with conventional fields.
Government-Backed Export Incentives for Low-Protein Rye Grades
Credit guarantees under the USDA GSM-102 program and similar European tools cut freight risk. Traders seize these windows to clear surplus feed-grade lots that carry protein discounts, supporting on-farm cash flow and moderating domestic price swings. Because allocations are fixed by budget cycles, the lift they provide to the rye commodity market is most visible during the first half of each marketing year. The geographic relevance spans Europe and North America, with spillover effects in South American origins, as Argentina and Brazil explore rye as a winter rotation crop.
Surging Demand From Bakery and Breakfast-Cereal Manufacturers
Health-focused consumers gravitate to whole-grain bread, crackers, and cereals that highlight rye’s fiber and beta-glucan content, reinforcing its premium positioning against wheat. German and Scandinavian culinary traditions keep per-capita intake high, while North American artisan bakeries and Asian urban retailers push rye into new product lines. Millers respond by upgrading stone-milling capacity and by seeking traceable, contaminant-free grain, tightening quality spreads in the rye commodity market.
Emergence of Rye-Based Craft Spirits and Specialty Beers
Rye’s spicy flavor notes give distillers and brewers a distinctive edge in crowded premium categories. Contract distillers expand mash bills that feature rye at majority inclusion, while European craft brewers experiment with grist formulations that enhance mouthfeel and color. Premiums for malting-grade grain reward growers who adopt hybrids and apply late-season fungicides, reinforcing the value of clean, high-enzyme rye in the supply chain.
Restraints Impact Analysis*
| Restraint | (~) % Impact on CAGR Forecast | Geographic Relevance | Impact Timeline |
|---|---|---|---|
| Recurring fungal disease outbreaks | -0.9% | Europe, North America, Russia | Short term (≤ 2 years) |
| Yield losses due to erratic spring frosts | -0.5% | Russia, Northern Europe, Canadian Prairies | Medium term (2 to 4 years) |
| Acreage competition from higher-margin oilseeds and corn | -1.1% | North America, South America, Eastern Europe | Long term (≥ 4 years) |
| Stricter global mycotoxin limits impacting milling economics | -0.7% | Europe, North America, Asia-Pacific | Medium term (2 to 4 years) |
| Source: Mordor Intelligence | |||
Recurring Fungal Disease Outbreaks
Wet springs and cool flowering periods allow Claviceps spores to infect rye heads, raising cleaning costs and lowering milling yields. New European limits tighten tolerances, forcing mills to install optical sorters or source higher-cost hybrid grain. When outbreaks spike, livestock feeders also curb purchases because their ergot thresholds are even stricter than human food standards. The challenge limits rye's competitiveness in feed markets, where ergot alkaloid thresholds for livestock are stricter than for human consumption, capping inclusion rates and narrowing demand.
Yield Losses From Erratic Spring Frosts
Late frosts damage flowering spikes, cutting test weight, and relegating grain to lower-priced feed channels. Climate models predict more frequent temperature swings, making planting schedules and varietal choice increasingly critical in northern latitudes. Farmers hedge by shifting acreage south or by favoring faster-maturing hybrids, but both responses add cost and complexity. The challenge underscores the value of hybrid rye's faster maturity and stress tolerance, creating a competitive wedge for seed companies investing in cold-hardiness traits.
*Our forecasts treat driver/restraint impacts as directional, not additive. The impact forecasts reflect baseline growth, mix effects, and variable interactions.
Geography Analysis
Europe remained the largest territory, accounting for 42.0% of the rye market value in 2025. Germany, Poland, and Denmark generated about 4.5 million metric tons, helped by hybrid seed penetration above 70% in Germany and Denmark. Stricter 0.2 grams per kilogram ergot limits have forced millers to add USD 2.2–5.4 million in optical sorters, squeezing margins but enhancing food safety assurance [2]Source: European Commission, “Common Agricultural Policy Reports,” agriculture.ec.europa.eu . Russia’s supply shortfall raised European import dependence on Poland and the Baltics, widening basis by EUR 8–12 per metric ton (USD 8.6–13.0).
The Asia-Pacific region exhibits the fastest growth rate of 5.4% through 2031, as China’s feed trials and Japanese organic baking niches mature. Chinese integrators saved CNY 20–30 per metric ton (approximately USD 2.8–4.1) in ration costs at 5–10% rye inclusion, indicating potential for scale-up once phytosanitary protocols are finalized. South Korea subsidized rye imports for feed at KRW 50,000–80,000 per metric ton (USD 37–59), while Japan’s premium organic flour segment posted 12% annual growth. These early-stage markets reduce Europe’s historic consumption dominance.
North America's Canadian acreage surge offsets United States declines driven by corn and soybean profitability. Carbon-credit incentives sustain winter planting even when grain economics weaken. Mexico draws on craft whiskey ambitions and organic baking channels. South America, though still small, is trending as Argentina and Brazil test rye in soybean-corn rotations and chase non-GMO premiums.


Competitive Landscape
Competition is moderate, with the top five traders control a significant share of 2025 revenue. Archer Daniels Midland is leveraging Great Lakes and Gulf export nodes to serve distillers and feed mills. Louis Dreyfus Company followed, channeling Baltic and German rye into intra-EU trade lanes. The July 2025 merger of Bunge and Viterra, valued at USD 34 billion, lifted combined North American storage to 400 million bushels, narrowing origination options for Prairie growers and intensifying rivalry with ADM and CHS.
Seed innovation is a pivotal battleground. KWS’s PollenPlus platform delivers 30–40% yield gains and 40% ergot-incidence reductions, attracting premiums of USD 15–25 per acre. Bayer’s DEKALB unit and Limagrain’s Saaten-Union vie for share with fusarium-tolerant hybrids. Specialty millers such as Bay State Milling and Texas-based Barton Springs Mill capture value through stone-ground organic flours, achieving retail margins triple farm-gate grain. Digital agronomy services that pinpoint ergot hotspots and tailor nitrogen rates save growers USD 10–15 per acre, creating sticky ecosystems that favor large merchants invested in data platforms.
Storage and logistics assets remain critical. Bunge–Viterra controls significant Gulf elevation, ADM dominates barge traffic, and Louis Dreyfus links Baltic ports to German interiors. Mid-tier merchants seek differentiation via traceability and sustainability certifications, while new entrants explore carbon-credit bundling to gain a foothold.
Recent Industry Developments
- September 2025: Russia's flour industry, supported by a robust grain base and a long-standing milling tradition, is undergoing significant transformation. The sector is focusing on export growth, with plans to boost flour exports to 1.5 million metric tons, target quality improvements, and develop specialized products, thereby reshaping its position both domestically and internationally.
- May 2024: Archer Daniels Midland (ADM) is ramping up its regenerative agriculture program and setting new greenhouse gas targets, impacting its rye supply contracts. These initiatives, initially launched in Europe and South America, have seen ADM boost its global target for 2025 from 4 million to an ambitious 5 million acres.


Research Methodology Framework and Report Scope
Market Definitions and Key Coverage
Our study defines the rye market as the annual monetary value generated by raw, hulled rye grain (Secale cereale) that is harvested, traded, and finally routed into food, feed, beverage, and industrial channels worldwide. According to Mordor Intelligence, valuation begins at farm-gate and is tracked through commercial warehouses until first-point processing.
Scope Exclusions: Flour, malt, flakes, and other downstream rye derivatives that carry additional processing margins are not counted, so the baseline reflects only primary grain economics.
Segmentation Overview
- North America
- United States
- Production Analysis(Area Harvested, Yield, and Production Volume)
- Consumption Analysis (Consumption Value and Volume)
- Import Market Analysis (Import Value, Volume, and Key Supplying Markets)
- Export Market Analysis ( Export Value, Volume, and Key Destinations Markets)
- Wholesale Price Trend Analysis and Forecast
- Regulatory Framework
- List of Key Players
- Logistics and Infrastructure
- Seasonality Analysis
- Canada
- Production Analysis(Area Harvested, Yield, and Production Volume)
- Consumption Analysis (Consumption Value and Volume)
- Import Market Analysis (Import Value, Volume, and Key Supplying Markets)
- Export Market Analysis ( Export Value, Volume, and Key Destinations Markets)
- Wholesale Price Trend Analysis and Forecast
- Regulatory Framework
- List of Key Players
- Logistics and Infrastructure
- Seasonality Analysis
- United States
- Europe
- Germany
- Production Analysis(Area Harvested, Yield, and Production Volume)
- Consumption Analysis (Consumption Value and Volume)
- Import Market Analysis (Import Value, Volume, and Key Supplying Markets)
- Export Market Analysis ( Export Value, Volume, and Key Destinations Markets)
- Wholesale Price Trend Analysis and Forecast
- Regulatory Framework
- List of Key Players
- Logistics and Infrastructure
- Seasonality Analysis
- Poland
- Production Analysis(Area Harvested, Yield, and Production Volume)
- Consumption Analysis (Consumption Value and Volume)
- Import Market Analysis (Import Value, Volume, and Key Supplying Markets)
- Export Market Analysis ( Export Value, Volume, and Key Destinations Markets)
- Wholesale Price Trend Analysis and Forecast
- Regulatory Framework
- List of Key Players
- Logistics and Infrastructure
- Seasonality Analysis
- Russia
- Production Analysis(Area Harvested, Yield, and Production Volume)
- Consumption Analysis (Consumption Value and Volume)
- Import Market Analysis (Import Value, Volume, and Key Supplying Markets)
- Export Market Analysis ( Export Value, Volume, and Key Destinations Markets)
- Wholesale Price Trend Analysis and Forecast
- Regulatory Framework
- List of Key Players
- Logistics and Infrastructure
- Seasonality Analysis
- France
- Production Analysis(Area Harvested, Yield, and Production Volume)
- Consumption Analysis (Consumption Value and Volume)
- Import Market Analysis (Import Value, Volume, and Key Supplying Markets)
- Export Market Analysis ( Export Value, Volume, and Key Destinations Markets)
- Wholesale Price Trend Analysis and Forecast
- Regulatory Framework
- List of Key Players
- Logistics and Infrastructure
- Seasonality Analysis
- United Kingdom
- Production Analysis(Area Harvested, Yield, and Production Volume)
- Consumption Analysis (Consumption Value and Volume)
- Import Market Analysis (Import Value, Volume, and Key Supplying Markets)
- Export Market Analysis ( Export Value, Volume, and Key Destinations Markets)
- Wholesale Price Trend Analysis and Forecast
- Regulatory Framework
- List of Key Players
- Logistics and Infrastructure
- Seasonality Analysis
- Denmark
- Production Analysis(Area Harvested, Yield, and Production Volume)
- Consumption Analysis (Consumption Value and Volume)
- Import Market Analysis (Import Value, Volume, and Key Supplying Markets)
- Export Market Analysis ( Export Value, Volume, and Key Destinations Markets)
- Wholesale Price Trend Analysis and Forecast
- Regulatory Framework
- List of Key Players
- Logistics and Infrastructure
- Seasonality Analysis
- Germany
- Asia-Pacific
- China
- Production Analysis(Area Harvested, Yield, and Production Volume)
- Consumption Analysis (Consumption Value and Volume)
- Import Market Analysis (Import Value, Volume, and Key Supplying Markets)
- Export Market Analysis ( Export Value, Volume, and Key Destinations Markets)
- Wholesale Price Trend Analysis and Forecast
- Regulatory Framework
- List of Key Players
- Logistics and Infrastructure
- Seasonality Analysis
- India
- Production Analysis(Area Harvested, Yield, and Production Volume)
- Consumption Analysis (Consumption Value and Volume)
- Import Market Analysis (Import Value, Volume, and Key Supplying Markets)
- Export Market Analysis ( Export Value, Volume, and Key Destinations Markets)
- Wholesale Price Trend Analysis and Forecast
- Regulatory Framework
- List of Key Players
- Logistics and Infrastructure
- Seasonality Analysis
- Japan
- Production Analysis(Area Harvested, Yield, and Production Volume)
- Consumption Analysis (Consumption Value and Volume)
- Import Market Analysis (Import Value, Volume, and Key Supplying Markets)
- Export Market Analysis ( Export Value, Volume, and Key Destinations Markets)
- Wholesale Price Trend Analysis and Forecast
- Regulatory Framework
- List of Key Players
- Logistics and Infrastructure
- Seasonality Analysis
- Australia
- Production Analysis(Area Harvested, Yield, and Production Volume)
- Consumption Analysis (Consumption Value and Volume)
- Import Market Analysis (Import Value, Volume, and Key Supplying Markets)
- Export Market Analysis ( Export Value, Volume, and Key Destinations Markets)
- Wholesale Price Trend Analysis and Forecast
- Regulatory Framework
- List of Key Players
- Logistics and Infrastructure
- Seasonality Analysis
- China
- South America
- Brazil
- Production Analysis(Area Harvested, Yield, and Production Volume)
- Consumption Analysis (Consumption Value and Volume)
- Import Market Analysis (Import Value, Volume, and Key Supplying Markets)
- Export Market Analysis ( Export Value, Volume, and Key Destinations Markets)
- Wholesale Price Trend Analysis and Forecast
- Regulatory Framework
- List of Key Players
- Logistics and Infrastructure
- Seasonality Analysis
- Argentina
- Production Analysis(Area Harvested, Yield, and Production Volume)
- Consumption Analysis (Consumption Value and Volume)
- Import Market Analysis (Import Value, Volume, and Key Supplying Markets)
- Export Market Analysis ( Export Value, Volume, and Key Destinations Markets)
- Wholesale Price Trend Analysis and Forecast
- Regulatory Framework
- List of Key Players
- Logistics and Infrastructure
- Seasonality Analysis
- Brazil
- Middle East
- Turkey
- Production Analysis(Area Harvested, Yield, and Production Volume)
- Consumption Analysis (Consumption Value and Volume)
- Import Market Analysis (Import Value, Volume, and Key Supplying Markets)
- Export Market Analysis ( Export Value, Volume, and Key Destinations Markets)
- Wholesale Price Trend Analysis and Forecast
- Regulatory Framework
- List of Key Players
- Logistics and Infrastructure
- Seasonality Analysis
- Israel
- Production Analysis(Area Harvested, Yield, and Production Volume)
- Consumption Analysis (Consumption Value and Volume)
- Import Market Analysis (Import Value, Volume, and Key Supplying Markets)
- Export Market Analysis ( Export Value, Volume, and Key Destinations Markets)
- Wholesale Price Trend Analysis and Forecast
- Regulatory Framework
- List of Key Players
- Logistics and Infrastructure
- Seasonality Analysis
- Iraq
- Production Analysis(Area Harvested, Yield, and Production Volume)
- Consumption Analysis (Consumption Value and Volume)
- Import Market Analysis (Import Value, Volume, and Key Supplying Markets)
- Export Market Analysis ( Export Value, Volume, and Key Destinations Markets)
- Wholesale Price Trend Analysis and Forecast
- Regulatory Framework
- List of Key Players
- Logistics and Infrastructure
- Seasonality Analysis
- Turkey
- Africa
- South Africa
- Production Analysis(Area Harvested, Yield, and Production Volume)
- Consumption Analysis (Consumption Value and Volume)
- Import Market Analysis (Import Value, Volume, and Key Supplying Markets)
- Export Market Analysis ( Export Value, Volume, and Key Destinations Markets)
- Wholesale Price Trend Analysis and Forecast
- Regulatory Framework
- List of Key Players
- Logistics and Infrastructure
- Seasonality Analysis
- Egypt
- Production Analysis(Area Harvested, Yield, and Production Volume)
- Consumption Analysis (Consumption Value and Volume)
- Import Market Analysis (Import Value, Volume, and Key Supplying Markets)
- Export Market Analysis ( Export Value, Volume, and Key Destinations Markets)
- Wholesale Price Trend Analysis and Forecast
- Regulatory Framework
- List of Key Players
- Logistics and Infrastructure
- Seasonality Analysis
- South Africa
Detailed Research Methodology and Data Validation
Primary Research
Mordor analysts interviewed grain merchants, millers, distillers, and livestock nutritionists across Europe, North America, and Asia Pacific to validate average selling prices, hybrid-rye penetration, and cover-crop acreage intent. Structured questionnaires and follow-up calls filled data gaps left by secondary sources and shaped scenario brackets that feed our model.
Desk Research
We pulled macro-level acreage, yield, and trade flow data from public agencies such as USDA-FAS, Eurostat, and FAO; price series from UN Comtrade and national customs portals; and agronomic trend papers housed on platforms like ScienceDirect and Google Scholar. Company 10-Ks, quarterly calls, and association outlooks (IGC, COCERAL) helped us cross-check harvest quality, contract structures, and spot premiums. Select insights on corporate procurement came from D&B Hoovers and news sweeps in Dow Jones Factiva. The sources listed are illustrative, not exhaustive, and many additional channels informed our desk work.
Market-Sizing & Forecasting
We began with a top-down rebuild that multiplies harvested area by five-year average yield, adjusts for on-farm retention, and then converts tradable volume to value using region-specific farm-gate prices. These outputs are corroborated through selective bottom-up supplier roll-ups and channel checks. Key inputs include winter-rye sowing area, ergot-related rejection rates, β-glucan driven feed substitution ratios, export credit incentives, and hybrid seed adoption curves. A multivariate regression links those drivers to historical value, allowing us to project demand under base, optimistic, and stress scenarios. Gap cells in country-level bottoms-up work are bridged using three-year moving averages anchored to observed trade balances.
Data Validation & Update Cycle
Outputs undergo variance flags against independent metrics, followed by peer review and a sign-off by a senior analyst. Mordor refreshes the model every twelve months, issuing interim updates when weather shocks, policy shifts, or price spikes move the baseline materially.
Why Mordor's Rye Baseline Earns Solid Trust
Published estimates often diverge because firms pick different starting years, add processed derivatives, or roll volume forward with flat price escalators.
Key gap drivers include: some studies bundle rye flour and malt values, others rely on aggressive farm-gate inflation, and a few apply static conversion factors that ignore hybrid yield gains. Mordor's disciplined scope, annual refresh cycle, and dual pass through top-down and bottom-up logic keep our number aligned with real-world trade flows and producer economics.
Benchmark comparison
| Market Size | Anonymized source | Primary gap driver |
|---|---|---|
| USD 3.60 B (2025) | Mordor Intelligence | - |
| USD 4.02 B (2024) | Global Consultancy A | Includes flour & flakes, older base year |
| USD 4.17 B (2025) | Regional Consultancy B | Applies uniform price uplift, limited trade-flow checks |
| USD 4.46 B (2024) | Industry Journal C | Bundles value-added products, relies on producer press releases |
Taken together, the comparison shows that while other figures swing wider, Mordor Intelligence delivers a balanced, transparent baseline that traces directly to observable acreage, yield, and price variables, making it the dependable reference for strategic decisions.


Key Questions Answered in the Report
What is the current size of the rye market?
The rye market is valued at USD 3.8 billion in 2026 and is forecast to grow to USD 4.6 billion by 2031.
Why are Canadian rye shipments becoming more prominent in trade flows?
Recent supply shortfalls in Russia and Poland have opened space for Canadian grain, supported by reliable rail links to United States distillers and improving port access.
Why is rye attractive as a cover crop?
Rye sequesters an average of 0.19 metric ton CO₂e per acre each season and improves soil structure, allowing farmers to earn carbon credits and boost field health.
How do carbon-credit programs influence rye planting decisions in the United States and Canada?
Payments tied to winter-cover sequestration offset lower grain margins, encouraging growers to maintain or expand acreage.
How do mycotoxin rules impact rye trade?
Tighter limits require enhanced testing and segregation, raising processing costs and occasionally restricting exports from high-risk production zones.
Page last updated on:


