Wheat Market Analysis by Mordor Intelligence
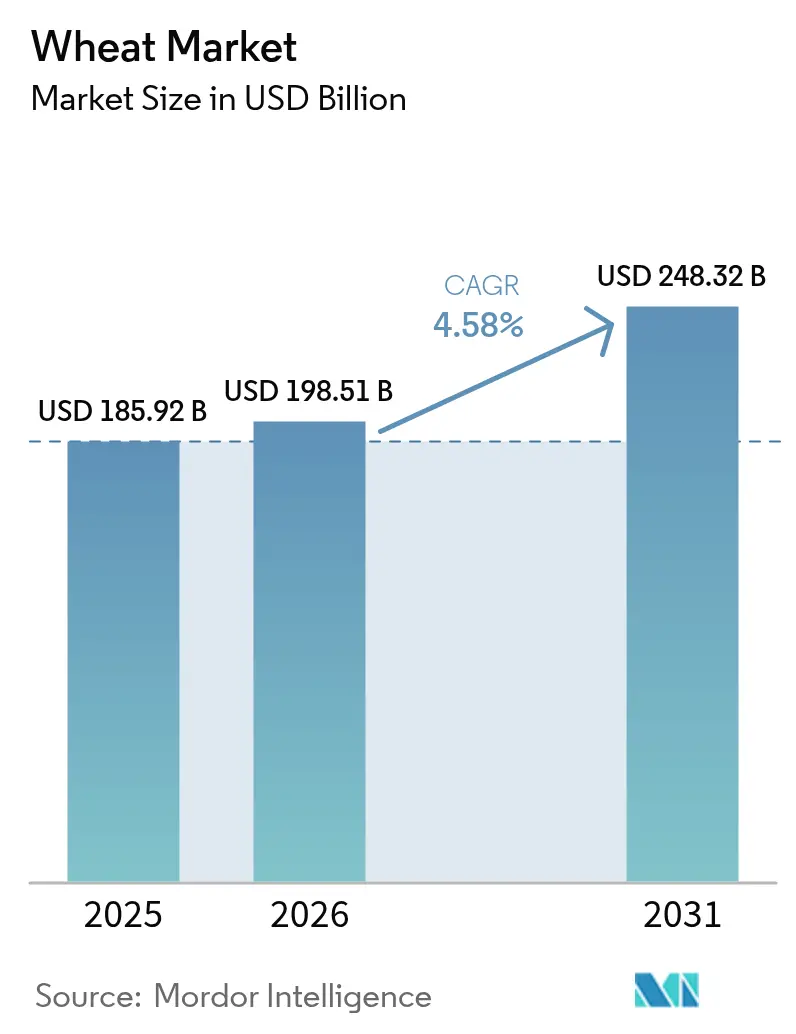
The wheat market size was valued at USD 185.92 billion in 2025 and estimated to grow from USD 198.51 billion in 2026 to reach USD 248.32 billion by 2031, at a CAGR of 4.58% during the forecast period (2026-2031). The expansion reflects wheat’s role as a daily staple for more than 2.5 billion people, sustained public-health fortification programs, and policy-driven demand from renewable fuel standards. Asia-Pacific anchors consumption with resilient state support in China and India, while Africa’s structural shortfall accelerates import growth. Biofuel mandates in the United States and the European Union provide an industrial demand floor that absorbs surplus grades, and seed innovations focused on heat and drought tolerance are gradually extending viable production zones. Competitive intensity remains moderate, as four multinational traders coordinate most cross-border flows, yet upstream supply is diffused across millions of farms, creating scope for digital platforms that shorten the value chain.
Key Report Takeaways
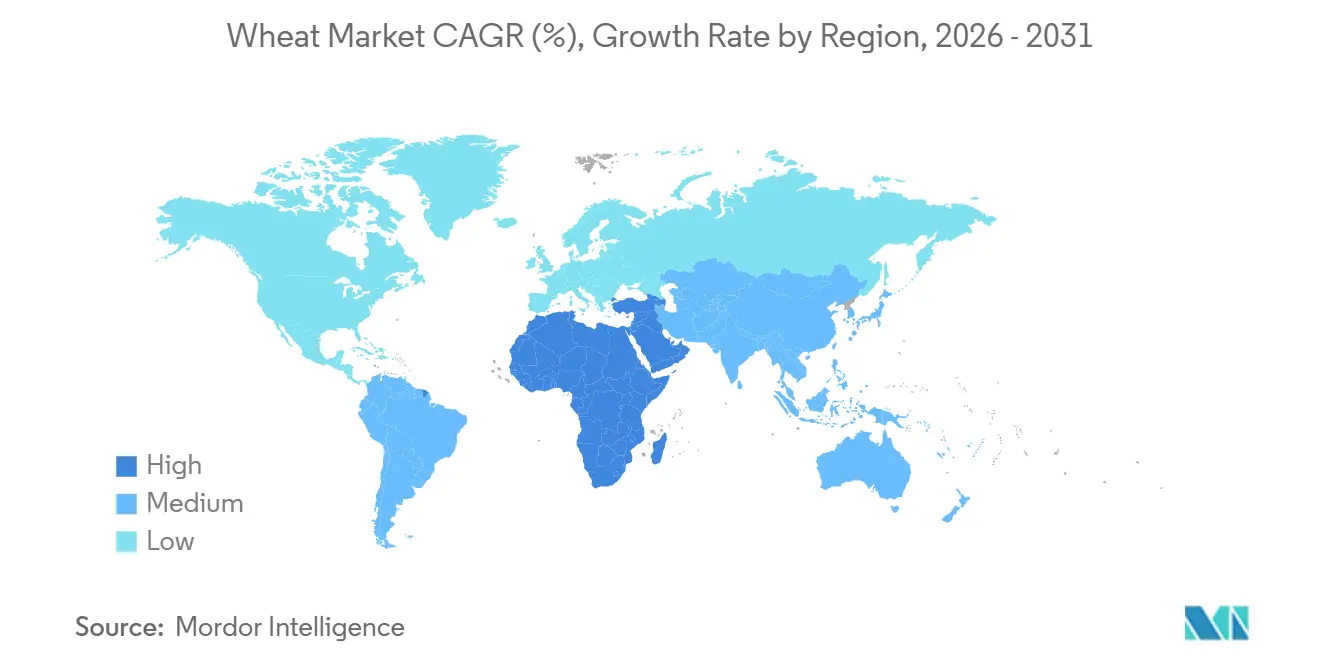
- By geography, Asia-Pacific led with 37.2% wheat market share in 2025, while Africa recorded the fastest forecast CAGR at 5.0% through 2031.
Note: Market size and forecast figures in this report are generated using Mordor Intelligence’s proprietary estimation framework, updated with the latest available data and insights as of 2026.
Global Wheat Market Trends and Insights
Drivers Impact Analysis*
| Driver | (~) % Impact on CAGR Forecast | Geographic Relevance | Impact Timeline |
|---|---|---|---|
| Growth in fortified wheat products demand | +0.7% | South Asia, sub-Saharan Africa, and Southeast Asia | Medium term (2-4 years) |
| Expansion of convenience wheat-based foods | +0.6% | Asia-Pacific, North America, Middle East, and Africa urban centers | Short term (≤ 2 years) |
| Government biofuel-blend mandates | +0.4% | North America, European Union, Brazil, and India | Long term (≥ 4 years) |
| Global trade liberalization in cereals | +0.5% | Import-dependent Middle East, North Africa, and Southeast Asia | Medium term (2-4 years) |
| Commercial roll-out of heat-tolerant wheat genetics | +0.6% | South Asia, sub-Saharan Africa, Australia, and Mediterranean Europe | Long term (≥ 4 years) |
| Artifical intelligence enabled yield-forecasting adoption | +0.3% | North America, Europe, Australia, and Argentina | Short term (≤ 2 years) |
| Source: Mordor Intelligence | |||
Growth in Fortified Wheat Products Demand
Mandatory and voluntary flour-fortification programs now operate in 89 countries, embedding iron, zinc, and folic acid into industrial milling streams. Public procurement in Pakistan and Ethiopia specifies fortified flour for school meals, creating structural demand that commands a 3-5% retail premium[1]Source: World Health Organization, “Food Fortification Progress,” who.int. Private millers invest in traceability systems aligned with Codex Alimentarius, while donor-funded initiatives expand premix availability in sub-Saharan Africa. The driver is strongest where anemia and neural tube defect prevalence remain high, notably in India’s National Iron Plus Initiative and Nigeria’s mandatory standards. Rising health-conscious urban populations reinforce volume growth and sustain the positive price differential that boosts processor margins.
Expansion of Convenience Wheat-Based Foods
Urbanization and higher female labor-force participation lift demand for instant noodles, frozen dough, and ready-to-eat flatbreads. According to the World Instant Noodles Association (WINA), global instant noodle consumption surpassed 123,067 million servings in 2024, up from 118,180 million in 2021. This growth highlights the rising demand for convenient and affordable food options worldwide. China, Indonesia, India, and Vietnam reported the highest per capita consumption, driven by their large populations and rising preference for instant noodles as a staple[2]Source: World Instant Noodles Association, "Demand Rankings," instantnoodles.org. Supermarkets extend shelf life to 12 months through blast freezing and modified-atmosphere packaging, while e-commerce favors shelf-stable SKUs that tolerate multi-day delivery. Processors specify higher-protein, lower-moisture flour for automated lines, directing premiums to farmers who adopt improved cultivars. Adoption is cascading across Asia-Pacific and increasingly shaping bakery aisles in North America and Europe.
Commercial Roll-Out of Heat-Tolerant Wheat Genetics
The International Maize and Wheat Improvement Center (CIMMYT) lines, including HD3298 and DBW187, along with public releases in Australia in 2021, provide a yield advantage of 12-18% under temperatures exceeding 35 degrees Celsius[3]Source: International Maize and Wheat Improvement Center, “Heat-Tolerant Varieties,” cimmyt.org. These lines are specifically designed to address the challenges posed by rising temperatures and climate variability, ensuring improved productivity in heat-stressed regions. Companies such as Bayer AG, Corteva Agriscience, and Syngenta Group license this germplasm for use in region-specific hybrids, enabling tailored solutions for diverse agricultural conditions. Governments in South Asia co-fund subsidized seed packs to support adoption, aiming to enhance food security and farmer resilience. While scaling efforts face logistical delays, national adaptation strategies in countries such as India, Pakistan, and Ethiopia prioritize subsidized distribution, thereby facilitating increased adoption in the medium term. These strategies are part of broader initiatives to mitigate the impacts of climate change on agriculture and ensure sustainable crop production.
Artificial Intelligence Enabled Yield-Forecasting Adoption
Satellites, machine learning, and field sensors can now predict wheat yields with an accuracy exceeding 90%. These technologies analyze vast amounts of data, including weather patterns, soil conditions, and crop health, to generate precise yield forecasts. The United States Department of Agriculture incorporated these models into its World Agricultural Supply and Demand Estimates in 2025, improving market transparency and enabling better decision-making across the supply chain. Farmers who share these forecasts benefit from crop insurance discounts, while variable-rate equipment helps reduce fertilizer costs by optimizing input usage. Although these technologies are capital-intensive, smartphone-based versions are projected to provide wider accessibility for smallholders by 2028, potentially transforming agricultural practices in developing regions.
Restraints Impact Analysis*
| Restraint | (~) % Impact on CAGR Forecast | Geographic Relevance | Impact Timeline |
|---|---|---|---|
| Volatility in fertilizer prices | -0.8% | South Asia, sub-Saharan Africa, and Eastern Europe | Short term (≤ 2 years) |
| Geopolitical export restrictions | -0.9% | Middle East, North Africa, and Southeast Asia importers | Medium term (2-4 years) |
| Mycotoxin contamination incidents | -0.3% | Humid belts of South Asia, Southeast Asia, South America, and Africa | Medium term (2-4 years) |
| Water-stress-induced yield loss | -0.6% | South Asia, Mediterranean Europe, Australia, and parts of North America | Long term (≥ 4 years) |
| Source: Mordor Intelligence | |||
Geopolitical Export Restrictions
India's export ban, extended through 2024, and Russia's shipment quota capped at 30 million metric tons, have collectively reduced availability for countries like Egypt and Bangladesh. This has created significant challenges for importers, who are now stockpiling inventory to mitigate supply uncertainties. As a result, storage costs have risen, and importers are expanding credit lines to manage financial pressures. Additionally, futures markets are pricing in higher geopolitical risk premiums, reflecting the uncertainty surrounding global trade dynamics. The World Trade Organization's limited enforcement capabilities suggest that such trade restrictions may persist, further discouraging long-term contracting and complicating global supply chain planning.
Mycotoxin Contamination Incidents
Humid production regions in South Asia and parts of South America frequently encounter deoxynivalenol exceedances, leading to container rejections at European ports. These regions face challenges due to climatic conditions that favor mycotoxin growth, impacting the quality of agricultural produce. Exporters are adopting measures such as post-harvest drying, silo aeration, and real-time sensors to meet the stricter thresholds set by the European Union. These compliance efforts increase handling costs and cause shipment delays, deterring traders from sourcing in high-risk areas. The financial burden of implementing these measures often falls on exporters, further complicating trade dynamics in these regions.
*Our forecasts treat driver/restraint impacts as directional, not additive. The impact forecasts reflect baseline growth, mix effects, and variable interactions.
Geography Analysis
Asia-Pacific is the largest geography segment and contributed 37.2% of the wheat market share in 2025. According to the Indian Rice Exporters Federation, India's wheat production in 2025 reached a record 117.5 million metric tons. Wheat was planted across 6.62 million hectares in 2025, reflecting a 17% increase compared to the previous year, based on data from the Ministry of Agriculture and Farmers’ Welfare. In India, wheat sowing for the 2025/26 season is projected to increase by 5% from the previous year’s record of 34.16 million hectares. In the 2025/26 period, China achieved a production of 140.1 million metric tons[4]Source: Foreign Agricultural Services, "China: Grain and Feed Update," fas.usda.gov. Import-dependent countries such as Japan and those in Southeast Asia purchased higher-protein wheat from Australia and Canada, driven by urban preferences for convenience foods like noodles and baked snacks, which is positively influencing the outlook for the wheat market.
Africa is experiencing the fastest growth, with a CAGR of 5.0%, and imports accounting for half of its consumption. According to the ITC Trade Map, Egypt is projected to lead global imports in 2024, with a value of USD 4,442,761 thousand, primarily for a subsidized bread program benefiting 70 million citizens. Limited irrigation and fertilizer usage, at less than 15 kilograms per hectare, constrain local yields. However, continental initiatives supported by the African Development Bank aim to enhance production in countries such as Ethiopia, Kenya, and Tanzania. Efforts to expand cultivation in the Ethiopian highlands and the East African Rift Valley are projected to gradually reduce dependence on imports.
North America and Europe continue to serve as major export hubs, collectively shipping significant volumes annually. The United States is a key producer, with hard red wheat varieties comprising the majority of shipments to Asia. Canada is another important supplier, providing premium bread wheat and durum primarily to Italy and Algeria. The European Union maintains substantial harvests despite occasional yield declines due to heat stress and continues to export to North Africa. Meanwhile, competitive supplies from the Black Sea region, particularly Russia, continue to impact price benchmarks at Mediterranean ports.


Competitive Landscape
Four multinational grain merchants control a significant portion of export logistics, resulting in a moderately concentrated midstream segment. These merchants utilize networks of country elevators, port terminals, and chartered vessels to manage basis spreads. Digital trading platforms that connect farm offers with processor bids are reducing intermediary margins and enhancing transparency. Seed developers such as Bayer AG, Corteva Agriscience, and Syngenta Group differentiate their offerings through traits like Fusarium head blight resistance.
Precision agriculture startups like Taranis and aWhere supply satellite-driven crop insights that cut input spend by up to 8%. Vertical integration is expanding, with flour millers acquiring farms and traders investing in ethanol plants to diversify revenue streams. Regional challengers such as China National Cereals, Oils, and Foodstuffs Corporation and India’s National Agricultural Cooperative Marketing Federation expand procurement muscle, leveraging government backing and local storage to reduce reliance on multinationals.
Sustainability compliance is an emerging moat. Exporters to Europe and Japan increasingly require International Organization for Standardization 22000 certification for food safety and Roundtable on Sustainable Biomaterials verification. Companies adopting blockchain for traceability and Internet of Things sensors for silo monitoring cut spoilage and lower insurance premiums. Milling consolidation continues, with Ardent Mills controlling about majority of North American capacity and European cooperatives merging to capture procurement scale.
Recent Industry Developments
- February 2026: The Government of India has approved the export of 2.5 million metric tons of wheat to support farmers and stabilize domestic markets. This represents the first significant relaxation since the comprehensive export ban was implemented in May 2022. The decision comes in response to protests from farmer organizations over declining domestic prices and concerns related to a recent India-US trade framework.
- February 2026: France approved the registration of Syngenta Group’s X-Terra hybrid wheat, representing a significant milestone in the development of commercially scalable hybrid wheat systems. This hybrid system aims to deliver stable yields and improved resilience to climate-related challenges, including irregular rainfall and extreme temperature fluctuations, compared to traditional varieties.
- October 2025: Bangladesh has approved the purchase of approximately 220,000 metric tons of wheat from the United States under a government-to-government agreement. This deal aims to address trade tensions with Washington following the imposition of import tariffs. The agreement is part of a memorandum of understanding signed in July, under which Bangladesh will import 700,000 metric tons of wheat annually from the United States over the next five years. This initiative seeks to diversify grain sources and enhance trade relations.
- July 2025: Ghana has launched a climate-resilient wheat program in partnership with India, collaborating with Arima Farms and the CSIR-Crops Research Institute to enhance local production and food security. The initiative aims to promote sustainable farming practices and improve food security by utilizing heat-tolerant wheat varieties, fostering South-South cooperation.


Global Wheat Market Report Scope
Wheat is widely cultivated for its seed, a cereal grain that is a staple food worldwide. Many species of wheat together make up the genus Triticum, out of which the most widely grown is common wheat (Triticum aestivum).
The Wheat Market Report is Segmented by Geography (North America, Europe, Asia-Pacific, South America, the Middle East, and Africa). The Report Includes Production Analysis (Volume), Consumption Analysis (Value and Volume), Export Analysis (Value and Volume), Import Analysis (Value and Volume), Wholesale Price Trend Analysis, Regulatory Framework, List of Key Players, Logistics and Infrastructure, and Seasonality Analysis. The Market Forecasts are Provided in Terms of Value (USD) and Volume (Metric Tons).
By Geography
| North America | United States | Production Analysis (Area Harvested, Yield, and Production Volume) |
| Consumption Analysis (Consumption Value and Volume) | ||
| Import Market Analysis (Import Value, Volume, and Key Supplying Markets) | ||
| Export Market Analysis (Export Value, Volume, and Key Destination Markets) | ||
| Wholesale Price Trend Analysis and Forecast | ||
| Regulatory Framework | ||
| List of Key Players | ||
| Logistics and Infrastructure | ||
| Seasonality Analysis | ||
| Mexico | Production Analysis (Area Harvested, Yield, and Production Volume) | |
| Consumption Analysis (Consumption Value and Volume) | ||
| Import Market Analysis (Import Value, Volume, and Key Supplying Markets) | ||
| Export Market Analysis (Export Value, Volume, and Key Destination Markets) | ||
| Wholesale Price Trend Analysis and Forecast | ||
| Regulatory Framework | ||
| List of Key Players | ||
| Logistics and Infrastructure | ||
| Seasonality Analysis | ||
| Canada | Production Analysis (Area Harvested, Yield, and Production Volume) | |
| Consumption Analysis (Consumption Value and Volume) | ||
| Import Market Analysis (Import Value, Volume, and Key Supplying Markets) | ||
| Export Market Analysis (Export Value, Volume, and Key Destination Markets) | ||
| Wholesale Price Trend Analysis and Forecast | ||
| Regulatory Framework | ||
| List of Key Players | ||
| Logistics and Infrastructure | ||
| Seasonality Analysis | ||
| Europe | Germany | Production Analysis (Area Harvested, Yield, and Production Volume) |
| Consumption Analysis (Consumption Value and Volume) | ||
| Import Market Analysis (Import Value, Volume, and Key Supplying Markets) | ||
| Export Market Analysis (Export Value, Volume, and Key Destination Markets) | ||
| Wholesale Price Trend Analysis and Forecast | ||
| Regulatory Framework | ||
| List of Key Players | ||
| Logistics and Infrastructure | ||
| Seasonality Analysis | ||
| United Kingdom | Production Analysis (Area Harvested, Yield, and Production Volume) | |
| Consumption Analysis (Consumption Value and Volume) | ||
| Import Market Analysis (Import Value, Volume, and Key Supplying Markets) | ||
| Export Market Analysis (Export Value, Volume, and Key Destination Markets) | ||
| Wholesale Price Trend Analysis and Forecast | ||
| Regulatory Framework | ||
| List of Key Players | ||
| Logistics and Infrastructure | ||
| Seasonality Analysis | ||
| France | Production Analysis (Area Harvested, Yield, and Production Volume) | |
| Consumption Analysis (Consumption Value and Volume) | ||
| Import Market Analysis (Import Value, Volume, and Key Supplying Markets) | ||
| Export Market Analysis (Export Value, Volume, and Key Destination Markets) | ||
| Wholesale Price Trend Analysis and Forecast | ||
| Regulatory Framework | ||
| List of Key Players | ||
| Logistics and Infrastructure | ||
| Seasonality Analysis | ||
| Poland | Production Analysis (Area Harvested, Yield, and Production Volume) | |
| Consumption Analysis (Consumption Value and Volume) | ||
| Import Market Analysis (Import Value, Volume, and Key Supplying Markets) | ||
| Export Market Analysis (Export Value, Volume, and Key Destination Markets) | ||
| Wholesale Price Trend Analysis and Forecast | ||
| Regulatory Framework | ||
| List of Key Players | ||
| Logistics and Infrastructure | ||
| Seasonality Analysis | ||
| Italy | Production Analysis (Area Harvested, Yield, and Production Volume) | |
| Consumption Analysis (Consumption Value and Volume) | ||
| Import Market Analysis (Import Value, Volume, and Key Supplying Markets) | ||
| Export Market Analysis (Export Value, Volume, and Key Destination Markets) | ||
| Wholesale Price Trend Analysis and Forecast | ||
| Regulatory Framework | ||
| List of Key Players | ||
| Logistics and Infrastructure | ||
| Seasonality Analysis | ||
| Spain | Production Analysis (Area Harvested, Yield, and Production Volume) | |
| Consumption Analysis (Consumption Value and Volume) | ||
| Import Market Analysis (Import Value, Volume, and Key Supplying Markets) | ||
| Export Market Analysis (Export Value, Volume, and Key Destination Markets) | ||
| Wholesale Price Trend Analysis and Forecast | ||
| Regulatory Framework | ||
| List of Key Players | ||
| Logistics and Infrastructure | ||
| Seasonality Analysis | ||
| Russia | Production Analysis (Area Harvested, Yield, and Production Volume) | |
| Consumption Analysis (Consumption Value and Volume) | ||
| Import Market Analysis (Import Value, Volume, and Key Supplying Markets) | ||
| Export Market Analysis (Export Value, Volume, and Key Destination Markets) | ||
| Wholesale Price Trend Analysis and Forecast | ||
| Regulatory Framework | ||
| List of Key Players | ||
| Logistics and Infrastructure | ||
| Seasonality Analysis | ||
| Asia-Pacific | China | Production Analysis (Area Harvested, Yield, and Production Volume) |
| Consumption Analysis (Consumption Value and Volume) | ||
| Import Market Analysis (Import Value, Volume, and Key Supplying Markets) | ||
| Export Market Analysis (Export Value, Volume, and Key Destination Markets) | ||
| Wholesale Price Trend Analysis and Forecast | ||
| Regulatory Framework | ||
| List of Key Players | ||
| Logistics and Infrastructure | ||
| Seasonality Analysis | ||
| India | Production Analysis (Area Harvested, Yield, and Production Volume) | |
| Consumption Analysis (Consumption Value and Volume) | ||
| Import Market Analysis (Import Value, Volume, and Key Supplying Markets) | ||
| Export Market Analysis (Export Value, Volume, and Key Destination Markets) | ||
| Wholesale Price Trend Analysis and Forecast | ||
| Regulatory Framework | ||
| List of Key Players | ||
| Logistics and Infrastructure | ||
| Seasonality Analysis | ||
| Japan | Production Analysis (Area Harvested, Yield, and Production Volume) | |
| Consumption Analysis (Consumption Value and Volume) | ||
| Import Market Analysis (Import Value, Volume, and Key Supplying Markets) | ||
| Export Market Analysis (Export Value, Volume, and Key Destination Markets) | ||
| Wholesale Price Trend Analysis and Forecast | ||
| Regulatory Framework | ||
| List of Key Players | ||
| Logistics and Infrastructure | ||
| Seasonality Analysis | ||
| Australia | Production Analysis (Area Harvested, Yield, and Production Volume) | |
| Consumption Analysis (Consumption Value and Volume) | ||
| Import Market Analysis (Import Value, Volume, and Key Supplying Markets) | ||
| Export Market Analysis (Export Value, Volume, and Key Destination Markets) | ||
| Wholesale Price Trend Analysis and Forecast | ||
| Regulatory Framework | ||
| List of Key Players | ||
| Logistics and Infrastructure | ||
| Seasonality Analysis | ||
| South America | Brazil | Production Analysis (Area Harvested, Yield, and Production Volume) |
| Consumption Analysis (Consumption Value and Volume) | ||
| Import Market Analysis (Import Value, Volume, and Key Supplying Markets) | ||
| Export Market Analysis (Export Value, Volume, and Key Destination Markets) | ||
| Wholesale Price Trend Analysis and Forecast | ||
| Regulatory Framework | ||
| List of Key Players | ||
| Logistics and Infrastructure | ||
| Seasonality Analysis | ||
| Argentina | Production Analysis (Area Harvested, Yield, and Production Volume) | |
| Consumption Analysis (Consumption Value and Volume) | ||
| Import Market Analysis (Import Value, Volume, and Key Supplying Markets) | ||
| Export Market Analysis (Export Value, Volume, and Key Destination Markets) | ||
| Wholesale Price Trend Analysis and Forecast | ||
| Regulatory Framework | ||
| List of Key Players | ||
| Logistics and Infrastructure | ||
| Seasonality Analysis | ||
| Chile | Production Analysis (Area Harvested, Yield, and Production Volume) | |
| Consumption Analysis (Consumption Value and Volume) | ||
| Import Market Analysis (Import Value, Volume, and Key Supplying Markets) | ||
| Export Market Analysis (Export Value, Volume, and Key Destination Markets) | ||
| Wholesale Price Trend Analysis and Forecast | ||
| Regulatory Framework | ||
| List of Key Players | ||
| Logistics and Infrastructure | ||
| Seasonality Analysis | ||
| Middle East | United Arab Emirates | Production Analysis (Area Harvested, Yield, and Production Volume) |
| Consumption Analysis (Consumption Value and Volume) | ||
| Import Market Analysis (Import Value, Volume, and Key Supplying Markets) | ||
| Export Market Analysis (Export Value, Volume, and Key Destination Markets) | ||
| Wholesale Price Trend Analysis and Forecast | ||
| Regulatory Framework | ||
| List of Key Players | ||
| Logistics and Infrastructure | ||
| Seasonality Analysis | ||
| Turkey | Production Analysis (Area Harvested, Yield, and Production Volume) | |
| Consumption Analysis (Consumption Value and Volume) | ||
| Import Market Analysis (Import Value, Volume, and Key Supplying Markets) | ||
| Export Market Analysis (Export Value, Volume, and Key Destination Markets) | ||
| Wholesale Price Trend Analysis and Forecast | ||
| Regulatory Framework | ||
| List of Key Players | ||
| Logistics and Infrastructure | ||
| Seasonality Analysis | ||
| Saudi Arabia | Production Analysis (Area Harvested, Yield, and Production Volume) | |
| Consumption Analysis (Consumption Value and Volume) | ||
| Import Market Analysis (Import Value, Volume, and Key Supplying Markets) | ||
| Export Market Analysis (Export Value, Volume, and Key Destination Markets) | ||
| Wholesale Price Trend Analysis and Forecast | ||
| Regulatory Framework | ||
| List of Key Players | ||
| Logistics and Infrastructure | ||
| Seasonality Analysis | ||
| Africa | Egypt | Production Analysis (Area Harvested, Yield, and Production Volume) |
| Consumption Analysis (Consumption Value and Volume) | ||
| Import Market Analysis (Import Value, Volume, and Key Supplying Markets) | ||
| Export Market Analysis (Export Value, Volume, and Key Destination Markets) | ||
| Wholesale Price Trend Analysis and Forecast | ||
| Regulatory Framework | ||
| List of Key Players | ||
| Logistics and Infrastructure | ||
| Seasonality Analysis | ||
| South Africa | Production Analysis (Area Harvested, Yield, and Production Volume) | |
| Consumption Analysis (Consumption Value and Volume) | ||
| Import Market Analysis (Import Value, Volume, and Key Supplying Markets) | ||
| Export Market Analysis (Export Value, Volume, and Key Destination Markets) | ||
| Wholesale Price Trend Analysis and Forecast | ||
| Regulatory Framework | ||
| List of Key Players | ||
| Logistics and Infrastructure | ||
| Seasonality Analysis | ||
| Kenya | Production Analysis (Area Harvested, Yield, and Production Volume) | |
| Consumption Analysis (Consumption Value and Volume) | ||
| Import Market Analysis (Import Value, Volume, and Key Supplying Markets) | ||
| Export Market Analysis (Export Value, Volume, and Key Destination Markets) | ||
| Wholesale Price Trend Analysis and Forecast | ||
| Regulatory Framework | ||
| List of Key Players | ||
| Logistics and Infrastructure | ||
| Seasonality Analysis | ||
| By Geography | North America | United States | Production Analysis (Area Harvested, Yield, and Production Volume) |
| Consumption Analysis (Consumption Value and Volume) | |||
| Import Market Analysis (Import Value, Volume, and Key Supplying Markets) | |||
| Export Market Analysis (Export Value, Volume, and Key Destination Markets) | |||
| Wholesale Price Trend Analysis and Forecast | |||
| Regulatory Framework | |||
| List of Key Players | |||
| Logistics and Infrastructure | |||
| Seasonality Analysis | |||
| Mexico | Production Analysis (Area Harvested, Yield, and Production Volume) | ||
| Consumption Analysis (Consumption Value and Volume) | |||
| Import Market Analysis (Import Value, Volume, and Key Supplying Markets) | |||
| Export Market Analysis (Export Value, Volume, and Key Destination Markets) | |||
| Wholesale Price Trend Analysis and Forecast | |||
| Regulatory Framework | |||
| List of Key Players | |||
| Logistics and Infrastructure | |||
| Seasonality Analysis | |||
| Canada | Production Analysis (Area Harvested, Yield, and Production Volume) | ||
| Consumption Analysis (Consumption Value and Volume) | |||
| Import Market Analysis (Import Value, Volume, and Key Supplying Markets) | |||
| Export Market Analysis (Export Value, Volume, and Key Destination Markets) | |||
| Wholesale Price Trend Analysis and Forecast | |||
| Regulatory Framework | |||
| List of Key Players | |||
| Logistics and Infrastructure | |||
| Seasonality Analysis | |||
| Europe | Germany | Production Analysis (Area Harvested, Yield, and Production Volume) | |
| Consumption Analysis (Consumption Value and Volume) | |||
| Import Market Analysis (Import Value, Volume, and Key Supplying Markets) | |||
| Export Market Analysis (Export Value, Volume, and Key Destination Markets) | |||
| Wholesale Price Trend Analysis and Forecast | |||
| Regulatory Framework | |||
| List of Key Players | |||
| Logistics and Infrastructure | |||
| Seasonality Analysis | |||
| United Kingdom | Production Analysis (Area Harvested, Yield, and Production Volume) | ||
| Consumption Analysis (Consumption Value and Volume) | |||
| Import Market Analysis (Import Value, Volume, and Key Supplying Markets) | |||
| Export Market Analysis (Export Value, Volume, and Key Destination Markets) | |||
| Wholesale Price Trend Analysis and Forecast | |||
| Regulatory Framework | |||
| List of Key Players | |||
| Logistics and Infrastructure | |||
| Seasonality Analysis | |||
| France | Production Analysis (Area Harvested, Yield, and Production Volume) | ||
| Consumption Analysis (Consumption Value and Volume) | |||
| Import Market Analysis (Import Value, Volume, and Key Supplying Markets) | |||
| Export Market Analysis (Export Value, Volume, and Key Destination Markets) | |||
| Wholesale Price Trend Analysis and Forecast | |||
| Regulatory Framework | |||
| List of Key Players | |||
| Logistics and Infrastructure | |||
| Seasonality Analysis | |||
| Poland | Production Analysis (Area Harvested, Yield, and Production Volume) | ||
| Consumption Analysis (Consumption Value and Volume) | |||
| Import Market Analysis (Import Value, Volume, and Key Supplying Markets) | |||
| Export Market Analysis (Export Value, Volume, and Key Destination Markets) | |||
| Wholesale Price Trend Analysis and Forecast | |||
| Regulatory Framework | |||
| List of Key Players | |||
| Logistics and Infrastructure | |||
| Seasonality Analysis | |||
| Italy | Production Analysis (Area Harvested, Yield, and Production Volume) | ||
| Consumption Analysis (Consumption Value and Volume) | |||
| Import Market Analysis (Import Value, Volume, and Key Supplying Markets) | |||
| Export Market Analysis (Export Value, Volume, and Key Destination Markets) | |||
| Wholesale Price Trend Analysis and Forecast | |||
| Regulatory Framework | |||
| List of Key Players | |||
| Logistics and Infrastructure | |||
| Seasonality Analysis | |||
| Spain | Production Analysis (Area Harvested, Yield, and Production Volume) | ||
| Consumption Analysis (Consumption Value and Volume) | |||
| Import Market Analysis (Import Value, Volume, and Key Supplying Markets) | |||
| Export Market Analysis (Export Value, Volume, and Key Destination Markets) | |||
| Wholesale Price Trend Analysis and Forecast | |||
| Regulatory Framework | |||
| List of Key Players | |||
| Logistics and Infrastructure | |||
| Seasonality Analysis | |||
| Russia | Production Analysis (Area Harvested, Yield, and Production Volume) | ||
| Consumption Analysis (Consumption Value and Volume) | |||
| Import Market Analysis (Import Value, Volume, and Key Supplying Markets) | |||
| Export Market Analysis (Export Value, Volume, and Key Destination Markets) | |||
| Wholesale Price Trend Analysis and Forecast | |||
| Regulatory Framework | |||
| List of Key Players | |||
| Logistics and Infrastructure | |||
| Seasonality Analysis | |||
| Asia-Pacific | China | Production Analysis (Area Harvested, Yield, and Production Volume) | |
| Consumption Analysis (Consumption Value and Volume) | |||
| Import Market Analysis (Import Value, Volume, and Key Supplying Markets) | |||
| Export Market Analysis (Export Value, Volume, and Key Destination Markets) | |||
| Wholesale Price Trend Analysis and Forecast | |||
| Regulatory Framework | |||
| List of Key Players | |||
| Logistics and Infrastructure | |||
| Seasonality Analysis | |||
| India | Production Analysis (Area Harvested, Yield, and Production Volume) | ||
| Consumption Analysis (Consumption Value and Volume) | |||
| Import Market Analysis (Import Value, Volume, and Key Supplying Markets) | |||
| Export Market Analysis (Export Value, Volume, and Key Destination Markets) | |||
| Wholesale Price Trend Analysis and Forecast | |||
| Regulatory Framework | |||
| List of Key Players | |||
| Logistics and Infrastructure | |||
| Seasonality Analysis | |||
| Japan | Production Analysis (Area Harvested, Yield, and Production Volume) | ||
| Consumption Analysis (Consumption Value and Volume) | |||
| Import Market Analysis (Import Value, Volume, and Key Supplying Markets) | |||
| Export Market Analysis (Export Value, Volume, and Key Destination Markets) | |||
| Wholesale Price Trend Analysis and Forecast | |||
| Regulatory Framework | |||
| List of Key Players | |||
| Logistics and Infrastructure | |||
| Seasonality Analysis | |||
| Australia | Production Analysis (Area Harvested, Yield, and Production Volume) | ||
| Consumption Analysis (Consumption Value and Volume) | |||
| Import Market Analysis (Import Value, Volume, and Key Supplying Markets) | |||
| Export Market Analysis (Export Value, Volume, and Key Destination Markets) | |||
| Wholesale Price Trend Analysis and Forecast | |||
| Regulatory Framework | |||
| List of Key Players | |||
| Logistics and Infrastructure | |||
| Seasonality Analysis | |||
| South America | Brazil | Production Analysis (Area Harvested, Yield, and Production Volume) | |
| Consumption Analysis (Consumption Value and Volume) | |||
| Import Market Analysis (Import Value, Volume, and Key Supplying Markets) | |||
| Export Market Analysis (Export Value, Volume, and Key Destination Markets) | |||
| Wholesale Price Trend Analysis and Forecast | |||
| Regulatory Framework | |||
| List of Key Players | |||
| Logistics and Infrastructure | |||
| Seasonality Analysis | |||
| Argentina | Production Analysis (Area Harvested, Yield, and Production Volume) | ||
| Consumption Analysis (Consumption Value and Volume) | |||
| Import Market Analysis (Import Value, Volume, and Key Supplying Markets) | |||
| Export Market Analysis (Export Value, Volume, and Key Destination Markets) | |||
| Wholesale Price Trend Analysis and Forecast | |||
| Regulatory Framework | |||
| List of Key Players | |||
| Logistics and Infrastructure | |||
| Seasonality Analysis | |||
| Chile | Production Analysis (Area Harvested, Yield, and Production Volume) | ||
| Consumption Analysis (Consumption Value and Volume) | |||
| Import Market Analysis (Import Value, Volume, and Key Supplying Markets) | |||
| Export Market Analysis (Export Value, Volume, and Key Destination Markets) | |||
| Wholesale Price Trend Analysis and Forecast | |||
| Regulatory Framework | |||
| List of Key Players | |||
| Logistics and Infrastructure | |||
| Seasonality Analysis | |||
| Middle East | United Arab Emirates | Production Analysis (Area Harvested, Yield, and Production Volume) | |
| Consumption Analysis (Consumption Value and Volume) | |||
| Import Market Analysis (Import Value, Volume, and Key Supplying Markets) | |||
| Export Market Analysis (Export Value, Volume, and Key Destination Markets) | |||
| Wholesale Price Trend Analysis and Forecast | |||
| Regulatory Framework | |||
| List of Key Players | |||
| Logistics and Infrastructure | |||
| Seasonality Analysis | |||
| Turkey | Production Analysis (Area Harvested, Yield, and Production Volume) | ||
| Consumption Analysis (Consumption Value and Volume) | |||
| Import Market Analysis (Import Value, Volume, and Key Supplying Markets) | |||
| Export Market Analysis (Export Value, Volume, and Key Destination Markets) | |||
| Wholesale Price Trend Analysis and Forecast | |||
| Regulatory Framework | |||
| List of Key Players | |||
| Logistics and Infrastructure | |||
| Seasonality Analysis | |||
| Saudi Arabia | Production Analysis (Area Harvested, Yield, and Production Volume) | ||
| Consumption Analysis (Consumption Value and Volume) | |||
| Import Market Analysis (Import Value, Volume, and Key Supplying Markets) | |||
| Export Market Analysis (Export Value, Volume, and Key Destination Markets) | |||
| Wholesale Price Trend Analysis and Forecast | |||
| Regulatory Framework | |||
| List of Key Players | |||
| Logistics and Infrastructure | |||
| Seasonality Analysis | |||
| Africa | Egypt | Production Analysis (Area Harvested, Yield, and Production Volume) | |
| Consumption Analysis (Consumption Value and Volume) | |||
| Import Market Analysis (Import Value, Volume, and Key Supplying Markets) | |||
| Export Market Analysis (Export Value, Volume, and Key Destination Markets) | |||
| Wholesale Price Trend Analysis and Forecast | |||
| Regulatory Framework | |||
| List of Key Players | |||
| Logistics and Infrastructure | |||
| Seasonality Analysis | |||
| South Africa | Production Analysis (Area Harvested, Yield, and Production Volume) | ||
| Consumption Analysis (Consumption Value and Volume) | |||
| Import Market Analysis (Import Value, Volume, and Key Supplying Markets) | |||
| Export Market Analysis (Export Value, Volume, and Key Destination Markets) | |||
| Wholesale Price Trend Analysis and Forecast | |||
| Regulatory Framework | |||
| List of Key Players | |||
| Logistics and Infrastructure | |||
| Seasonality Analysis | |||
| Kenya | Production Analysis (Area Harvested, Yield, and Production Volume) | ||
| Consumption Analysis (Consumption Value and Volume) | |||
| Import Market Analysis (Import Value, Volume, and Key Supplying Markets) | |||
| Export Market Analysis (Export Value, Volume, and Key Destination Markets) | |||
| Wholesale Price Trend Analysis and Forecast | |||
| Regulatory Framework | |||
| List of Key Players | |||
| Logistics and Infrastructure | |||
| Seasonality Analysis | |||


Key Questions Answered in the Report
What is the projected global value of wheat sales by 2031?
Sales are projected to reach USD 248.32 billion by 2031, reflecting a 4.58% compound annual growth rate between 2026 and 2031.
Which region currently consumes the most wheat?
Asia-Pacific leads consumption, accounting for 37.2% of global demand in 2025.
Why are biofuel programs important for wheat demand?
Renewable-fuel mandates in the United States, European Union, and emerging adopters such as Brazil create a structural floor for industrial wheat use, lifting demand for lower-grade and surplus grain.
How do fertilizer price swings influence wheat production?
Volatile nitrogen and phosphate costs can reduce application rates on small farms, cutting yields by up to 20% and squeezing farmer margins.
What technologies are helping wheat growers adapt to climate change?
Heat-tolerant seed varieties and satellite-based yield-forecasting platforms enable growers to sustain yields under rising temperatures and optimize input use.
Page last updated on:


