
Anti-Counterfeit Packaging Market Size and Share
Market Overview
| Study Period | 2020 - 2031 |
|---|---|
| Market Size (2026) | USD 222.14 Billion |
| Market Size (2031) | USD 388.69 Billion |
| Growth Rate (2026 - 2031) | 11.84 % |
| Fastest Growing Market | Asia Pacific |
| Largest Market | North America |
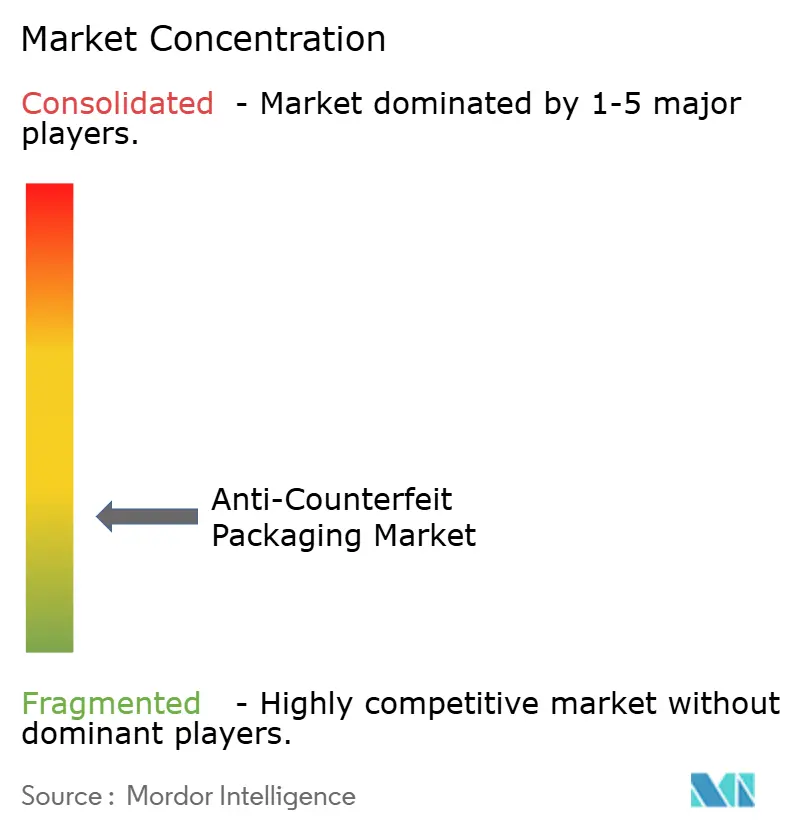
| Market Concentration | Low |
Major Players *Disclaimer: Major Players sorted in no particular order Image © Mordor Intelligence. Reuse requires attribution under CC BY 4.0. | |
Anti-Counterfeit Packaging Market Analysis by Mordor Intelligence
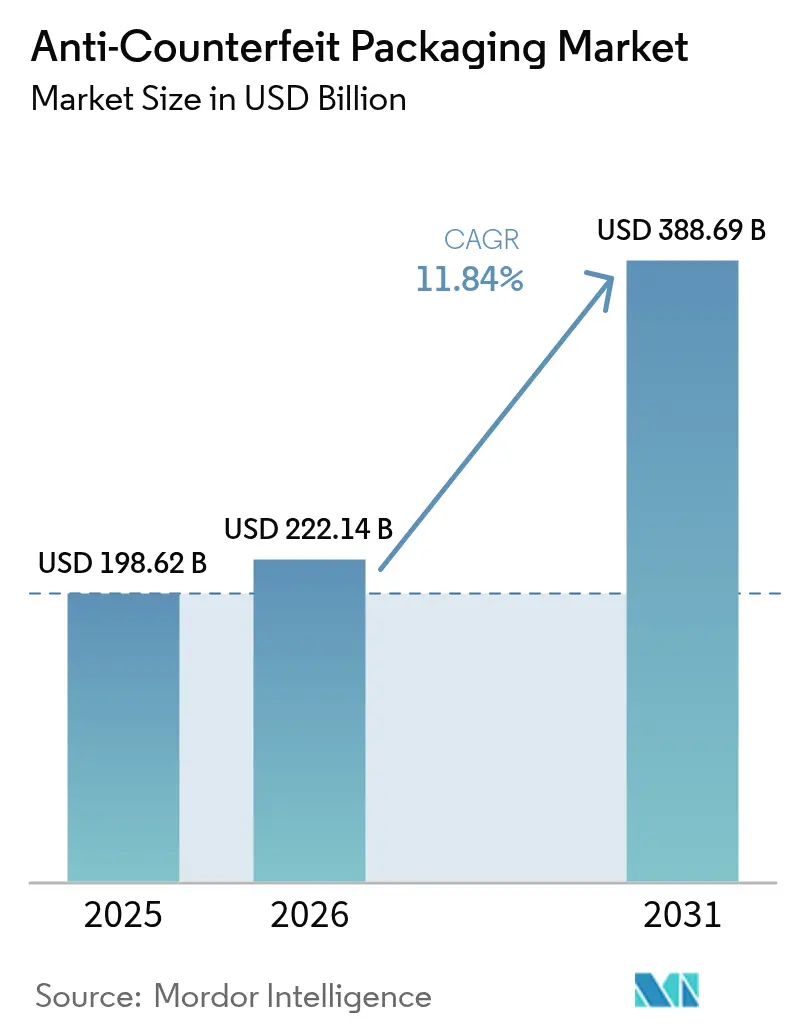
Anti-Counterfeit Packaging market size in 2026 is estimated at USD 222.14 billion, growing from 2025 value of USD 198.62 billion with 2031 projections showing USD 388.69 billion, growing at 11.84% CAGR over 2026-2031. Rising counterfeit sophistication, the spread of generative-AI printing, and a wave of tighter global traceability laws continue to enlarge the addressable opportunity for security technologies. Pharmaceutical serialization deadlines in the United States and the European Union anchor a sizable base of recurring demand, while new food, electronics, and luxury-goods mandates open fresh growth lanes. Brand owners increasingly look beyond visible holograms to multi-layered solutions that blend covert nano-pigment inks, mobile-readable digital watermarks, and blockchain provenance, ensuring that packages defend themselves throughout e-commerce fulfilment and reverse logistics. Large converters face material-cost inflation yet keep investing in embedded RFID and invisible watermarking because operating data show counterfeit incursions erode brand equity faster than packaging outlays rise. Venture investment stays healthy thanks to evidence that connected packs can double consumer-engagement time, turning security spend into a marketing asset.
Key Report Takeaways
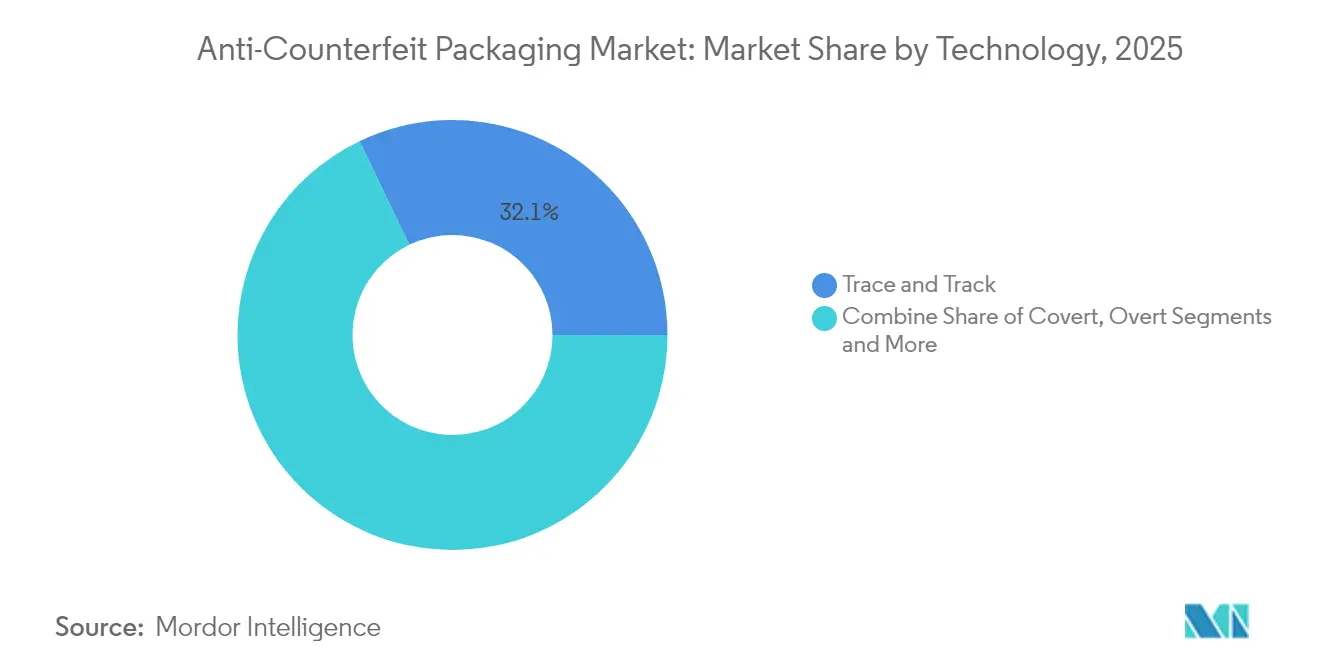
- By technology, Trace and Track systems held 32.12% of Anti-Counterfeit Packaging market share in 2025; Forensic Markers post the highest forecast CAGR at 15.1% to 2031.
- By usage feature, Serialization Codes captured 35.95% share in 2025, while RFID/NFC Tags are set to expand at 16.28% CAGR through 2031.
- By packaging component, Labels and Tags commanded 32.84% revenue in 2025; Security Inks and Coatings grow the fastest at 14.62% CAGR to 2031.
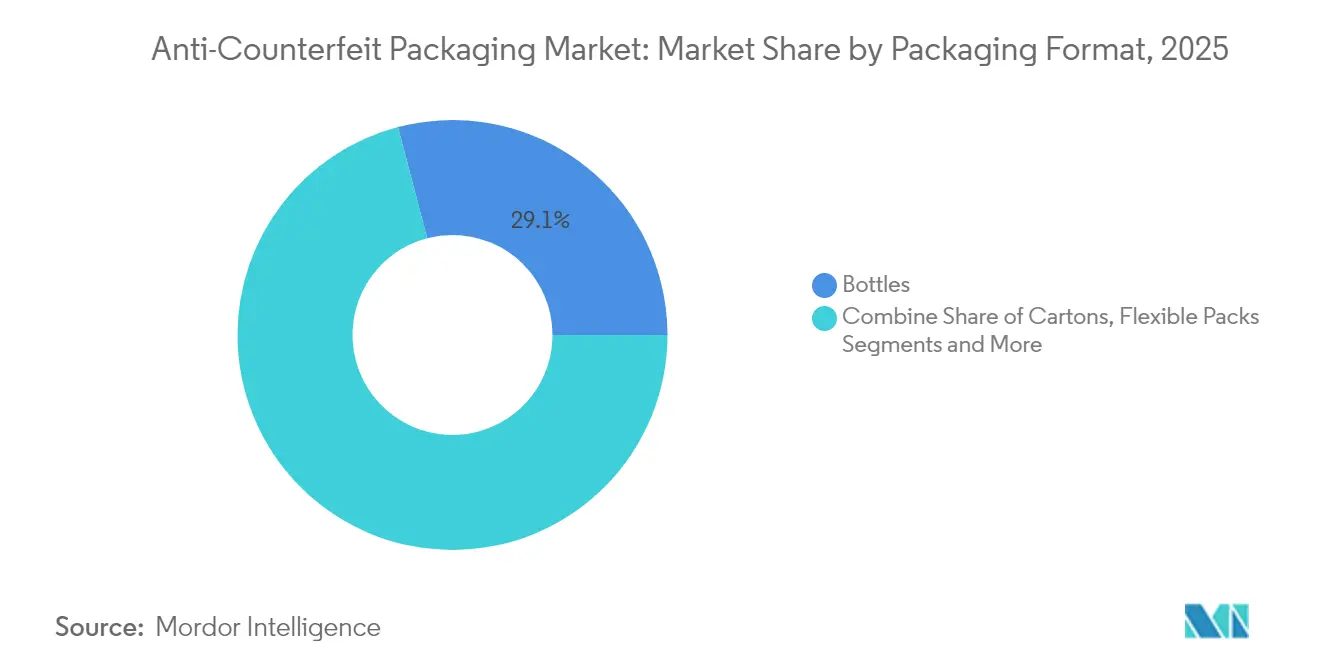
- By packaging format, Bottles led with 29.08% share in 2025, whereas Flexible Packs pace the field at 16.28% CAGR, driven by e-commerce fulfilment needs.
- By end-user sector, Healthcare and Pharmaceuticals retained 30.02% share in 2025; Consumer Electronics records the fastest 15.05% CAGR owing to premium-device counterfeiting.
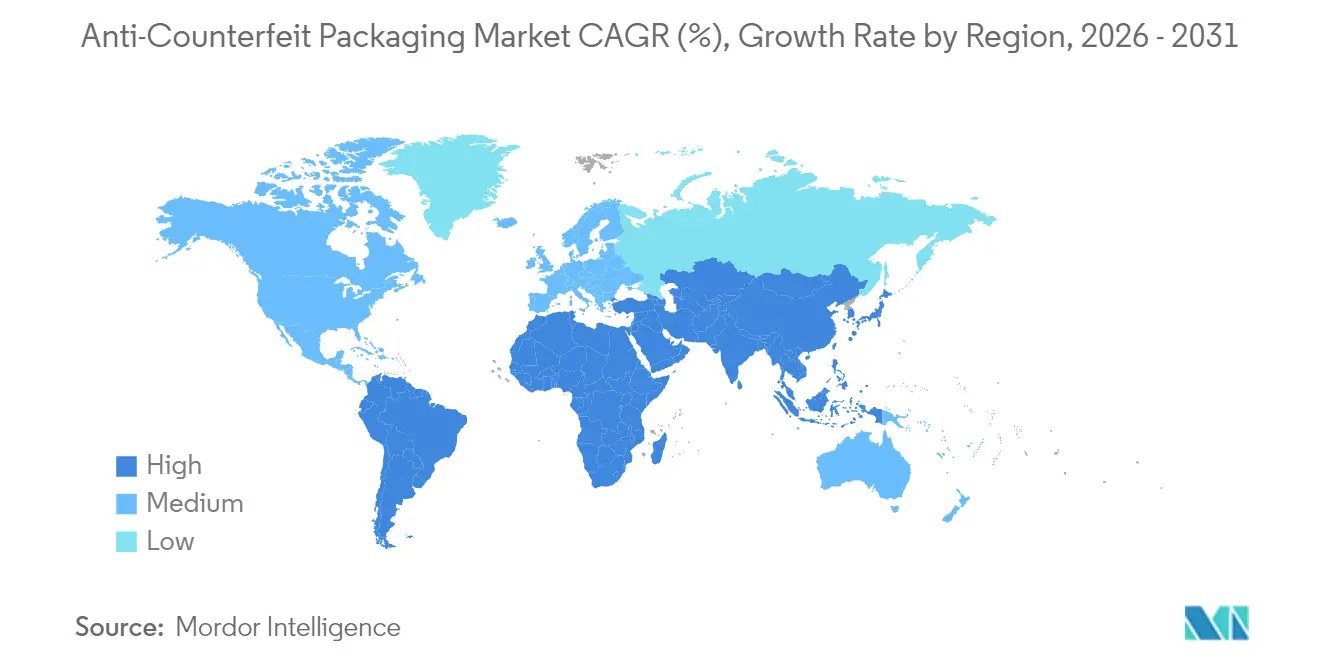
- By geography, North America dominated with 38.64% share in 2025, while Asia-Pacific accelerates at 15.72% CAGR, spurred by China’s stricter labeling code.
Note: Market size and forecast figures in this report are generated using Mordor Intelligence’s proprietary estimation framework, updated with the latest available data and insights as of 2026.
Market Trends and Insights
Drivers Impact Analysis of Anti-Counterfeit Packaging Market*
| Driver | (~) % Impact on CAGR Forecast | Geographic Relevance | Impact Timeline |
|---|---|---|---|
| Rapid e-commerce-driven serialization demand | +2.8% | Global, with concentration in North America & EU | Short term (≤ 2 years) |
| Proliferation of national track-and-trace mandates | +3.2% | North America & EU primary, APAC emerging | Medium term (2-4 years) |
| Expansion of QR/NFC-enabled connected packaging | +2.1% | Global, with early adoption in developed markets | Medium term (2-4 years) |
| Nano-pigment security inks enabling low-cost authentication | +1.9% | Global manufacturing hubs, Asia-Pacific focus | Long term (≥ 4 years) |
| Blockchain-based provenance pilots maturing into roll-outs | +1.5% | North America & EU leading, selective APAC adoption | Long term (≥ 4 years) |
| AI image-forensics integrated into consumer apps | +1.2% | Global, technology-forward markets first | Long term (≥ 4 years) |
| Source: Mordor Intelligence | |||
Rapid e-commerce-driven serialization demand
Surging online sales shorten distribution chains and remove physical inspection points, forcing brands to embed unit-level digital identifiers that travel with every parcel. RFID pilots between Avery Dennison and US grocery chains show scan rates above 99% accuracy, confirming that serialized data flow improves both inventory turns and counterfeit detection. [1]Cloud dashboards now fit into fulfilment apps, so retailers block suspected fakes before last-mile dispatch, preserving shopper trust. The trend shifts cap-ex priority toward print-on-demand coders and away from decorative embellishments, raising the strategic value of software-ready converters in the Anti-Counterfeit Packaging market.
Proliferation of national track-and-trace mandates
After the United States enforced DSCSA unit-level traceability in late-2024, pharmaceutical exporters equipped plants worldwide with EPCIS-ready coding platforms to avoid dual inventories. The European Union’s FMD introduced parallel serialization and tamper-evident rules, prompting a template that Brazil, Saudi Arabia, and Thailand study for rollout. When regulations converge, vendors in the Anti-Counterfeit Packaging market win multi-country service contracts and amortize R&D faster, reinforcing scale advantages.
Expansion of QR/NFC-enabled connected packaging
Regulators in India now oblige top-selling medicines to carry QR codes that point to cloud repositories, while consumer-goods majors embed NFC chips so users tap phones to unlock loyalty perks. Digimarc’s watermark trials with Procter & Gamble cut counterfeit detection times by 60%, proving that invisible codes withstand image compression on social feeds. Brands thus repurpose security spend into digital-marketing infrastructure, expanding solution budgets inside the Anti-Counterfeit Packaging market.
Nano-pigment security inks enabling low-cost authentication
Flexographic formulations doped with TiO₂ and ZnO nanoparticles create spectral signatures that only FTIR readers detect, adding hidden layers at marginal ink cost. [2] DuPont’s drupa 2024 launch of low-viscosity Artistri inks shows large chemical incumbents aligning with printer OEMs to mainstream nano-pigment capability. [3]As volumes scale, unit economics favor mass brands that long skipped advanced features, broadening the Anti-Counterfeit Packaging market addressable base.
Restraints Impact Analysis of Anti-Counterfeit Packaging Market*
| Restraint | (~)% Impact on CAGR Forecast | Geographic Relevance | Impact Timeline |
|---|---|---|---|
| High capex for full-line serialization retro-fits | -2.1% | Global manufacturing centers, particularly Asia-Pacific | Short term (≤ 2 years) |
| Inter-operability gaps between global coding standards | -1.8% | Multi-regional supply chains, cross-border trade routes | Medium term (2-4 years) |
| Data-privacy and cybersecurity liabilities in cloud TandT | -1.4% | North America & EU primary, expanding to APAC | Medium term (2-4 years) |
| Counterfeiters' rapid adoption of generative printing | -1.2% | Global, with concentration in manufacturing hubs | Long term (≥ 4 years) |
| Source: Mordor Intelligence | |||
High capex for full-line serialization retro-fits
Legacy fillers and cartoners often lack space for vision cameras and reject stations, so firms must buy new turnkey lines rather than bolt-on modules. Although TraceLink’s no-code OPUS platform eases integration of data layers, hardware outlays still average USD 1 million per bottle line. Small generics players and contract packers in India and Vietnam defer upgrades, shrinking their accessible share of the Anti-Counterfeit Packaging market until financing improves.
Inter-operability gaps between global coding standards
GS1 EPCIS schemas exist, yet transport layers and reporting file specs differ by regulator, forcing exporters to keep multiple middleware stacks. TraceLink secured all 16 GS1 US conformance trustmarks only after extensive custom parsing routines. Duplicate efforts increase IT cost per SKU and slow pilot cycles, diluting ROI for some adopters in the Anti-Counterfeit Packaging market.
*Our forecasts treat driver/restraint impacts as directional, not additive. The impact forecasts reflect baseline growth, mix effects, and variable interactions.
Anti-Counterfeit Packaging Market Segment Analysis
By Technology:
Regulatory mandates keep Trace and Track in commandIn 2025, Trace and Track solutions captured 32.12% of the Anti-Counterfeit Packaging market, equal to an Anti-Counterfeit Packaging market size of roughly USD 63.8 billion, while Forensic Markers are projected to post a brisk 15.1% CAGR to 2031. Serialization hardware, vision inspection, and cloud vaults form a compliance backbone that pharmaceutical lines cannot sidestep. As counterfeiters mimic overt holograms with AI-guided presses, brands pivot to covert DNA inks and forensic taggants that require lab-grade readers, pushing solution diversity within the Anti-Counterfeit Packaging market.
Generative-AI printing tools now replicate guilloché patterns and kinetic micro-text with startling fidelity, cutting the deterrent value of purely visible marks. Research at MIT on terahertz-wave ID tags opens hope for tamper-proof physical-fingerprint systems that link packages to a unique spectral signature. Vendors selling hybrid traceability plus forensic stacks, therefore, command higher margins and lengthier service contracts.

By Usage Feature:
Serialization Codes maintain dominance while RFID/NFC scales fastSerialization Codes owned 35.95% of Anti-Counterfeit Packaging market share in 2025, supplying the backbone for DSCSA and FMD compliance; RFID/NFC, at a 16.28% CAGR, outpaces all other features as smartphone adoption universalizes contactless reading. Pack-level GS1 Digital Link formats now bind EPC codes to web-resolvable URLs, so consumers verify goods inside shopping apps.
Holographic seals still appear on spirits and luxury cosmetics because visual flair complements brand aesthetics. Yet digital watermarks, embedded invisibly in artwork, allow zero-ink alterations during line changeovers. Digimarc’s integration of such marks into the C2PA 2.1 standard shows how packaging and online imagery share one verification protocol. This convergence increases subscription revenue pools inside the Anti-Counterfeit Packaging market.
By Packaging Component:
Labels and Tags keep the lead as inks race aheadLabels and Tags represented 32.84% of total spend in 2025, yet Security Inks and Coatings will likely outrun them through a 14.62% CAGR as converters blend nano-pigments straight into flexo units. Embedding authentication within the print layer prevents label swapping and lowers changeover downtime.
Simultaneously, converters promote linerless facestock to curb waste, aligning security with sustainability. Films and pouches seize flexible-pack growth, adding metallized layers that double as light barriers and covert optical filters. Hologram suppliers fight commoditization by experimenting with volume Bragg gratings that sparkle at lower microns, defending a premium niche of the Anti-Counterfeit Packaging market.
By Packaging Format:
Flexible Packs pace growth while bottles stay foundationalBottles, notably in oral solids and beverages, accounted for 29.08% of 2025 revenue. Still, flexible packs chart a 16.28% CAGR as e-commerce shippers prefer lightweight, durable sachets that survive last-mile drops. QR-enabled pouches now carry freshness data and expiry alarms, enhancing value.
Cartons keep relevance because large printable panels host overt and covert layers in one pass. Blister packs stay indispensable where unit-dose accountability matters, though slower growth suggests saturation. Overall, line versatility guides capital flows, with packers weighing SKU complexity against the ROI every Anti-Counterfeit Packaging market upgrade promises.
By End-User Industry:
Electronics outlook brightens as drugs anchor volumeHealthcare and Pharmaceuticals controlled 30.02% of spending in 2025, a pillar that ensures baseline orders for mandatory serial numbers and tamper-evident rings. The segment’s recurring maintenance fees give suppliers steady cash, lowering portfolio risk.
Consumer Electronics projects a 15.05% CAGR thanks to high-margin gadgets that face organized counterfeit rings. NFC-enabled boxes allow instant warranty activation, turning packages into service gateways. Food and beverage brands climb the adoption curve too, as origin labeling rules stiffen in China and the EU. Each new vertical widens the Anti-Counterfeit Packaging market and spreads fixed platform costs over more SKUs.
Geography Analysis
North America Anti-Counterfeit Packaging Market
North America retained 38.64% revenue in 2025, buoyed by full DSCSA enforcement and a dense network of CMOs that need turnkey coding, inspection, and data-exchange stacks. Canada’s Plastics Pact also nudges converters to blend security and recyclability, favoring fiber-based packs that carry invisible watermark tracers enabling automated sortation. Mexico, intertwined with US supply chains, ramps anti-counterfeit adoption in medical devices and tequila exports to safeguard market access.
APAC Anti-Counterfeit Packaging Market
Asia-Pacific registers the swiftest 15.72% CAGR, driven by China’s new pre-packaged labeling law, India’s QR-code drug lists, and Japan’s Positive List for food-contact resins. Contract manufacturers across Guangdong and Ho Chi Minh City deploy low-cost inkjet coders and blockchain pilots to satisfy multinational audits. Flexible-pack printers in Indonesia install nano-pigment stations after early ROI studies show counterfeit returns fall by half within one year, proving the Anti-Counterfeit Packaging market’s potential beyond legacy pharma hubs.
EMEA Anti-Counterfeit Packaging Market
Europe holds a mature but sizable share, with FMD and the upcoming Packaging and Packaging Waste Regulation intertwining sustainability and security. Brands explore fibre-based barrier packs paired with Digimarc watermarks so automated sorters read signals through dirt and glare. Russia’s PET bans and the EU’s BPA prohibition push resin switchovers, which in turn invite fresh security print trials. The Middle East and Africa remain nascent, yet luxury auto-parts suppliers in the Gulf invest in 2D code vaults to reassure global buyers, hinting at a wider Anti-Counterfeit Packaging market take-off once regional customs unions finalize common coding laws.
Regulatory Landscape
Pharmaceutical regulations remain the clearest demand anchor for anti-counterfeit packaging globally. In the United States, the Drug Supply Chain Security Act (DSCSA) has entrenched unit-level traceability as a packaging requirement, with serialized identifiers commonly carried via GS1 DataMatrix. In March 2026, the US FDA also published a final rule requiring a uniform 12-digit National Drug Code (NDC) format, a structural coding change that reinforces long-horizon packaging line and master-data investments, even though the transition timetable extends into the 2030s. In Europe, the Falsified Medicines Directive framework (Commission Delegated Regulation (EU) 2016/161) continues to require both a unique identifier and an anti-tampering device on prescription medicines, keeping tamper-evident designs, print quality controls, and verification-system connectivity central to compliant packs.
Outside medicines, online and marketplace-focused enforcement regimes increasingly intersect with packaging authentication workflows. The EU Digital Services Act and the US INFORM Consumers Act place more responsibility on marketplaces to verify sellers and manage counterfeit risk, which raises the value of packaging-linked digital proofs (QR/NFC/digital watermark links to authoritative product records) that can be checked across e-commerce fulfillment and returns. Standards development also shapes technical choices, with EN ISO 21976:2020 used for testing tamper-verification performance on medicinal packaging, and national implementations such as Italy aligning domestic law with EU safety-feature rules (including the February 2025 entry into force of Legislative Decree no. 10).
Competitive Landscape
The Anti-Counterfeit Packaging market stays moderately fragmented. Conglomerates such as Avery Dennison, 3M, and CCL Industries exploit scale to offer bundled RFID, labels, and cloud dashboards. Their global service networks reassure multinationals that serialization lines stay compliant across continents. Niche leaders like SICPA, AlpVision, and Digimarc capture premium segments with proprietary taggants, spectral fingerprinting, or digital watermark IP that counterfeiters find hard to crack.
Strategic moves center on capability convergence. Crane NXT’s USD 270 million purchase of OpSec Security merged micro-optics with banknote know-how, forming a cradle-to-grave brand-protection suite. 3M’s entry into the semiconductor consortium refines conductive adhesives that could double as covert circuitry on labels, expanding cross-selling routes [3M press release, Feb 2025]. Material inflation raises switching costs, so converters differentiate on total-cost analytics, showing clients how RFID inlays reduce write-offs that dwarf per-label price hikes.
Patent landscapes evolve quickly. Meta’s optical-modulation filings hint at next-gen holographic layers with dynamic imagery whose charge-carrier pattern shifts under polarized light. Start-ups test AI image-forensics that let customs officers confirm authenticity using smartphone cameras. Competitive intensity therefore hinges on software ecosystems as much as print chemistry, nudging traditional ink makers to partner with SaaS traceability portals and thus stay relevant within the Anti-Counterfeit Packaging market.
Anti-Counterfeit Packaging Industry Leaders
-
Avery Dennison Corporation
-
CCL Industries Inc.
-
3M Company
-
Zebra Technologies Corporation
-
E.I. Du Pont De Nemours and Company
- *Disclaimer: Major Players sorted in no particular order
Anti-Counterfeit Packaging Market Companies Covered in this Report
- Avery Dennison Corporation
- CCL Industries Inc.
- 3M Company
- DuPont de Nemours Inc.
- Zebra Technologies Corporation
- SICPA Holding SA
- AlpVision SA
- Applied DNA Sciences Inc.
- Uflex Limited
- Authentix Inc.
- Ampacet Corporation
- PharmaSecure Inc.
- Sun Chemical Corporation
- Alien Technology LLC
- Honeywell International Inc.
- TraceLink Inc.
- OPTEL Group
- Prooftag SAS
- Giesecke + Devrient GmbH
- SATO Holdings Corp.
Market Opportunities and Future Outlook
Digital Product Passport (DPP) programs and product-identity standardization are expanding anti-counterfeit packaging from brand protection into cross-functional compliance, data, and lifecycle reporting infrastructure. The EU Ecodesign for Sustainable Products Regulation (ESPR), in force since July 2024, sets the DPP direction with first mandatory requirements beginning in 2027. This creates near-term whitespace for solutions that connect physical security (tamper evidence, covert markers, secure inks) to interoperable digital identifiers that remain usable across multi-channel distribution. The June 2026 integration work announced by The Hashgraph Group and Merck, combining Merck M-Trust physical markers with a Hedera-based TrackTrace layer, points to hybrid models for EU DPP-related compliance use cases.
Healthcare traceability expansion beyond the US and EU also supports a near-term opportunity lane for packaging converters and technology providers, particularly where they can deploy at scale with manageable capex. India’s Union Health Ministry amended Drugs Rules in June 2026 to expand mandatory QR code traceability to additional categories including vaccines, antimicrobials, anti-cancer medicines, and narcotic drugs, with phased effective dates in 2027 and 2028. This supports demand for high-throughput coding, verification workflows, and data stewardship across a large manufacturer base. On the technical standards side, ISO published ISO 16791:2026 (March 2026) for machine-readable coding of medicinal product package identifiers, which can help standardize implementation across markets and strengthens the business case for multi-country, standards-aligned serialization and authentication platforms.
Recent Industry Developments in Anti-Counterfeit Packaging Market
- February 2026: Avery Dennison announced first-to-market integration of Pragmatic Semiconductor's NFC Connect flexible integrated circuit technology into its NFC inlay portfolio. The update expands options for smartphone-readable authentication and compliance use cases on packaging formats where conventional rigid chips are harder to deploy, supporting broader adoption of connected anti-counterfeit features.
- September 2025: Avery Dennison launched the AD Nanoblock HF/NFC inlay aimed at brand protection and product authentication in space-constrained packaging. The smaller-form-factor inlay supports anti-counterfeit deployment on compact packs and components, widening the addressable set of SKUs that can carry NFC-based verification without major packaging redesign.
- April 2024: 3M launched the 3M Verify app to help validate disposable respirator packaging against counterfeiting in real time. By pairing packaging identifiers with an end-user verification tool, the launch reinforced the shift toward consumer-accessible authentication workflows that extend security beyond the point of sale and into field inspection.
Anti-Counterfeit Packaging Market Report Scope and Research Methodology
Market Definition and Coverage
This market covers packaging features and solutions that help brands reduce counterfeiting by enabling authentication, traceability, and tamper evidence on product packs across major end users.
Scope exclusions: We do not count losses from counterfeiting, enforcement costs, or broader brand protection software that is not tied to packaging components.
Segments Covered in This Report
- By Technology
- Trace and Track
- Tamper-Evident
- Covert
- Overt
- Forensic Markers
- By Usage Feature
- Serialization Codes
- RFID / NFC Tags
- Holographic Seals
- Digital Watermarks
- By Packaging Component
- Labels and Tags
- Security Inks and Coatings
- Films and Pouches
- Holograms
- Other Packaging Component
- By Packaging Format
- Blister Packs
- Bottles
- Cartons
- Flexible Packs
- Other Packaging Format
- By End-User Industry
- Food and Beverage
- Healthcare and Pharmaceuticals
- Industrial and Automotive
- Consumer Electronics
- Other End-User Industry
- By Geography
- North America
- United States
- Canada
- Mexico
- Europe
- Germany
- United Kingdom
- France
- Italy
- Spain
- Russia
- Rest of Europe
- Asia-Pacific
- China
- India
- Japan
- South Korea
- Australia and New Zealand
- Rest of Asia-Pacific
- Middle East and Africa
- Middle East
- United Arab Emirates
- Saudi Arabia
- Turkey
- Rest of Middle East
- Africa
- South Africa
- Nigeria
- Egypt
- Rest of Africa
- Middle East
- South America
- Brazil
- Argentina
- Rest of South America
- North America
Data Sources, Market Sizing, and Validation
Desk Research
Desk research was used to set the market structure and build the first set of demand and supply signals for anti counterfeit packaging. We referenced public sources such as customs and trade statistics, packaging and printing association publications, regulator portals for serialization and track and trace requirements, and peer reviewed papers on authentication markers and security inks.
In addition, we reviewed company annual reports, investor presentations, product catalogs, and reputable press coverage to understand technology mix shifts across labels, inks, coatings, holograms, and tag based formats. For cross checks on company scale and geographic exposure, we used paid subscriptions that compile company financials and news, plus a patent database to track innovation activity around identifiers and covert features. These sources are not exhaustive, and we used other public references for data collection, validation, and clarification when gaps appeared.
Primary Interviews and Surveys
Primary work was used to pressure test assumptions that desk sources do not settle cleanly, especially pricing ranges, adoption timing, and the share of packaging lines upgraded with anti counterfeit features. We spoke with packaging converters, material and component suppliers, solution integrators, and end user teams in regulated industries, then reconciled differences across APAC, EMEA, and the Americas before finalizing the model.
Distribution of primary research fieldwork respondents
| Company type | Respondent position | Region |
|---|---|---|
| Top tier: 31% | CXOs: 21% | APAC: 40% |
| Mid tier: 48% | Functional/Unit leaders: 23% | EMEA: 36% |
| Smaller Players: 21% | Managers: 56% | Americas: 24% |
Market-Sizing & Forecasting
Sizing started with a top-down build that reconstructs the addressable packaging security spend using end use packaging output signals and the penetration of authentication, traceability, and tamper evident upgrades, then translated into value through typical pricing ranges by feature type. To keep totals realistic, we corroborated the results with selective bottom-up approximations, including sampled revenue roll ups for key component types and ASP times volume checks for labels, inks, and tags in high adoption end users.
Inputs that mattered most in this market included the mix of overt vs covert vs forensic features, the rollout pace of serialization and track and trace mandates in pharma and other regulated categories, unit volumes of packaged goods in priority end uses, typical replacement cycles for packaging lines, and the shift toward digital identifiers such as QR style codes and RFID or NFC tags. Where direct volume data was patchy, we filled gaps using proxy indicators, for example packaging output trends and trade flows for relevant materials, then rechecked them using interview ranges.
Forecasts were built using scenario analysis supported by simple trend smoothing on the key drivers. The final path was selected based on expert views on compliance deadlines, adoption friction, and expected pricing progression for major feature groups. Assumptions were kept transparent so the model can be repeated with updated inputs each year.
Data Validation & Update Cycle
Outputs were validated through triangulation across independent signals, including packaging output direction, adoption levels discussed by practitioners, and implied revenues from supplier activity. When results showed unusual jumps by region or technology, we revisited inputs, then triggered follow up outreach to confirm whether a regulatory event, supply constraint, or pricing shift was behind the change.
Before sign off, the model goes through multi step analyst review to check calculation logic, unit consistency, and currency conversions. The report is refreshed annually, with interim updates when material events affect regulations, costs, or adoption. Right before delivery, we complete a final pass so clients receive the most current view available.
Mordor Intelligence's Anti Counterfeit Packaging Market Size Compared Against Other Published Estimates
Published market sizes for anti counterfeit packaging often differ, even when the topic label looks the same, because each study draws the line around different features, end uses, and timing assumptions. Differences also show up in how pricing is treated for labels, inks, tags, and other components, and in whether adoption is counted as broad rollout or only confirmed deployments.
Some external estimates bundle a wider set of brand protection items and treat all forms of authentication as part of packaging spend. In Mordor Intelligence sizing, value is counted only when the feature is implemented as a packaging component or packaging format upgrade (for example, labels and tags, security inks and coatings, and related elements), then validated using adoption checks across regulated end users and regions.
Benchmark comparison
| Source | Market Size | Gaps in Research Methodology |
|---|---|---|
| Mordor Intelligence | USD 222.14 B (2026) | |
| Global Research Publisher A | USD 204.08 B (2025) | Uses a different base year and growth window, and the scope narrative leans more toward broad brand protection and authentication solutions, which can shift what is treated as packaging spend and how penetration is applied. |
| Industry Research Publisher B | USD 174.10 B (2024) | Anchors the model on a 2024 base and narrower country coverage, and it appears to apply different technology and application cut splits, which can undercount regions where adoption is accelerating later in the cycle. |
Taken together, the spread is mainly explained by base year choice and what gets counted as packaging related value versus adjacent protection spend. By keeping the inputs tied to adoption of packaging components and by rechecking pricing and penetration with practitioners, the final number stays traceable to clear drivers and repeatable steps.
Key Questions Answered in the Report
What is the current Anti-Counterfeit Packaging market size?
The Anti-Counterfeit Packaging market size reached USD 222.14 billion in 2026 and is forecast to hit USD 388.69 billion by 2031 at a 11.84% CAGR.
Which technology leads the Anti-Counterfeit Packaging market?
Trace and Track serialization systems lead, holding 32.12% share in 2025, due to mandatory compliance in pharmaceuticals and fast-moving consumer goods.
Which region grows the fastest in Anti-Counterfeit Packaging?
Asia-Pacific posts the highest 15.72% CAGR to 2031, propelled by China’s new labeling laws and India’s QR-code drug mandates.
How are brands integrating digital features into packs?
Companies blend QR codes, NFC tags, and digital watermarks with cloud platforms, letting consumers verify authenticity through smartphones while brands collect engagement data.
What restrains wider Anti-Counterfeit Packaging adoption?
High capital outlays for retrofitting serialization hardware and inconsistent coding standards across countries slow smaller manufacturers’ implementation pace.
Who are key players in the Anti-Counterfeit Packaging industry?
Major suppliers include Avery Dennison, 3M, CCL Industries, SICPA, AlpVision, and Digimarc, each leveraging unique combinations of labels, RFID, inks, or digital watermarks to protect products.