
Market Overview
| Study Period | 2020 - 2031 |
|---|---|
| Market Size (2026) | USD 12.3 Billion |
| Market Size (2031) | USD 19.98 Billion |
| Growth Rate (2026 - 2031) | 10.21 % |
| Fastest Growing Market | Europe |
| Largest Market | North America |
| Market Concentration | Medium |
Major Players *Disclaimer: Major Players sorted in no particular order Image © Mordor Intelligence. Reuse requires attribution under CC BY 4.0. | |
Smart Glass Market Analysis by Mordor Intelligence
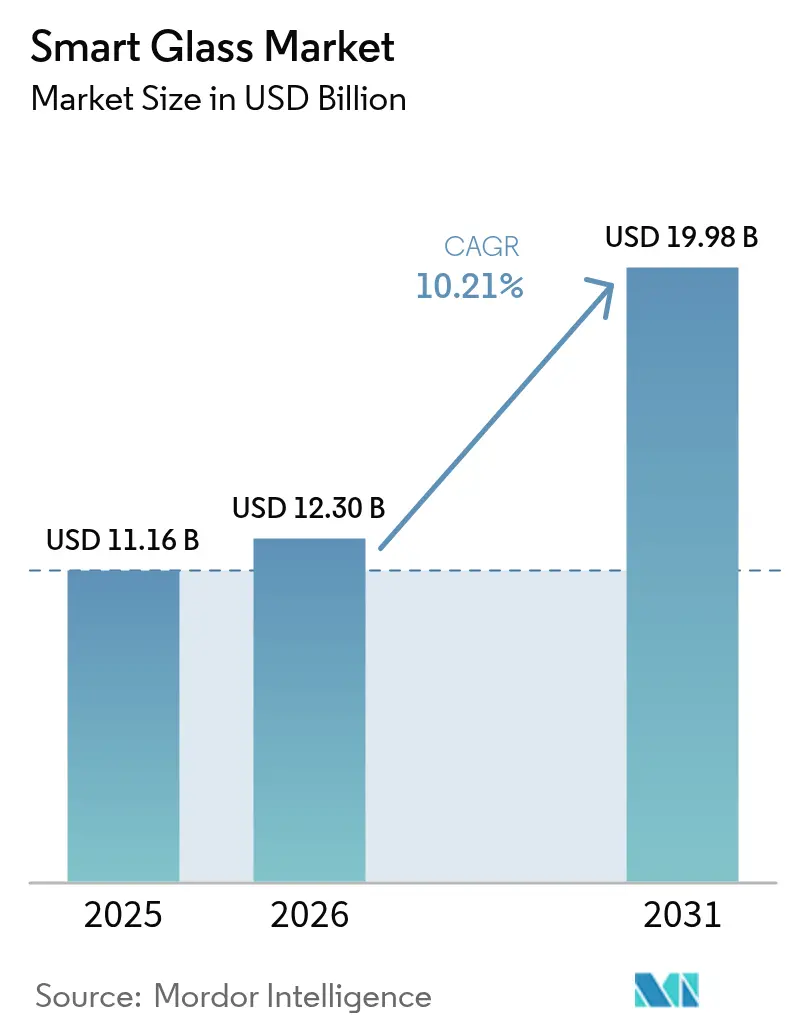
The smart glass market size is expected to grow from USD 11.16 billion in 2025 to USD 12.3 billion in 2026 and is forecast to reach USD 19.98 billion by 2031 at 10.21% CAGR over 2026-2031. This trajectory is propelled by mandatory energy-performance codes, electrochromic efficiency gains, and premium automotive adoption that shortens technology payback cycles. Commercial landlords are prioritizing HVAC cost control, automotive OEMs are bundling dynamic sunroofs into high-margin trims, and materials scientists are converging on electrode-free devices that lower production costs. Simultaneously, government incentives for advanced manufacturing and 5G-ready façades are enlarging the smart glass market opportunity set.[1]U.S. Department of Energy, “2024 International Energy Conservation Code impact analysis,” energy.gov
Key Report Takeaways
- By technology type, electrochromic products held 42.55% of smart glass market share in 2025 while hybrid photovoltaic variants are on track for an 17.62% CAGR to 2031.
- By end user, commercial architectural installations led with 37.68% revenue share in 2025; healthcare facilities are projected to advance at a 16.70% CAGR through 2031.
- By control mode, wired switch solutions retained 33.42% share of the smart glass market size in 2025, whereas sensor-based automatic systems will rise at a 13.08% CAGR to 2031.
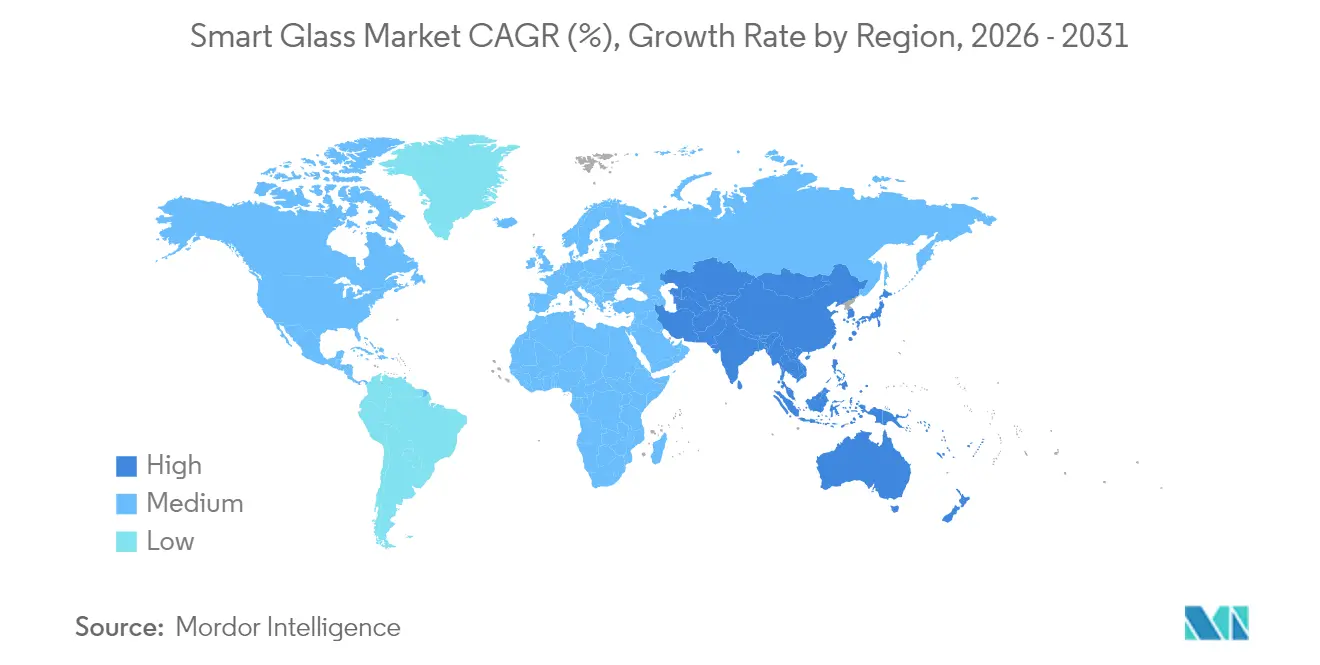
- By region, North America captured 34.22% of 2025 revenue, while Asia Pacific is set to post the fastest 14.05% CAGR during the outlook period.
- AGC, Saint-Gobain, and Gentex collectively commanded more than 30% of 2024 shipments, underscoring a moderately concentrated field
Note: Market size and forecast figures in this report are generated using Mordor Intelligence’s proprietary estimation framework, updated with the latest available data and insights as of 2026.
Market Trends and Insights
Drivers Impact Analysis of Smart Glass Market*
| Driver | ( ~ )% Impact on CAGR Forecast | Geographic Relevance | Impact Timeline |
|---|---|---|---|
| Stringent green-building codes and retrofit mandates | +2.8% | North America and EU, expanding to APAC | Medium term (2-4 years) |
| Rapid adoption in premium automotive glazing and sunroofs | +2.1% | Germany, Japan, China | Short term (≤ 2 years) |
| Energy-cost savings for commercial real-estate operators | +1.9% | Global, high-energy-cost regions | Long term (≥ 4 years) |
| IoT-ready glass-as-a-sensor platforms for smart buildings | +1.5% | North America, Europe, urban APAC | Medium term (2-4 years) |
| 5G/mm-wave friendly low-loss façade solutions | +1.2% | Core APAC, spill-over to North America | Medium term (2-4 years) |
| Post-COVID demand for antimicrobial, touch-free surfaces | +0.9% | Global, healthcare and commercial | Short term (≤ 2 years) |
| Source: Mordor Intelligence | |||
Stringent Green-Building Codes and Retrofit Mandates
Mandatory envelope performance thresholds such as California’s 2025 Building Energy Efficiency Standards are creating non-discretionary demand for electrochromic façades that outperform conventional glazing on U-factor and Solar Heat Gain Coefficient criteria. The 2024 International Energy Conservation Code revision delivers 9.8% incremental savings versus the prior cycle, eliminating trade-off loopholes and elevating glass performance baselines. Similar measures in Europe, including the Netherlands’ hybrid-furnace initiative, reinforce a compliance-driven procurement cycle that lifts retrofit activity. As owners witness lower peak cooling loads, green-finance eligibility, and enhanced asset values, the smart glass market gains a durable regulatory tailwind.
Rapid Adoption in Premium Automotive Glazing and Sunroofs
Automakers are deploying dynamic light-control roofs to differentiate cabins and trim HVAC loads. Renault’s Solarbay PDLC sunroof supplies segmental opacification while using nearly 50% recycled content.[2]Renault Group, “Solarbay PDLC sunroof launch,” renaultgroup.com AGC’s SPD-based Wonderlite roof on the Mercedes S-Class Coupé cuts air-conditioning demand and lowers tailpipe CO₂. Hyundai’s Nano Cooling Film shows mainstream migration by shaving interior temperatures by 12.33 °C in pilot fleets. Automotive design cycles of 3-5 years accelerate cost degression that cascades into the building sector, expanding the smart glass market addressable base.
Energy-Cost Savings for Commercial Real-Estate Operators
Electrochromic glazing can slice total building energy use up to 45%, and dedicated studies report 4.5%–9.4% electricity savings on air-conditioning depending on orientation.[3]MDPI, “Energy savings potential of electrochromic glass,” mdpi.com Istanbul office trials of PDLC windows registered 22% whole-building energy reductions alongside glare mitigation. Real estate investment trusts now embed dynamic glass ROI into valuation models, citing ESG compliance and tenant-retention benefits that shorten payback as electricity tariffs rise and material costs fall. These economies increase penetration in the smart glass market.
IoT-Ready Glass-as-a-Sensor Platforms for Smart Buildings
Smart glass is shifting from stand-alone shading toward multifunctional sensor nodes. WAVEANTENNA technology from AGC turns windows into 5G micro-base stations, solving indoor coverage gaps without bulky hardware. Building-automation vendors integrate occupancy, daylight, and temperature sensing to algorithmically modulate tint levels, a trajectory that explains the 13.42% CAGR for sensor-based controls. As global smart-building spending races toward USD 328.62 billion by 2029, glass that doubles as a data interface becomes foundational infrastructure.
Restraints Impact Analysis of Smart Glass Market*
| Restraint | ( ~ )% Impact on CAGR Forecast | Geographic Relevance | Impact Timeline |
|---|---|---|---|
| High upfront cost vs. conventional glazing | -1.8% | Global, price-sensitive markets | Short term (≤ 2 years) |
| Reliability issues in extreme climates | -1.2% | Hot and cold extremes | Medium term (2-4 years) |
| EMI-emission compliance limits for large EC façades | -0.9% | North America and EU | Medium term (2-4 years) |
| Supply bottlenecks for specialty EC precursors | -0.7% | Concentrated Asia Pacific | Short term (≤ 2 years) |
| Source: Mordor Intelligence | |||
High Upfront Cost vs. Conventional Glazing
Electrochromic windows still price at USD 180–250 m² against USD 20–30 m² for standard units. Analysts peg USD 215 m² (USD 20 ft²) as the crossover point for mass substitution, prompting an innovation race. Electrode-free electrochromic prototypes have sliced costs toward USD 80 m² by stripping indium-tin-oxide layers. Plasma-enhanced chemical vapor deposition promises costs near USD 5.26 m² at 1.4 million m² annual scale. Installation complexity is receding as contractor familiarity grows, but price resistance remains the foremost limiting factor in cost-sensitive slices of the smart glass market.
Reliability Issues in Extreme Climates
Temperature swings slow switching speeds and bleach optical contrast. Field tests reveal EC films lag in sub-zero environments, and prolonged heat causes tint non-uniformity. Titanium-doped tungsten-oxide devices now deliver 85% modulation and 95.61% cycling stability, mitigating both hot-weather degradation and freeze-thaw risks. Suppliers are offering climate-specific warranties while transitioning to solid-state electrolytes, yet long-term data across diverse geographies remains limited.
*Our forecasts treat driver/restraint impacts as directional, not additive. The impact forecasts reflect baseline growth, mix effects, and variable interactions.
Smart Glass Market Segment Analysis
By Technology Type:
Electrochromic Dominance Faces Hybrid ChallengeElectrochromic solutions dominated 2025 with 42.55% smart glass market share. Their low‐power operation, gradual tinting, and proven 50,000 cycle life make them the default choice for large façades and corporate campuses. The smart glass market size for electrochromic products is projected to expand from USD 4.75 billion in 2025 to USD 8.09 billion by 2031 at a 9.37% CAGR. Cost-out roadmaps ranging from in-line sputtering to all-solid-state chemistries keep capex budgets predictable. Meanwhile, hybrid photovoltaic glass is scaling at an 17.62% CAGR, leveraging transparent organic photovoltaics that already hit 12.3% cell efficiency in Denmark’s CitySolar project. NEXT Energy Technologies estimates these panels could offset 25% of typical office demand while retaining architectural clarity, positioning hybrids as the disruptor that challenges electrochromic incumbency.
Suspended Particle Device products maintain a niche where sub-second switching is critical—cockpits, rail cabins, and luxury sedans. Polymer-Dispersed Liquid Crystal windows are penetrating healthcare suites and conference rooms as low-voltage privacy partitions. Thermochromic and photochromic variants stay limited to passive climates, yet their wiring-free installation appeals to retrofit budgets. The technology stack is therefore bifurcating: electrochromic for energy mandates and hybrid PV for net-zero façades, with SPD and PDLC covering speed and privacy use cases.




By End User:
Healthcare Facilities Drive Fastest GrowthCommercial real-estate applications captured 37.68% of 2025 revenue through broad office and retail uptake. The segment relied on energy savings, daylight optimization, and ESG credentialing to justify premium costs. Smart glass market size for commercial real estate is forecast to grow at 9.21% CAGR, moving from USD 4.21 billion in 2025 to USD 7.15 billion in 2031. Healthcare, however, secures the steepest 16.70% CAGR as infection-control protocols privilege touch-free privacy. Intensive-care wards deploy instant-opaque PDLC panels to reduce curtain laundering, while psychiatric units harness break-resistant dynamic glass to balance patient oversight with dignity.
Automotive glazing remains the third revenue pillar, particularly within luxury and electric vehicles, where dynamic skylights offset battery-draining HVAC. Residential uptake is slower, but tax incentives and lower module prices are shifting the ROI narrative for high-performance homes. Aerospace, rail, and marine progress steadily, albeit off smaller bases, and consumer electronics experiment with miniaturized electrochromic screens and AR headsets.
By Control Mode:
Sensor-Based Systems Gain MomentumWired wall panels preserved a 33.42% share in 2025 because electricians are accustomed to low-voltage runs that dovetail with lighting circuits. Yet occupancy and daylight sensors embedded in the glazing are fuelling a 13.08% CAGR for autonomous modes that align with smart-building BAS deployments. The smart glass market size attributable to sensor-controlled units is projected to climb from USD 2.01 billion in 2025 to USD 4.2 billion in 2031. Controllers now blend lux meters, thermistors, and Bluetooth Low Energy radios to ingest data into AI optimisation loops.
Remote RF key-fobs and sliders stay relevant for bespoke luxury zones. Smartphone and voice-assistant integrations show strong consumer pull in residential retrofits but raise cybersecurity concerns in high-security facilities. Looking ahead, native Matter-ready modules are expected to standardise the protocol stack across appliances, lighting, and dynamic windows, embedding smart glass deeper into whole-building orchestration.
By Application:
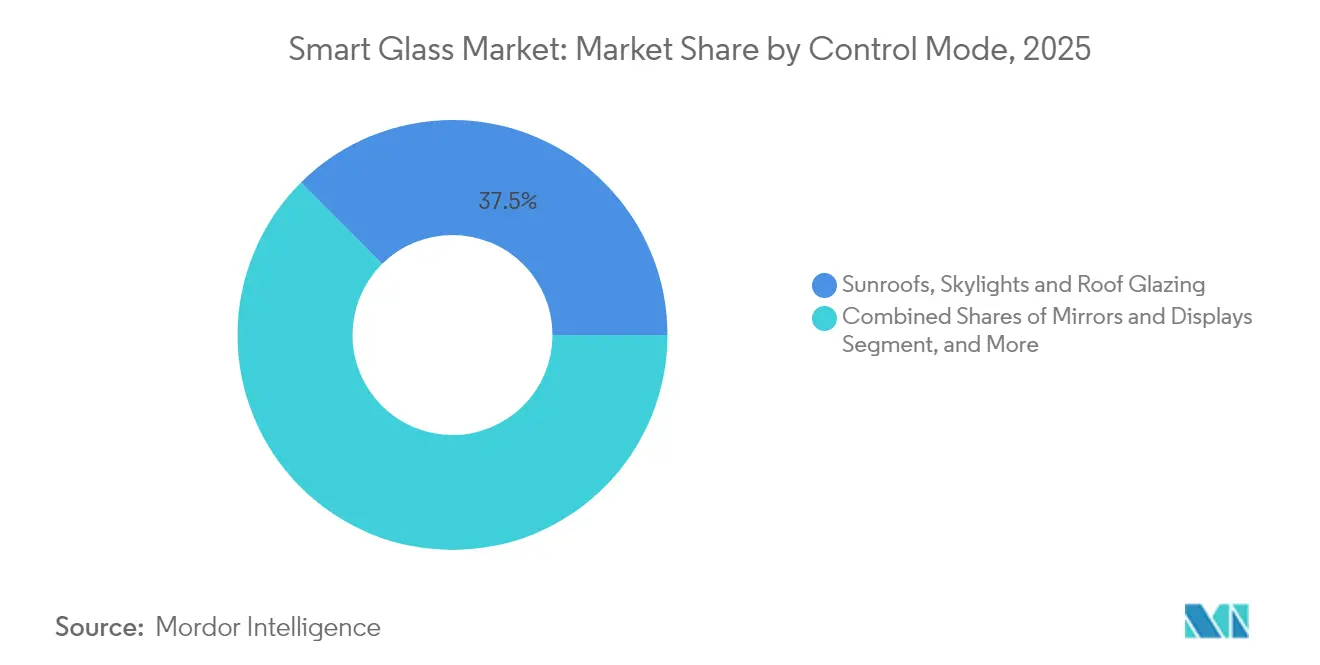
Interior Partitions Show Strong GrowthSunroofs, skylights, and roof glazing collectively represented 37.45% of 2025 bookings. Automotive roof demand, coupled with daylight-harvesting atria in retail and transit hubs, sustains the lion’s share. Interior partitions are the fastest-rising slice, charting a 13.74% CAGR on the back of agile office layouts and pandemic-era hygiene design. Interior partitions accounted for 12.18% of smart glass market size in 2025 and should reach USD 2.94 billion by 2031.
Façades and curtain walls keep steady demand, though growth slows as first-wave adopters saturate benchmark campuses. Mirrors, heads-up displays, and integrated signage constitute a specialist niche marrying optical coatings with electronics. In each scenario, design teams value dynamic glass for merging daylight, privacy, and display functionality without adding mechanical shutters or blinds, further embedding it into the smart glass market narrative.
Geography Analysis
North America Smart Glass Market
North America anchored 34.22% of 2025 revenue as California’s building code raised glazing baselines and the federal CHIPS Act funnelled incentives to high-purity glass fabs. Corning’s USD 315 million fused-silica expansion in New York exemplifies local supply-chain maturation that lowers lead times and underwrites five-year service warranties. The regional smart glass market is also buoyed by OEM demand for panoramic roofs and public-private retrofit programmes targeting federal properties.
APAC Smart Glass Market
Asia Pacific charts the fastest 14.05% CAGR through 2031, propelled by China’s BOE USD 8.8 billion OLED campus, Japan’s 5G façade pilots, and South Korea’s EV-glass upgrades. Chinese producers such as Fuyao are adding CNY 5.8 billion of auto-grade capacity, amplifying economies of scale that compress selling prices. While tungsten-oxide precursor restrictions pose supply risk, regional governments are accelerating localised mining and recycling to fortify strategic autonomy.
Europe Smart Glass Market
Europe advances at a stable pace underpinned by stricter EPC ratings and renovation-wave subsidies. Saint-Gobain’s low-carbon ORAÉ glass and AGC Interpane’s multi-site expansion validate a regional focus on recycled content and net-zero manufacturing. However, elevated electricity prices and overlapping permitting frameworks dampen return profiles in mass-market housing, steering demand toward commercial towers and premium retrofits. Together, these dynamics sustain a geographically diversified smart glass market footprint.

Regulatory Landscape
Smart glass adoption is closely linked to building-energy and safety compliance in major markets. In North America, the International Code Council (IECC) performance path is tightening envelope baselines, and the 2024 IECC cycle is cited as delivering 9.8% incremental savings versus the prior cycle, which raises glazing performance expectations. In the United States, demand-side support also comes through Inflation Reduction Act-related mechanisms referenced for energy-saving building technologies, which can improve retrofit economics for dynamic glazing when paired with whole-building efficiency upgrades.
For automotive and other safety-critical end uses, standards and certification requirements create explicit market-entry gates. In the United States, NHTSA safety glazing requirements under 49 CFR 571.205 (FMVSS 205) govern materials used in motor vehicles. Internationally, ISO test standards for electro-switchable glazing (including ISO 11983:2025 for road-vehicle glazing test methods) and durability-oriented testing frameworks such as ISO 18543:2021 for electrochromic building glazing are key anchors for qualification and procurement. In China, GB/T 46023.1-2025 and GB/T 46023.2-2025 for smart glazing in road vehicles (organic electrochromic and PDLC) take effect from February 1, 2026, adding a dated compliance milestone for suppliers serving Chinese OEM programs.
Value Chain Analysis
The smart glass value chain starts with raw materials and components (float glass substrates, coatings targets and specialty precursors, transparent conductive oxide layers such as ITO alternatives, electrochromic or liquid-crystal active stacks, sealants and interlayers), then moves through thin-film deposition/lamination, module fabrication, controller and sensor integration, and final glazing assembly. Downstream, systems are delivered through architectural glazing contractors and façade integrators for buildings, and through tier suppliers and OEM qualification channels for automotive, where commissioning and software/BMS integration are increasingly bundled for sensor-based and connected installations.
Manufacturing and integration steps are the main friction points, including vacuum deposition yield, contamination sensitivity, and high capex that drives cost and lead-time variability, while specialized precursor availability can constrain scale-up. As a counterweight, the chain is widening to include R&D and pilot-to-field deployment organizations that shorten time-to-spec and de-risk adoption. For example, in June 2026, TNO reported that its SunSmart thermochromic windows were applied in real residential and commercial buildings for the first time, pointing to progress toward electricity-free smart window architectures. On the supply side, capacity and coated-glass investments, including new coated-glass lines commissioned by flat-glass producers, support more consistent availability of base coated substrates that smart-glass laminators and integrators depend on.
Competitive Landscape
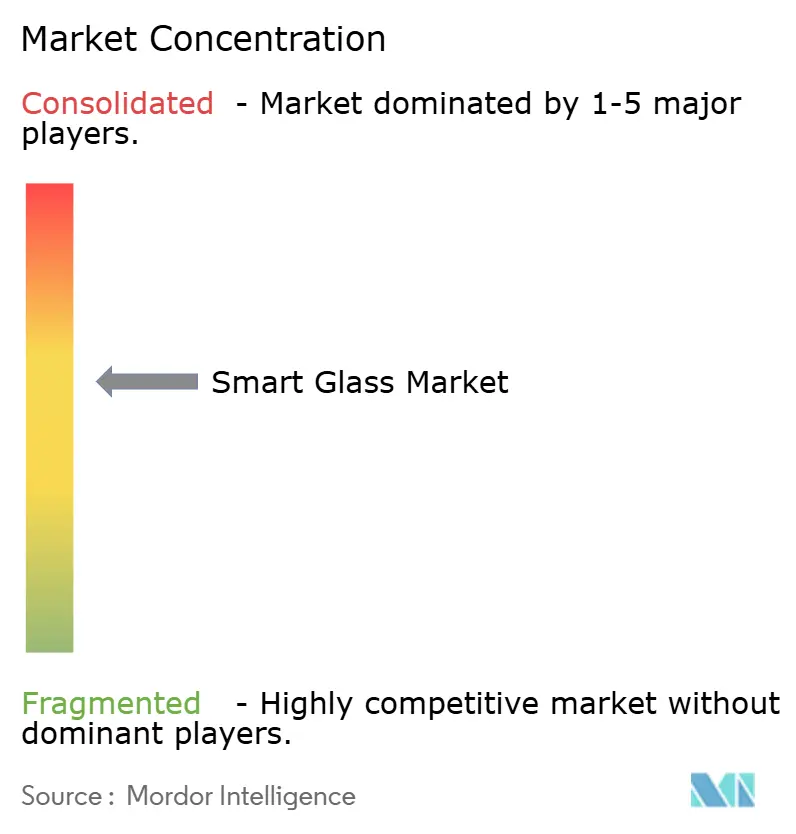
The smart glass market is moderately fragmented. AGC, Saint-Gobain, and Gentex secure scale through vertically integrated float lines, film production, and OEM channels. Gentex alone ships over 50 million dimmable devices annually and is extending its HomeLink platform into smart-home ecosystems. View’s 2024 bankruptcy and 2025 restructuring under Cantor Fitzgerald and RXR underscore volatility for capital-intensive pure-plays.
Strategic thrusts increasingly target cost parity and system integration instead of incremental tint-range improvements. AGC pairs glass with embedded 5G antennas to monetise connectivity. Saint-Gobain’s SageGlass Harmony auto-adjusts tint gradation to balance daylight and glare. BOE’s USD 9 billion AMOLED campus positions it to blend display panels with dynamic glazing, foreshadowing façade-embedded screens. Consolidation is likely as incumbents acquire niche sensor or film start-ups to close capability gaps, nudging the smart glass market toward fewer, broader-based suppliers.
Looking forward, supplier scorecards will hinge on delivered cost per square metre, whole-life carbon footprint, and digital-platform compatibility. Firms unable to unlock cash-flow resilience will either pivot to licensing models or exit, mirroring the semiconductor consolidation pattern.
Smart Glass Industry Leaders
View Inc.
Corning Incorporated
Gentex Corporation
Smart Films International
Argil Inc.
- *Disclaimer: Major Players sorted in no particular order
Smart Glass Market Companies Covered in this Report
- AGC Inc.
- Compagnie de Saint-Gobain S.A. (SageGlass)
- Guardian Glass LLC
- View Inc.
- Halio International SA
- Gentex Corporation
- Corning Incorporated
- Nippon Sheet Glass Co. Ltd. (NSG)
- Polytronix Inc.
- Research Frontiers Inc.
- Pleotint LLC
- EControl-Glas GmbH
- BOE Technology Group Co.
- Hitachi Chemical Co.
- Merck KGaA (liquid-crystal materials)
- Smart Films International
- uniteGlass (CNBM)
- Pro Display / Intelligent Glass
- Magic Film Factory
- Argil Inc.

Market Opportunities and Future Outlook
Energy-code compliance and retrofit programs continue to create whitespace for dynamic glazing in commercial buildings, especially where owners aim to reduce HVAC load and manage daylight without mechanical shading. The opportunity also broadens as smart glass shifts from a stand-alone glazing product to a system integrated with building automation and connectivity, supported by vendor efforts to embed sensors and controls into glazing packages. Field validation of non-powered alternatives expands the retrofit set for wiring-constrained buildings. In June 2026, TNO reported real-world application of its SunSmart transparent thermochromic windows in the Netherlands, demonstrating autonomous solar heat blocking without electricity.
On the supply and cost side, investments in coated and flat-glass capacity create room for more localized, higher-throughput input materials that support smart-glass module manufacturing. In February 2026, Sisecam commissioned a EUR 25 million coated glass line investment in San Giorgio di Nogaro, Italy, doubling coated-glass capacity from 6 million to 12.5 million square metres. In March 2026, it commissioned the TR9 flat glass line in Tarsus, Turkiye, a EUR 315 million investment with 432,000 tonnes annual gross capacity. These moves improve the substrate and coated-glass base used by smart-glass producers, while automotive and consumer-wearable ecosystems open adjacent pull-through demand for advanced glass processing and functional coatings, including ultra-thin glass supply chains and localized manufacturing footprints.
Recent Industry Developments in Smart Glass Market
- June 2026: TNO reported the first real-world applications of its SunSmart transparent thermochromic windows in residential and commercial buildings in the Netherlands. The deployment demonstrated autonomous solar heat blocking without electricity, highlighting a pathway for smart-window adoption in retrofit sites where wiring and controls add cost and installation risk.
- March 2026: View Inc. announced a USD 608 million investment capital injection to support growth initiatives, operational scaling, and product development for its smart building technology platform. The funding strengthened the company-level capacity to deliver larger smart-building programs, an important factor after recent volatility among capital-intensive smart-glass pure plays.
- June 2024: Corning launched Corning Gorilla Glass 7i, expanding its durable cover-glass portfolio for intermediate and value-segment mobile devices. While positioned for consumer electronics, the release reinforced ongoing innovation in high-volume glass and surface performance, capabilities that also feed into smart-glass stacks and coated-glass ecosystems.


Smart Glass Market Report Scope and Research Methodology
Market Definition and Coverage
For this study, the smart glass market is defined as revenue generated from switchable or light-controlling glass products that change tint, transparency, or heat and light transmission when triggered, and that are sold for use in buildings, vehicles, and aircraft.
Scope exclusions: We exclude standard glazing, films sold as standalone retrofits, and broader building automation hardware that is not sold as smart glass.
Segments Covered in This Report
- By Technology Type
- Electrochromic
- Suspended Particle Device (SPD)
- Polymer-Dispersed Liquid Crystal (PDLC)
- Thermochromic
- Photochromic
- Hybrid and Photovoltaic
- By End User
- Automotive
- Architectural - Residential
- Architectural - Commercial
- Avionics
- Marine
- Rail
- Consumer Electronics and Wearables
- Healthcare Facilities
- Other End Users
- By Control Mode
- Wired Switch / Wall Panel
- Remote / RF Controller
- Dimming Panel / Slider
- Smartphone / Voice Assistant
- Sensor-Based Automatic Control
- By Application
- Facades and Curtain Walls
- Interior Partitions and Privacy Panels
- Sunroofs, Skylights and Roof Glazing
- Mirrors and Displays
- By Geography
- North America
- United States
- Canada
- Mexico
- South America
- Brazil
- Argentina
- Rest of South America
- Europe
- Germany
- United Kingdom
- France
- Italy
- Spain
- Russia
- Rest of Europe
- Asia Pacific
- China
- India
- Japan
- South Korea
- ASEAN
- Rest of Asia Pacific
- Middle East and Africa
- Middle East
- Turkey
- Saudi Arabia
- United Arab Emirates
- Qatar
- Rest of Middle East
- Africa
- South Africa
- Nigeria
- Egypt
- Rest of Africa
- Middle East
- North America
Data Sources, Market Sizing, and Validation
Desk Research
Desk research was used to set the factual backbone for demand drivers and supply capabilities before any modeling assumptions were locked. We relied on public sources such as the US Department of Energy programs and publications on building efficiency, International Energy Agency releases on buildings and energy use, UN Comtrade trade statistics for relevant glass product flows, and standards and codes information from groups such as ISO and ASHRAE that can shape adoption.
To translate these signals into market logic, we also reviewed company annual reports and investor decks, product catalogs, patent databases for switchable glazing activity, and reputable industry press for announced projects and capacity additions. In a few areas, we used paid subscriptions for company financials and news intelligence, and for patent and shipment-level trade views, mainly to cross-check timing and scale. These desk sources are illustrative only, and many other public references were used during data collection, validation, and clarification.
Primary Interviews and Surveys
Primary work focused on interviews and structured surveys with smart glass material suppliers, glass processors, system integrators, and downstream buyers in construction, automotive, and aviation procurement. Respondent input was used to confirm adoption triggers, typical pricing movement, and realistic penetration rates. We then sanity-checked the modeled totals across APAC, EMEA, and the Americas so any weak assumptions could be corrected early.
Distribution of primary research fieldwork respondents
| Company type | Respondent position | Region |
|---|---|---|
| Top tier: 32% | CXOs: 14% | APAC: 49% |
| Mid tier: 46% | Functional/Unit leaders: 41% | EMEA: 31% |
| Smaller Players: 22% | Managers: 45% | Americas: 20% |
Market-Sizing & Forecasting
Our market model starts with a top-down build where construction and transportation demand pools are reconstructed from observable indicators, then filtered by smart glass eligibility and adoption. For buildings, we used inputs such as commercial construction activity, facade and window replacement cycles, energy-code tightening, and the share of premium projects where dynamic glazing is technically and financially feasible. For transportation, penetration assumptions were shaped using vehicle production trends, sunroof and glazing area trends, and aircraft delivery and retrofit signals, which were then translated into smart glass attach rates.
Once the demand pools were formed, selective bottom-up checks were added so totals did not drift away from reality. These checks included sampled price ranges by technology (electrochromic, SPD, and liquid crystal), typical order sizes by application, and channel feedback on lead times and conversion rates. When data gaps showed up, we handled them with conservative penetration bands and then narrowed the bands through follow-up calls, before the final numbers were locked.
For forecasting, we used scenario analysis supported by expert consensus on the few variables that move the market most, including construction spending direction, regulatory push for energy savings, technology cost-down curves, and the pace of OEM qualification cycles. This approach kept the forecast explainable, and it also made it easier to test optimistic and cautious adoption paths without overcomplicating the model.
Data Validation & Update Cycle
Validation was done through triangulation across independent signals. We cross-checked modeled demand against construction and vehicle production indicators, and compared implied pricing with interview ranges and published product positioning. Any large variance by region or end use was flagged, reviewed by another analyst, and then reworked until the drivers and outputs matched in a sensible way.
We refresh the model annually. Interim updates are triggered when material events occur, such as major capacity expansions, policy changes that affect building performance requirements, or sharp raw material price shifts that can move smart glass pricing. Before a deliverable is finalized, a fresh pass is performed to confirm the latest data points and remove any outdated assumptions, so clients receive the most current view we can support.
Mordor Intelligence's Global Smart Glass Market Market Size Versus Other Published Estimates
Published market sizes for smart glass can look far apart even when the topic label sounds identical, because the included technologies, end uses, and revenue boundaries are not always aligned. Differences also come from how fast pricing is assumed to fall, which adoption signals are trusted, and how recently estimates were refreshed.
Some published totals expand the market to include adjacent categories like broader glazing systems, retrofit films, or wider building efficiency solutions, which can push the number up even if true switchable glazing volumes have not moved the same way. In Mordor Intelligence sizing, revenue is counted when smart glass products are sold as smart glazing (by core technologies such as electrochromic, SPD, liquid crystal, and passive variants) into architectural, automotive, and avionics uses, while adjacent non-glass controls or generic glazing are kept out so the demand pool stays traceable to clear adoption indicators.
Benchmark comparison
| Source | Market Size | Gaps in Research Methodology |
|---|---|---|
| Mordor Intelligence | USD 11.16 B (2025) | |
| Global Consultancy A | USD 12.43 B (2025) | Uses a wider technology and application net that explicitly folds in consumer electronics and power generation use cases, which can lift totals when pricing and adoption assumptions are applied broadly across sectors. |
| Industry Research Publisher B | USD 8.22 B (2025) | Likely applies tighter adoption and pricing assumptions and may emphasize new-install demand over retrofit activity, which reduces the implied attach rates across buildings and transportation in the base year. |
The spread in the table mainly comes from what gets counted as smart glass revenue and how aggressively adoption is allowed to scale across end uses. By tying demand to observable construction and production indicators and then validating price and penetration through repeated expert checks, the estimate stays balanced and easier to reproduce when inputs change.


Key Questions Answered in the Report
What is the current size of the smart glass market?
The smart glass market stands at USD 12.3 billion in 2026 and is projected to reach USD 19.98 billion by 2031.
Which technology holds the largest smart glass market share?
Electrochromic glass leads with 42.55% of 2025 revenue thanks to its energy-saving performance.
Why is Asia Pacific the fastest-growing region for smart glass?
Massive capacity investments by Chinese, Japanese, and Korean manufacturers and widespread 5G-ready façade projects drive a 14.05% regional CAGR.
How much energy can smart glass save in commercial buildings?
Studies show electrochromic installations can cut total building energy use up to 45%, with 4.5%–9.4% reductions on cooling electricity alone.
What is the biggest barrier to wider smart glass adoption?
High upfront cost versus conventional glazing remains the leading constraint, although new electrode-free devices are pushing costs toward USD 80 m².
Which end-user sector is growing the fastest?
Healthcare facilities post the quickest 16.70% CAGR as hospitals leverage touch-free privacy and infection-control benefits.
Page last updated on:


 Your data is secure and never sold or shared.


