Glass Scintillator Market Size and Share
Market Overview
| Study Period | 2021 - 2031 |
|---|---|
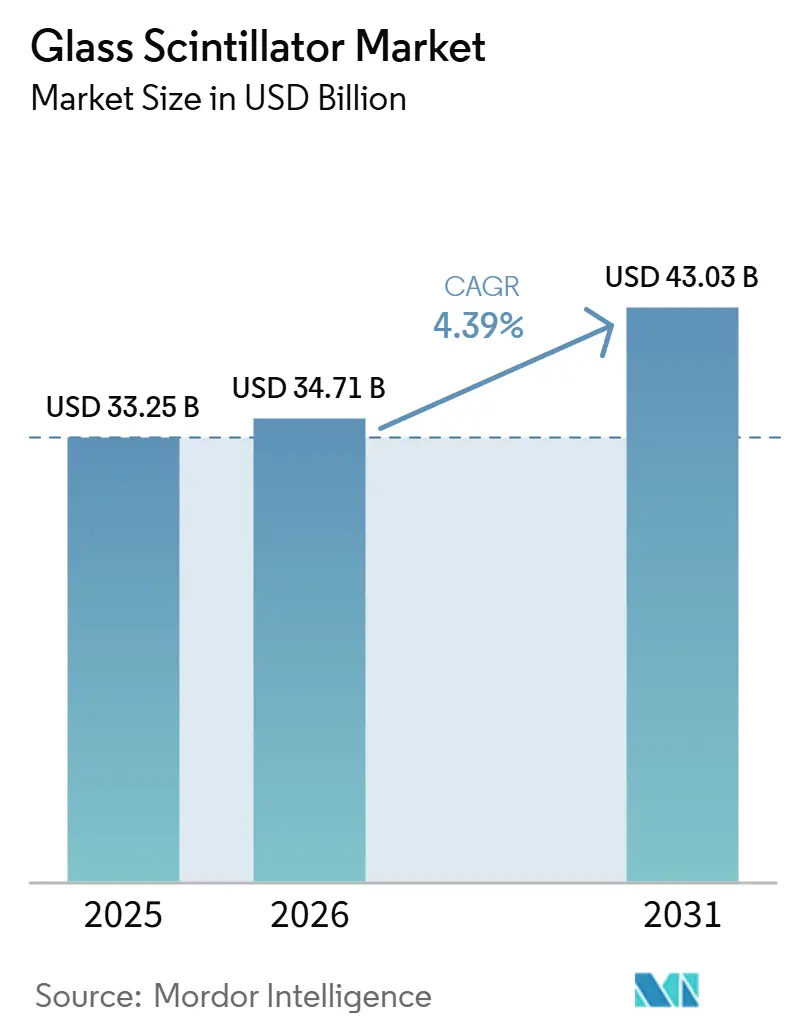
| Market Size (2026) | USD 34.71 Billion |
| Market Size (2031) | USD 43.03 Billion |
| Growth Rate (2026 - 2031) | 4.39% CAGR |
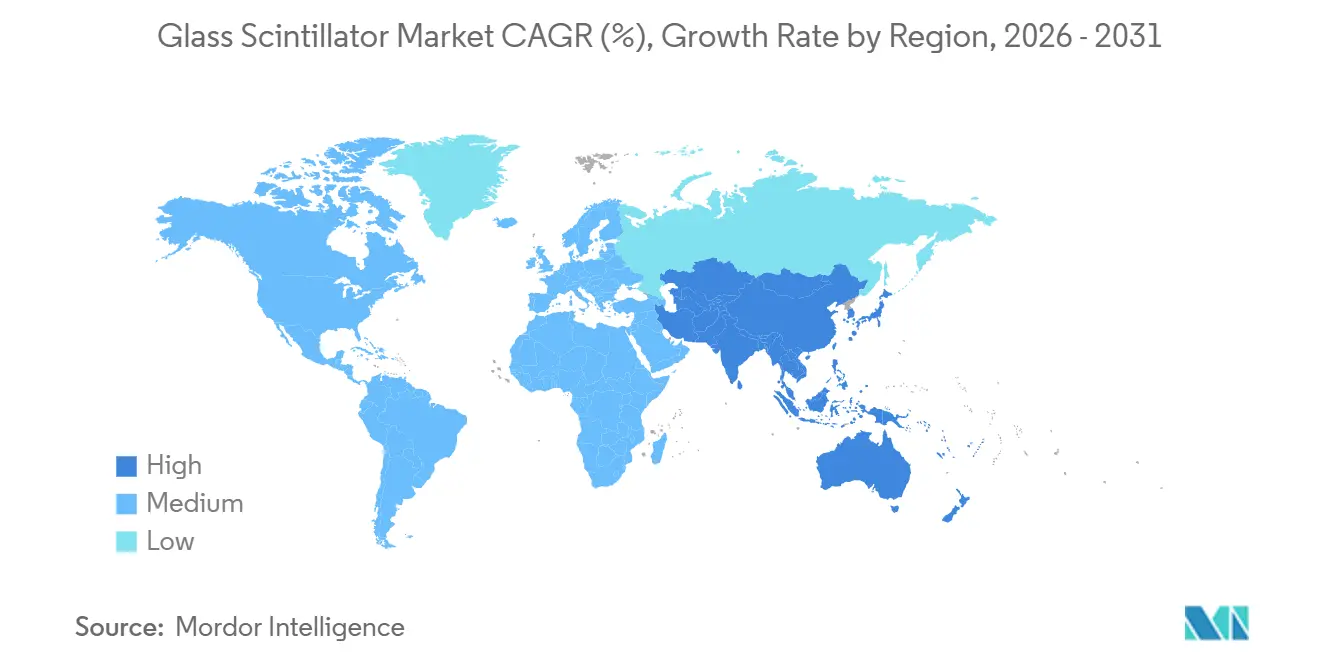
| Fastest Growing Market | Asia Pacific |
| Largest Market | North America |
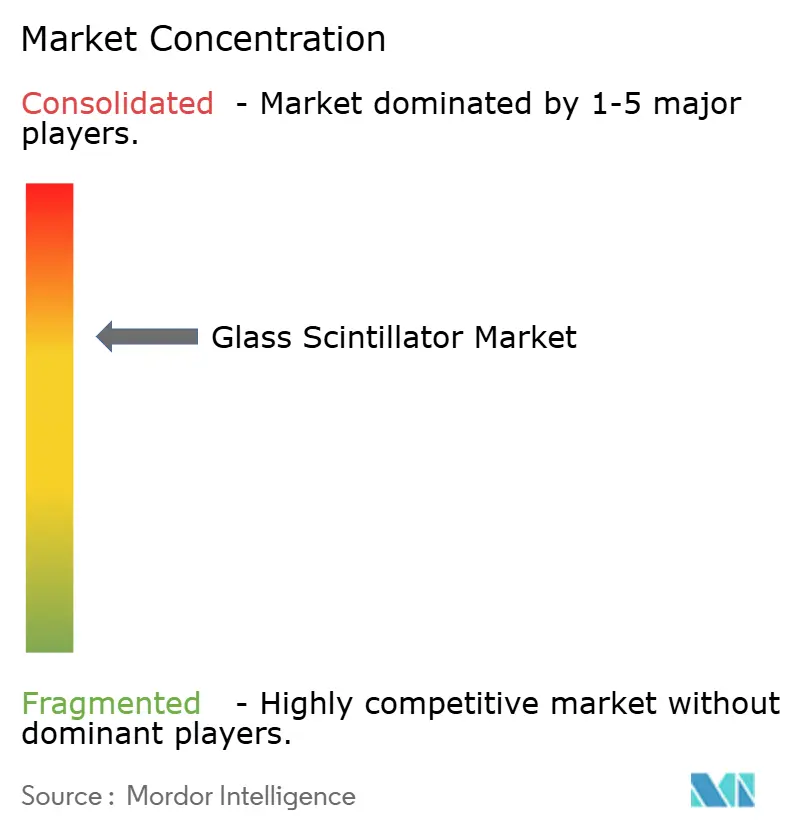
| Market Concentration | Medium |
Major Players *Disclaimer: Major Players sorted in no particular order Image © Mordor Intelligence. Reuse requires attribution under CC BY 4.0. | |
Glass Scintillator Market Analysis by Mordor Intelligence
The Glass Scintillator Market size is expected to grow from USD 33.25 billion in 2025 to USD 34.71 billion in 2026 and is forecast to reach USD 43.03 billion by 2031 at 4.39% CAGR over 2026-2031. A steady procurement pipeline for homeland-security backpack detectors, paired with oncology-driven PET/CT upgrades in Asia-Pacific hospitals, is driving baseline demand despite the light-yield deficit that still separates glass from crystalline alternatives. Suppliers are focusing on enriched Li-6 and B-10 formulations that enhance neutron sensitivity and gamma discrimination, while laboratory advancements in manganese- and cerium-doped phosphate hosts are nearing GS20 reference performance. Integration with silicon photomultipliers (SiPMs) is another growth driver, as the 395 nm emission peak of cerium-activated glass aligns with SiPM quantum-efficiency sweet spots. Capital formation remains selective; only vertically integrated players with isotope-enrichment contracts, hermetic-encapsulation lines, and multiyear qualification histories can meet ANSI N42.53 and IEC 62401 performance thresholds, keeping the glass scintillator market moderately concentrated.
Key Report Takeaways
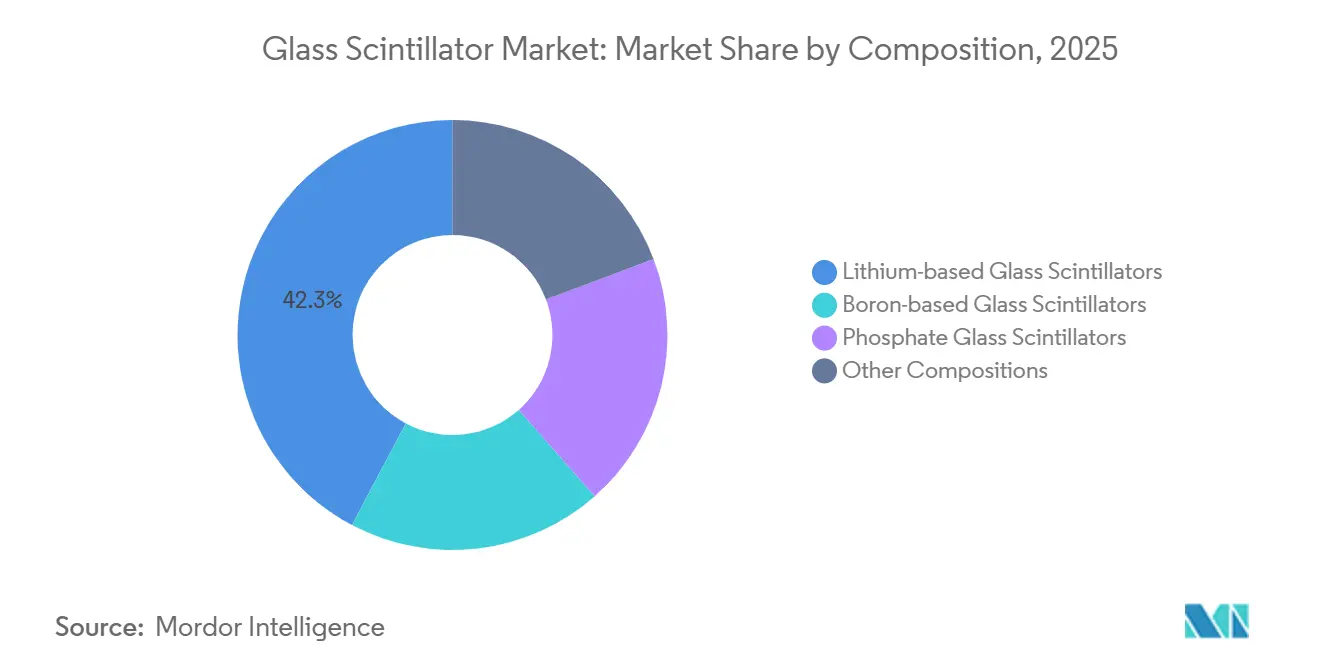
- By composition, lithium-based glass scintillators led with 42.26% of the glass scintillator market share in 2025, while phosphate glass scintillators are projected to expand at a 5.11% CAGR through 2031.
- By application, medical imaging commanded 31.87% of the glass scintillator market share in 2025, whereas security and defense is forecast to expand at a 5.34% CAGR through 2031.
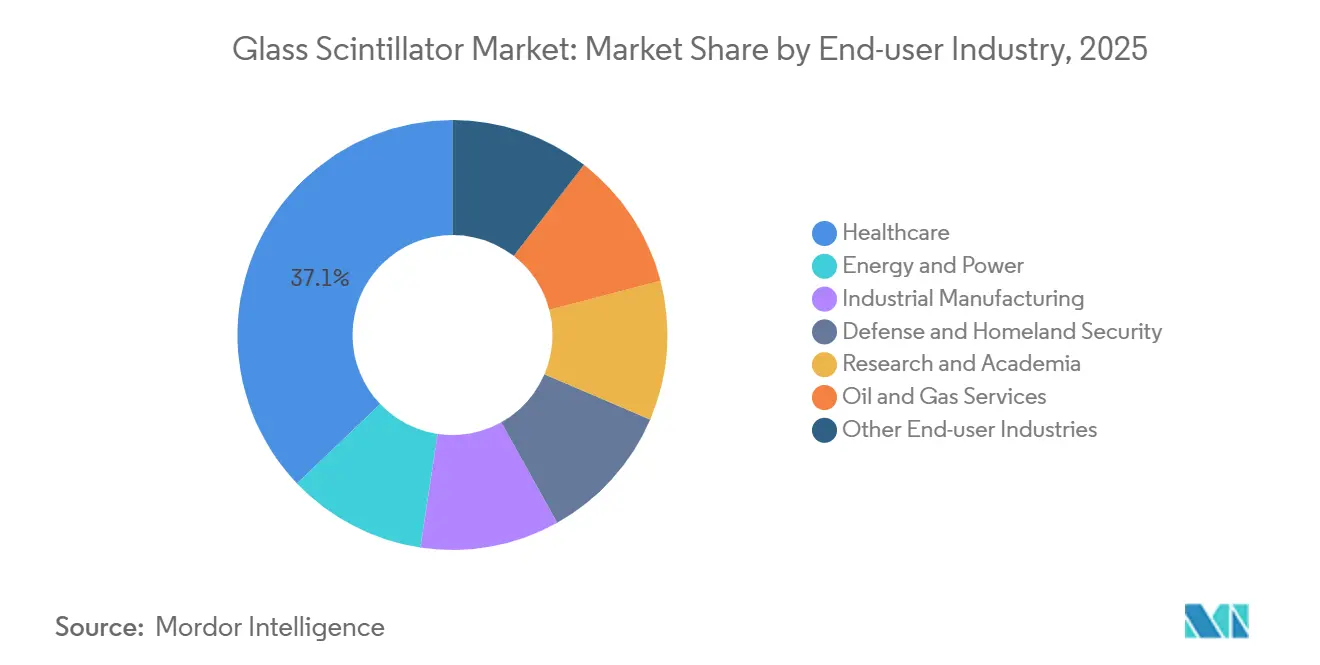
- By end-user industry, healthcare captured 37.14% of the glass scintillator market share in 2025, while defense and homeland security is projected to advance at a 5.47% CAGR through 2031.
- By geography, North America accounted for 40.77% of the glass scintillator market share in 2025, while Asia-Pacific is anticipated to grow the fastest at a 5.87% CAGR through 2031.
Note: Market size and forecast figures in this report are generated using Mordor Intelligence’s proprietary estimation framework, updated with the latest available data and insights as of January 2026.
Global Glass Scintillator Market Trends and Insights
Drivers Impact Analysis*
| Driver | (~) % Impact on CAGR Forecast | Geographic Relevance | Impact Timeline |
|---|---|---|---|
| Rising demand in radiation detection and nuclear security | +1.2% | Global, with concentration in North America and Europe | Medium term (2–4 years) |
| Expanding adoption in medical imaging (PET/CT) | +0.9% | Asia-Pacific core, spill-over to Middle-East | Short term (≤ 2 years) |
| Growth of industrial non-destructive testing (NDT) | +0.6% | North America and EU aerospace hubs, ASEAN manufacturing corridors | Medium term (2–4 years) |
| Surge in homeland-security investments post-2025 | +0.8% | North America, UK, select Middle-East states | Short term (≤ 2 years) |
| Integration with photonic-chip sensors | +0.4% | Global RandD clusters (US, Japan, Germany) | Long term (≥ 4 years) |
| CubeSat and small-sat missions need ultra-light detectors | +0.3% | Global space agencies and commercial operators | Long term (≥ 4 years) |
| Source: Mordor Intelligence | |||
Rising Demand in Radiation Detection and Nuclear Security
National programs to strengthen fixed and mobile radiation-monitoring networks are expanding, with the UK pre-qualifying wearable, handheld, and portal systems under its Radiological Nuclear Detection Framework in 2024. Lithium-glass assemblies utilize Li-6’s 940-barn thermal-neutron cross-section, providing integrators with a compact dual-mode detector that replaces bulkier He-3 tubes. The June 2025 U.S. DHS backpack-detector survey highlighted emerging NaI(Li) configurations that combine neutron capture with ≤ 8% FWHM gamma energy resolution at 662 keV[1]U.S. Department of Homeland Security, “Market Survey Report on Spectroscopic Back-Pack Detectors,” dhs.gov. ANSI N42.53 compliance has become a critical purchasing criterion, narrowing awards to vendors with proven isotope-enrichment ties and hermetic-sealing expertise. As border crossings, seaports, and transit hubs require simultaneous neutron and gamma detection, glass scintillator market penetration is expected to grow where supply chains can deliver large-area Li-6 panels alongside low-background crystals.
Expanding Adoption in Medical Imaging (PET/CT)
Multi-modality gantries that integrate PET, SPECT, and CT in one suite are becoming the oncology standard, as demonstrated by FDA clearance of Mediso’s AnyScan 3.0 in December 2025[2]Medicines & Healthcare products Regulatory Agency, “Mediso AnyScan 3.0 Clearance,” fda.gov. While these systems rely on crystals for core gamma cameras, auxiliary detector banks designed for high-throughput, lower-resolution tasks can use glass arrays to reduce material costs and enable larger footprints. The expansion of oncology centers in China and India’s public-private diagnostics initiatives is increasing unit volumes, driving interest in cerium-doped glass-ceramics with a 50 nGy/s detection limit suitable for low-dose CT workflows. Regulatory alignment with NEMA NU 2-2018 ensures stringent energy-resolution specifications. Pilot installations indicate that glass panels can handle attenuation correction and scout imaging without disrupting clinician workflows. These operational advantages position glass scintillators for broader adoption in provincial and midsize hospitals, where cost per scan is prioritized over sub-5 mm spatial resolution.
Growth of Industrial Non-Destructive Testing (NDT)
Additive-manufacturing lines in aerospace and medical implants require rapid radioscopic inspections to confirm layer fusion and detect voids. Hybrid organic-inorganic glasses with a 4.72 ns decay time enable frame rates of ≥ 1,000 Hz, eliminating motion blur issues associated with traditional GS20, which has a 60–100 ns decay time. In the oilfield sector, Li-6 glass is deployed in high-temperature wireline tools rated above 200°C, while Mn2+-doped fluoroaluminosilicate glass retains 61% luminescence at 573 K, outperforming BGO’s 1% residual brightness. ISO 9712 certification and ASME Section V traceability are essential for contracts, and vendors with automated calibration systems gain a competitive edge. As industrial CT transitions to inline inspection, thin-film glass screens mounted on large-area CMOS sensors are expected to capture market share from plastic scintillators.
Surge in Homeland-Security Investments Post-2025
The July 2025 GBP 1.7 million order for Kromek’s D3S-ID detectors marks the first phase of a four-year UK framework emphasizing sub-10 kg backpack solutions with integrated neutron counters. Similar NATO budgets are prioritizing covert operations for urban patrols and event security. Glass panels, which can be cast into curved or ultra-thin shapes, allow integrators to embed detectors into vests and briefcases without compromising ergonomics. Luxium Solutions offers turnkey GS20 assemblies pre-calibrated to customer specifications, reducing integration timelines. With global He-3 scarcity driving up operating costs for proportional counters, glass scintillators are increasingly replacing these systems across customs, police, and fire-rescue fleets, expanding their market presence in security applications.
Restraints Impact Analysis*
| Restraint | (~) % Impact on CAGR Forecast | Geographic Relevance | Impact Timeline |
|---|---|---|---|
| Lower light yield vs. crystal scintillators | -0.7% | Global | Medium term (2–4 years) |
| High cost and process complexity for Li-6/B-10 glasses | -0.5% | Global, acute in regions without isotope-separation capacity | Short term (≤ 2 years) |
| Scarcity and price volatility of enriched isotopes | -0.4% | Global, most severe in Asia-Pacific and Middle-East | Medium term (2–4 years) |
| Radiation-induced glass darkening beyond 10³ Gy | -0.3% | Localized to high-flux research reactors and spent-fuel facilities | Long term (≥ 4 years) |
| Source: Mordor Intelligence | |||
Lower Light Yield Compared to Crystal Scintillators
Commercial glass scintillators emit 2,000–3,500 photons/MeV, significantly lower than lanthanum bromide’s 40,000 photons/MeV, resulting in energy-resolution limits of 13–18% FWHM at 662 keV. While Ce3+-doped lithium silicates have achieved 7,058 photons per thermal neutron in laboratory settings, these prototypes require scale-up and radiation-hardness validation before commercialization. The lower signal amplitude necessitates larger active areas or higher SiPM gains, both of which increase costs and noise. Vendors are exploring co-doping with manganese to enhance energy-transfer cascades and developing glass-ceramic nanocomposites that nucleate scintillating phases in situ. However, these innovations add manufacturing complexity and quality control requirements. Until production yields consistently exceed 10,000 photons/MeV, glass scintillators will remain less competitive in premium spectroscopy applications dominated by crystal scintillators.
High Costs and Process Complexity for Li-6/B-10 Glasses
Li-6 enrichment involves electromagnetic separation, with feedstock prices 50–100 times higher than natural lithium. The isotope supply chain is concentrated in the United States, Russia, and China, creating geopolitical risks. Each GS20 detector undergoes batch testing for neutron peak resolution and peak-to-valley ratio, adding labor-intensive quality control that smaller firms cannot easily absorb. Similar challenges affect B-10 glass, where enrichment addresses gamma self-shielding but significantly increases raw material costs. As a result, the market favors vertically integrated producers with long-term isotope contracts, limiting opportunities for new entrants without substantial financial resources or access to enrichment facilities.
*Our forecasts treat driver/restraint impacts as directional, not additive. The impact forecasts reflect baseline growth, mix effects, and variable interactions.
Segment Analysis
By Composition: Lithium-based Glass Scintillators Anchor Share, Phosphate Glass Scintillators Accelerate
Lithium-based glass scintillators accounted for 42.26% of 2025 revenue, with enriched Li-6 glass dominating neutron-sensitive applications such as backpack detectors and oil-well logging tools. These applications benefit from compact geometries and a 940-barn capture cross-section. Phosphate glass scintillators are expected to grow at a 5.11% CAGR through 2031, driven by cerium- and terbium-co-doped chemistries that enhance photon yields, making them suitable for dual-mode gamma-neutron applications.
Laboratory advancements in Ce3+-doped lithium glass have achieved neutron light yields 18% higher than GS20 and gamma suppression ratios near 0.23, approaching performance parity with crystal references. Boron-rich glasses remain a niche solution, particularly in scenarios where Li-6’s reactivity poses challenges, such as sealed neutron tubes operating at pressures up to 15 atm. Emerging hybrid glasses incorporating POPOP or anthracene have reduced decay times to under 5 ns, a feature highly valued for kilohertz radioscopic inspections. As commercial scaling progresses, the market for phosphate and hybrid glass scintillators is expected to grow faster than lithium-based scintillators. However, lithium-based scintillators are projected to maintain a market share above 35% through 2031 due to their established applications.


By Application: Medical Imaging Leads, Security Segment Outpaces
Medical imaging represented 31.87% of 2025 market value, supported by PET/CT system upgrades in Asia-Pacific oncology centers and FDA approvals for multi-modality scanners designed for low-dose lung screening. Hospitals prefer glass scintillators for applications requiring large-area coverage over sub-5 mm resolution, such as CT scout imaging and transmission-source attenuation correction.
The security and defense segment is the fastest-growing application, with a projected CAGR of 5.34% through 2031. Growth is driven by NATO procurement of backpack detectors that integrate gamma spectroscopy and neutron counting in sub-10 kg platforms. Nuclear power monitoring continues to provide steady demand, while high-energy physics calorimetry has shifted toward gadolinium-rich glass-ceramics, which offer higher intrinsic yields at lower costs compared to PbWO4. Industrial non-destructive testing (NDT) is another growth driver, as aerospace manufacturers adopt real-time CT for quality control of additive-manufactured parts, creating demand for fast-decay glass screens capable of withstanding 573 K furnace inspections. These diverse applications ensure sustained demand across various end markets.
By End-user Industry: Healthcare Dominates, Defense Accelerates
The healthcare industry accounted for 37.14% of 2025 revenue, reflecting the increasing reliance on hybrid imaging platforms in oncology and cardiology workflows. While the share of glass scintillators in hospital procurement remains modest, it is growing as budget-conscious facilities explore cost-effective secondary detector solutions.
The defense and homeland security industry is expected to grow at a 5.47% CAGR through 2031, supported by initiatives such as the UK Home Office program and U.S. DHS grants aimed at upgrading aging portal monitors. Energy and power utilities contribute incremental demand through reactor surveillance upgrades, while industrial manufacturers drive custom orders for high-temperature or high-frame-rate inspection applications. Research institutes are also fostering long-term opportunities by developing glass-ceramic composites for next-generation accelerators, which could later be commercialized by suppliers.
Geography Analysis
North America held 40.77% of 2025 revenue, driven by robust budgets from the DHS, DOE, and DOD for backpack and portal detectors, as well as specialized neutron-gated imaging systems. Mirion Technologies expanded its Tennessee facility in 2025, adding 60 employees to meet growing nuclear instrumentation demand. The United States also leads CubeSat radiation sensor programs, supported by Small Business Innovation Research (SBIR) grants to university spin-offs. In Canada, detector sales are tied to CANDU reactor monitoring and cross-border cargo screening, while Mexico focuses on seaport portal monitors under International Atomic Energy Agency (IAEA) guidance.
Asia-Pacific is projected to achieve the highest regional CAGR of 5.87% through 2031. China’s Gen-III reactor construction requires perimeter radiation systems, while Japan’s phased nuclear restarts necessitate upgraded spent-fuel pool monitors. India’s diagnostic partnerships are driving PET/CT installations, creating opportunities for glass attenuation panels. South Korea and Taiwan are investing in CubeSat gamma-burst payloads that specify molded glass windows to reduce mass. ASEAN countries, including Vietnam, Thailand, and Indonesia, are deploying cost-effective backpack and portal detectors co-funded by the IAEA, boosting demand for mid-tier detector assemblies.
Europe’s market is led by the UK, Germany, and France. The UK Radiological Nuclear Detection Framework has established a pre-approved vendor list and is midway through multi-million-pound contracts. German aerospace consortia are adopting inline CT with fast-decay glass screens, while France’s 56-reactor fleet follows a fixed 10-year replacement cycle for boundary monitors. Sanctions have limited Western OEM access to Russia, prompting domestic glass research. Elsewhere, Brazil’s research reactor modernization and Saudi Arabia’s feasibility studies contribute small but strategic contracts, expanding the market footprint.

Competitive Landscape
The market is moderately concentrated, with Luxium Solutions, Proterial, Ltd., Hamamatsu Photonics, Kromek, and Scintacor collectively accounting for 53% of global capacity in 2025. Luxium’s 2022 leveraged buyout enabled diversification beyond NaI(Tl), with its GS2, GS20, and KG2 glass lines now offered as turnkey assemblies, including 280 g hermetically sealed blocks certified to ANSI-N42.53 standards. Dynasil/RMD’s tin-loaded organic glass has opened new niches in pulse-shape discrimination, achieving 3-FOM separation at 1 MeVee with enhanced gamma energy resolution.
Hamamatsu integrates Li-6 glass wafers with its C14466-20 SiPM arrays, offering compact neutron-gamma hybrid solutions for homeland security OEMs seeking single-vendor stacks. Saint-Gobain Ceramics maintains strong brand recognition for its GS series glasses but has shifted focus to ceramic scintillators for medical CT applications. University spin-offs like Gadolinium Innovations and PhotonGlass are developing glass-ceramic nanocomposites with perovskite quantum dots, achieving 16.8 lp/mm resolution and 50 nGy/s detection limits. However, pilot production remains limited to sub-kilogram annual output. Compliance with ISO 9001 and IEC 62401 standards strengthens bids, while leading players leverage in-house isotope enrichment to maintain competitive advantages. New entrants must either secure isotope access through partnerships or target emerging niches such as flexible fiber arrays or high-temperature imaging, where competition is less entrenched.
Glass Scintillator Industry Leaders
Hamamatsu Photonics K.K.
Scintacor
Kromek
Luxium Solutions
Proterial, Ltd.
- *Disclaimer: Major Players sorted in no particular order

Recent Industry Developments
- February 2026: Researchers at Sheffield Hallam University started the development of novel glass-based sensors, including scintillating glass-ceramics and metallic glasses, for use in nuclear fusion. These sensors are designed to operate in high-energy, extreme environments where conventional sensors were ineffective, providing enhanced radiation hardness, corrosion resistance, and broad detection capabilities for real-time monitoring in commercial fusion reactors.
- July 2025: Kromek was awarded a contract valued at over GBP 1.7 million (approximately USD 2.2 million) from the UK Home Office for the supply of D3S-ID wearable radiation detectors. This contract underscored the importance of glass scintillators, which are integral to radiation detection technologies used in security and public safety applications.


Global Glass Scintillator Market Report Scope
Glass scintillators are solid-state materials that emit light when exposed to radiation. They are commonly used for detecting neutrons, X-rays, and gamma rays. These materials are valued for their low cost, high resistance to radiation damage, and adaptability to being fabricated into large, complex, or customized shapes. Key types include lithium-6-based glasses for neutron detection and cerium-activated glasses for imaging applications.
The Glass Scintillators Market is segmented into composition, application, end-user industry, and geography. By composition, the market is segmented into lithium-based glass scintillators, boron-based glass scintillators, phosphate glass scintillators, and other compositions. Lithium-based glass scintillators are further divided into natural-Li glass and enriched-Li-6 glass. By application, the market is segmented into medical imaging (PET, PET/CT, SPECT), nuclear power plants and radiation monitoring, high-energy physics and research, industrial inspection/NDT, security and defense, space-borne and astrophysics detectors, and other applications. By end-user industry, the market is segmented into healthcare, energy and power, industrial manufacturing, defense and homeland security, research and academia, oil and gas services, and other end-user industries. The report also covers the market size and forecasts for glass scintillators in 17 countries across major regions. For each segment, the market sizing and forecasts have been done on the basis of value (USD).
| Lithium-based Glass Scintillators | Natural-Li Glass |
| Enriched-Li-6 Glass | |
| Boron-based Glass Scintillators | |
| Phosphate Glass Scintillators | |
| Other Compositions |
| Medical Imaging (PET, PET/CT, SPECT) |
| Nuclear Power Plants and Radiation Monitoring |
| High-Energy Physics and Research |
| Industrial Inspection/NDT |
| Security and Defense |
| Space-borne and Astrophysics Detectors |
| Other Applications |
| Healthcare |
| Energy and Power |
| Industrial Manufacturing |
| Defense and Homeland Security |
| Research and Academia |
| Oil and Gas Services |
| Other End-user Industries |
| Asia-Pacific | China |
| Japan | |
| India | |
| South Korea | |
| ASEAN Countries | |
| Rest of Asia-Pacific | |
| North America | United States |
| Canada | |
| Mexico | |
| Europe | Germany |
| United Kingdom | |
| France | |
| Italy | |
| Spain | |
| Russia | |
| Rest of Europe | |
| South America | Brazil |
| Argentina | |
| Rest of South America | |
| Middle-East and Africa | Saudi Arabia |
| South Africa | |
| Rest of Middle-East and Africa |
| By Composition | Lithium-based Glass Scintillators | Natural-Li Glass |
| Enriched-Li-6 Glass | ||
| Boron-based Glass Scintillators | ||
| Phosphate Glass Scintillators | ||
| Other Compositions | ||
| By Application | Medical Imaging (PET, PET/CT, SPECT) | |
| Nuclear Power Plants and Radiation Monitoring | ||
| High-Energy Physics and Research | ||
| Industrial Inspection/NDT | ||
| Security and Defense | ||
| Space-borne and Astrophysics Detectors | ||
| Other Applications | ||
| By End-user Industry | Healthcare | |
| Energy and Power | ||
| Industrial Manufacturing | ||
| Defense and Homeland Security | ||
| Research and Academia | ||
| Oil and Gas Services | ||
| Other End-user Industries | ||
| By Geography | Asia-Pacific | China |
| Japan | ||
| India | ||
| South Korea | ||
| ASEAN Countries | ||
| Rest of Asia-Pacific | ||
| North America | United States | |
| Canada | ||
| Mexico | ||
| Europe | Germany | |
| United Kingdom | ||
| France | ||
| Italy | ||
| Spain | ||
| Russia | ||
| Rest of Europe | ||
| South America | Brazil | |
| Argentina | ||
| Rest of South America | ||
| Middle-East and Africa | Saudi Arabia | |
| South Africa | ||
| Rest of Middle-East and Africa | ||


Key Questions Answered in the Report
What is the size of the glass scintillator market?
The glass scintillator market stands at USD 34.71 billion in 2026 and is expected to reach USD 43.03 billion by 2031, reflecting a 4.39% CAGR from 2026 to 2031.
Which application is growing the fastest through 2031?
Security and defense is projected to advance at a 5.34% CAGR through 2031.
Why did lithium-based glass scintillators dominate revenue in 2025?
Li-6 enrichment delivers a 940-barn neutron cross-section that enables compact dual-mode detectors for homeland-security and oil-well logging.
What limits glass adoption in high-dose reactor environments?
Radiation-induced darkening above 10³ Gy erodes optical transmission, necessitating more frequent replacement than crystal or ionization chambers.
Page last updated on:


