White Box Switch Market Size and Share
Market Overview
| Study Period | 2020 - 2031 |
|---|---|
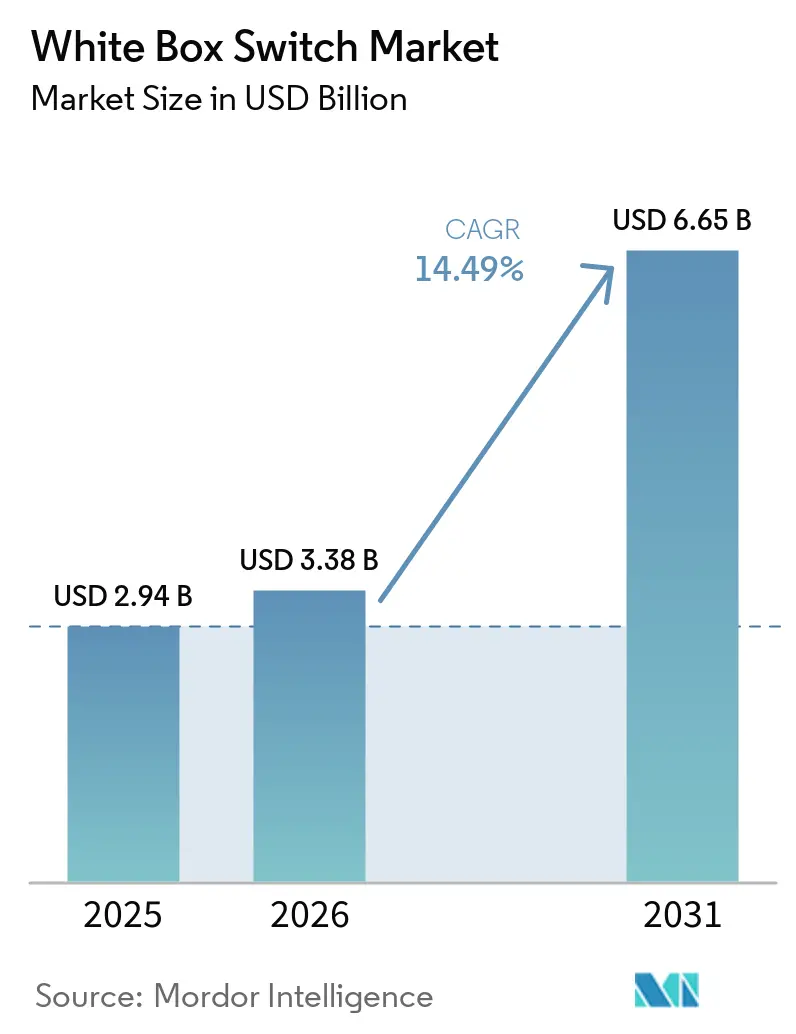
| Market Size (2026) | USD 3.38 Billion |
| Market Size (2031) | USD 6.65 Billion |
| Growth Rate (2026 - 2031) | 14.49% CAGR |
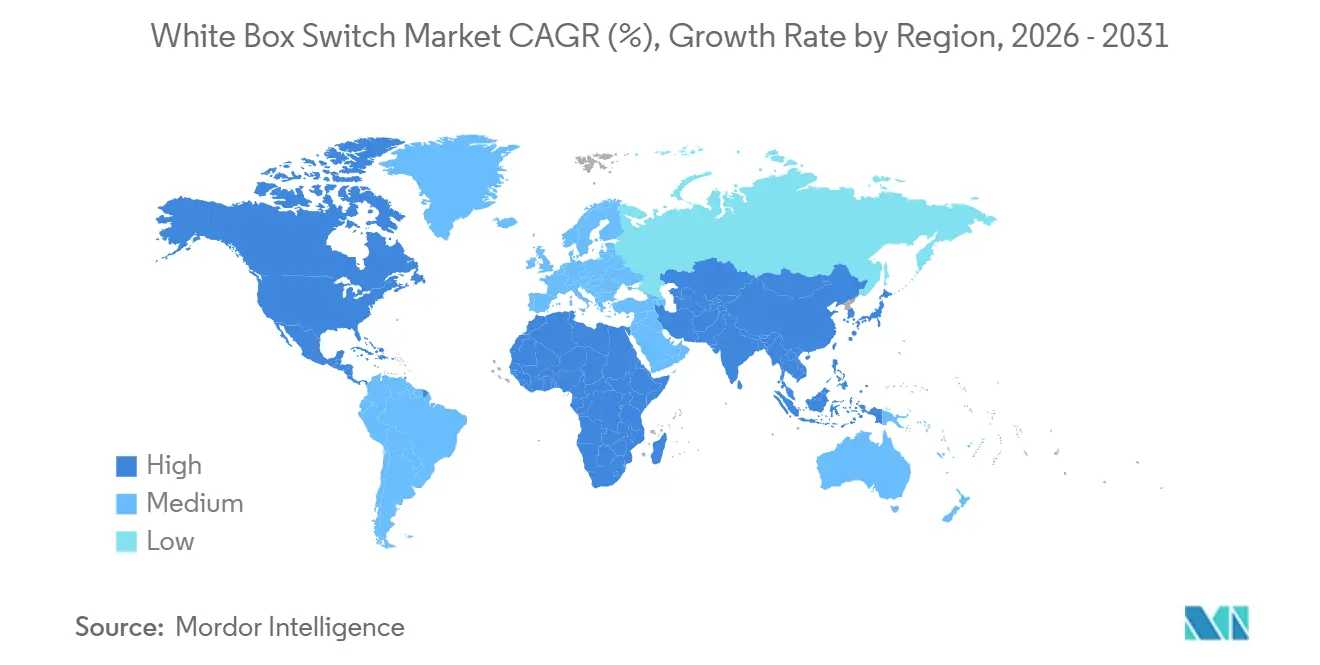
| Fastest Growing Market | North America |
| Largest Market | Asia-Pacific |
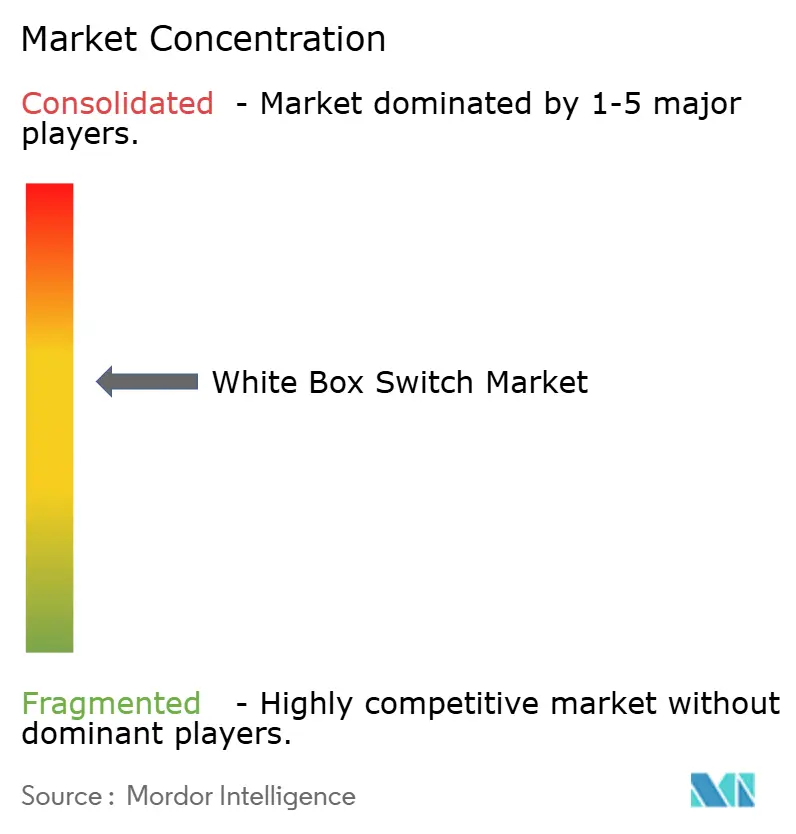
| Market Concentration | Medium |
Major Players *Disclaimer: Major Players sorted in no particular order Image © Mordor Intelligence. Reuse requires attribution under CC BY 4.0. | |
White Box Switch Market Analysis by Mordor Intelligence
The white box switch market size was valued at USD 2.94 billion in 2025 and estimated to grow from USD 3.38 billion in 2026 to reach USD 6.65 billion by 2031, at a CAGR of 14.49% during the forecast period (2026-2031). Hyperscale cloud operators continue to favor merchant-silicon designs because the platforms deliver 30-50% cost advantages relative to bundled offerings, while automation pipelines shrink deployment windows from months to weeks. Rapid standardization of 800-gigabit Ethernet and the availability of 102.4-terabit ASICs have moved performance leadership away from proprietary chassis, reinforcing ODM vendors’ ability to win high-density AI fabric deals. Asia-Pacific buildouts are accelerating, and ODMs are expanding manufacturing footprints in Vietnam and Malaysia to mitigate geopolitical risk. Services revenue is rising as enterprises without DevOps talent seek turnkey integration models that de-risk disaggregated networking.
Key Report Takeaways
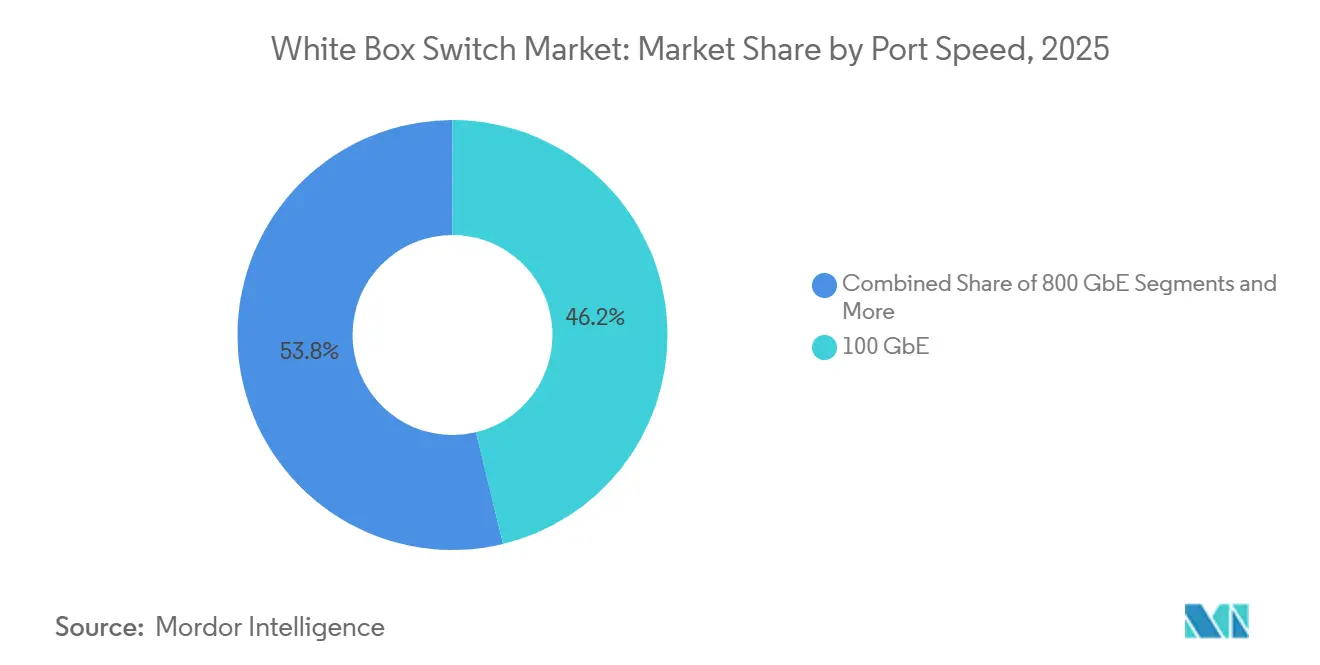
- By port speed, 100 gigabit Ethernet led with 46.23% white box switch market share in 2025; 800 gigabit Ethernet is projected to expand at a 26.24% CAGR through 2031.
- By switch layer, access platforms accounted for 39.62% of the white-box switch market in 2025, while core switches are forecast to grow at a 15.83% CAGR between 2026 and 2031.
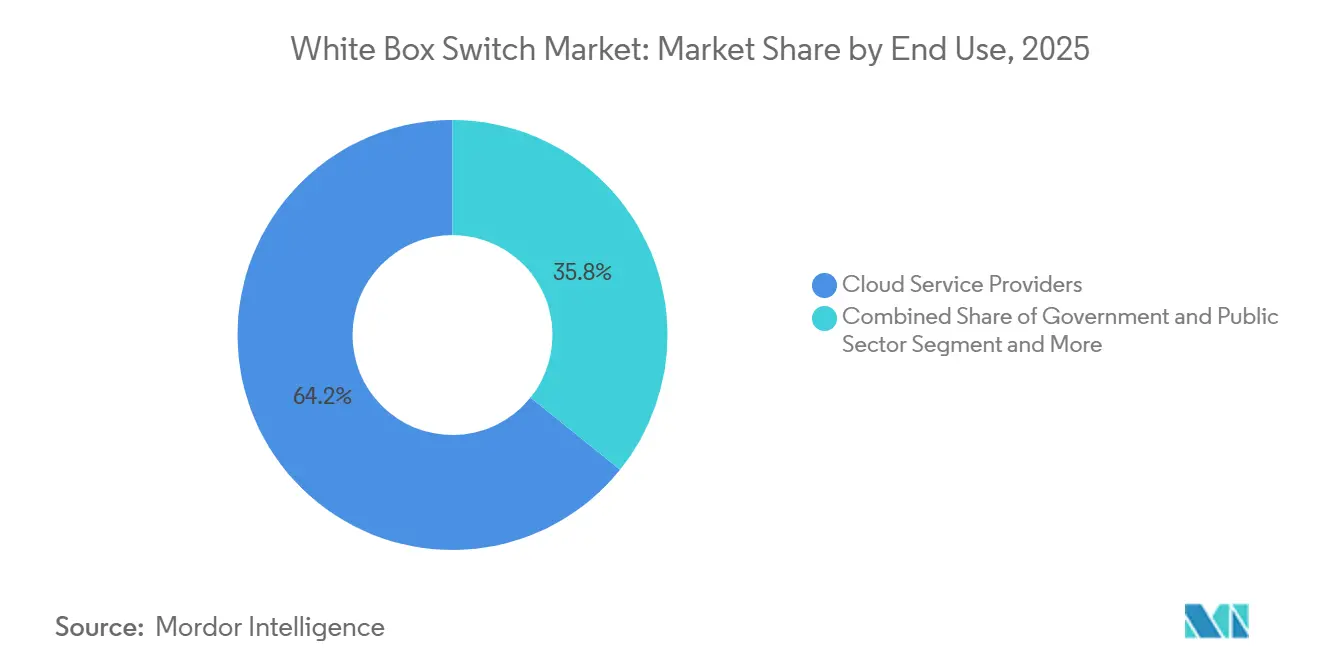
- By end-user industry, cloud service providers commanded 64.23% of revenue share in 2025; the Government & Public Sector is the fastest-growing segment, with a 18.23% CAGR to 2031.
- By deployment environment, hyperscale facilities held 62.32% share in 2025, yet edge sites are advancing at an 18.83% CAGR over the same period.
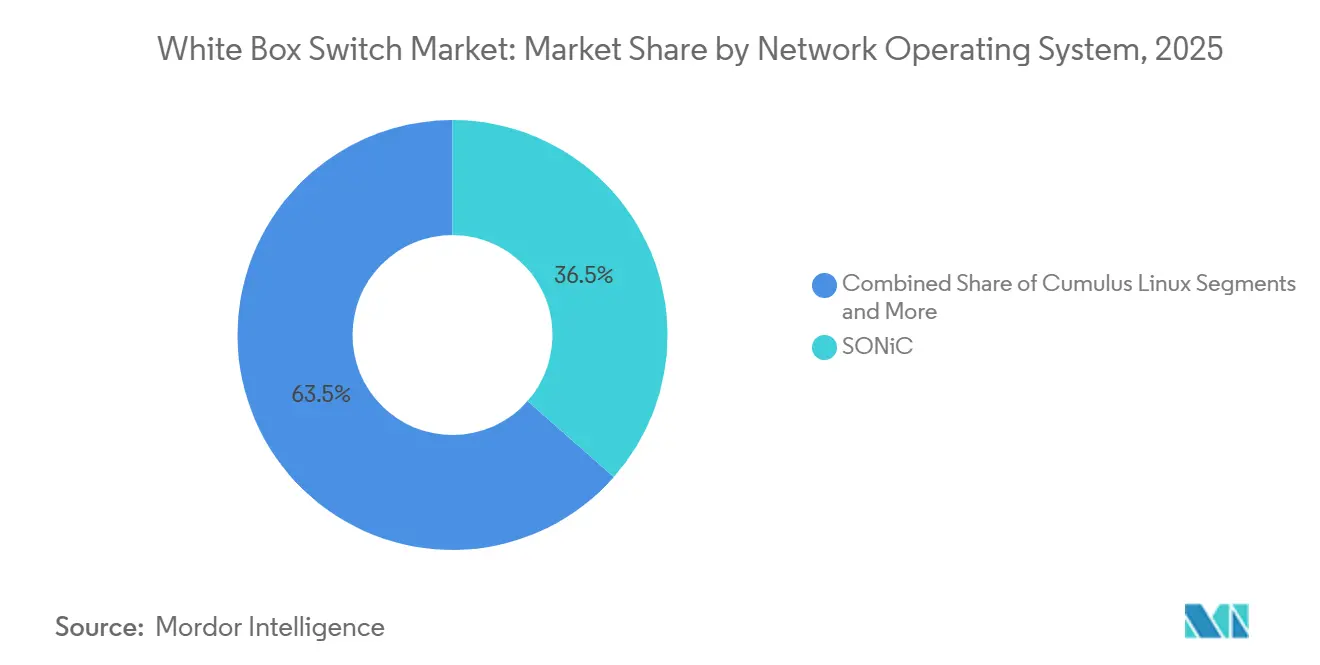
- By network operating system, SONiC captured 36.49% share in 2025 and is set to grow at a 19.41% CAGR through 2031.
- By component, hardware accounted for 65.43% of 2025 revenue, whereas services are expanding at a 16.23% CAGR through 2031.
- By geography, North America retained 39.47% share in 2025; Asia-Pacific is the fastest-growing region with a 15.21% CAGR through 2031.
Note: Market size and forecast figures in this report are generated using Mordor Intelligence’s proprietary estimation framework, updated with the latest available data and insights as of January 2026.
Global White Box Switch Market Trends and Insights
Drivers Impact Analysis*
| Driver | (~) % Impact on CAGR Forecast | Geographic Relevance | Impact Timeline |
|---|---|---|---|
| Hyperscale Data Center Expansion | +4.20% | Global, concentrated in North America and Asia-Pacific | Medium term (2-4 years) |
| Transition to 400G and 800G Ethernet Port Speeds | +3.80% | Global, led by North America hyperscale clusters | Short term (= 2 years) |
| Cost Optimization via Hardware-Software Disaggregation | +2.60% | Global, early adoption in North America and Europe | Medium term (2-4 years) |
| AI and Machine Learning Workloads Demand Low-Latency Fabrics | +2.10% | North America and Asia-Pacific AI hubs | Short term (= 2 years) |
| Sustainability Targets Driving Energy-Efficient Switching | +1.10% | Europe and North America, spillover to Asia-Pacific | Long term (= 4 years) |
| Open Source NOS Ecosystem Maturation | +0.70% | Global, accelerating in enterprise and telecom | Medium term (2-4 years) |
| Source: Mordor Intelligence | |||
Hyperscale Data Center Expansion
Hyperscalers such as Meta, Google, Microsoft, and Amazon continue to deploy self-specified switch chassis manufactured by ODMs at scale, removing OEM brand premiums and enabling faster 18–24 month design refresh cycles aligned with silicon roadmaps. Capital expenditure programs entering 2026 allocate tens of billions of dollars (USD tens of billions) toward AI cluster buildouts, each demanding thousands of 800 GbE spine ports to support high-bandwidth, low-latency fabrics. ODMs that integrate optics and support liquid cooling secure priority access to advanced ASIC supply, shortening commercialization timelines and improving margin capture. At the same time, Asia-Pacific capacity is projected to surpass North America by 2030, prompting vendors to expand manufacturing footprints in Vietnam and India. This diversification reduces supply chain concentration risk and stabilizes delivery timelines amid geopolitical and trade uncertainties.[1]Cushman and Wakefield, “APAC Data Center Market,” cushmanwakefield.com
Transition to 400G and 800G Ethernet Port Speeds
The ratification of IEEE 802.3df in 2024 removed standards uncertainty for 800 GbE deployments, accelerating ASIC vendor roadmaps toward 102.4 Tbps-class devices within a 12-month sampling window. Hyperscalers prioritize spine-layer upgrades, cascading 400 GbE silicon into leaf tiers that previously operated at 100 GbE, thereby optimizing cost per bit across fabrics. Liquid-cooled chassis are expected to be commercialized by 2026 to support rack densities approaching 30 kW, while linear pluggable optics reduce module power consumption by approximately 50%, improving overall energy efficiency. Concurrently, OSFP port lead times have compressed to around 16 weeks, enabling tighter synchronization between network fabric rollouts and GPU cluster deployments. Incumbent OEMs are increasingly offering SONiC-compatible systems, indicating that performance differentiation is converging toward open, disaggregated hardware models.[2]Broadcom, “Tomahawk Ultra Optics Briefing,” broadcom.com
Cost Optimization via Hardware-Software Disaggregation
Decoupling hardware and software reduces capital expenditure by up to 50% as merchant silicon scale economies are passed through to buyers. Operators deploy community or commercial SONiC distributions, source optics independently, and update software on commodity switches every 6 months without full hardware replacement cycles. Enterprise case studies in 2025 indicate payback periods of less than 90 days, driven by automated provisioning that replaces manual CLI-based configuration. Multi-vendor ASIC interoperability limits vendor lock-in and enables procurement teams to optimize pricing quarterly. Although system integrators capture value by addressing capability gaps, the total cost of ownership over 5 years remains materially lower than that of proprietary stacks, reinforcing sustained adoption of white-box switching architectures.[3]Edgecore Networks, “AIS1600-64O Data Sheet,” edgecore.com
AI and Machine Learning Workloads Demand Low-Latency Fabrics
AI training clusters require non-blocking bandwidth across thousands of GPUs, where sub-microsecond latency targets exceed the limits of traditional three-tier architectures. White box switches address this by supporting congestion-aware ECN and in-band telemetry, enabling deterministic performance at scale. ASIC vendors now embed AI-specific capabilities such as RoCEv2 acceleration directly into switching silicon, reducing reliance on external NIC processing and improving end-to-end efficiency. Hyperscalers release open reference architectures that ODMs rapidly commercialize, compressing validation and deployment cycles. Telecom operators are adopting similar models as RAN disaggregation increases demand for edge inference with backhaul latency requirements below 10 milliseconds. Consequently, low-latency, high-throughput fabrics have shifted from a niche requirement to a primary driver of demand in the white-box switch market.[4]Deutsche Telekom, “Open RAN Expansion Plan,” telekom.com
Restraints Impact Analysis*
| Restraint | (~) % Impact on CAGR Forecast | Geographic Relevance | Impact Timeline |
|---|---|---|---|
| Integration and Operational Complexity for Network Teams | -1.80% | Global, acute in enterprises lacking DevOps maturity | Short term (≤ 2 years) |
| Limited Vendor Support and Warranty Ecosystem | -1.30% | Global, concentrated in mid-market enterprises | Medium term (2-4 years) |
| Supply Chain Volatility of Merchant Silicon | -0.90% | Global, episodic during allocation constraints | Short term (≤ 2 years) |
| Security Concerns in Open Networking Environments | -0.60% | North America and Europe, regulated verticals | Medium term (2-4 years) |
| Source: Mordor Intelligence | |||
Integration and Operational Complexity for Network Teams
White box deployments shift network operations from CLI-based workflows to Linux, containerization, and automation stacks such as Docker and CI/CD pipelines, creating a non-trivial skills gap. Early adopters highlight steep learning curves when debugging containerized routing functions or maintaining Switch Abstraction Interface layers, increasing operational risk during initial rollouts. Commercial SONiC distributions provide support and tooling, but they do not fully offset cultural resistance in organizations lacking DevOps maturity. Adoption outside hyperscale environments remains constrained, as smaller enterprises prefer integrated networking solutions with lower operational complexity. Although training programs and managed services partially mitigate these challenges, the rapid release cadence of features forces teams to manage continuous updates, which many view as incremental operational overhead rather than net efficiency gains.
Limited Vendor Support and Warranty Ecosystem
Disaggregated architectures split accountability across ODM hardware vendors, NOS providers, and optics suppliers, creating multi-party escalation paths that complicate fault isolation and extend mean time to resolution. Community support channels offer guidance but lack enforceable SLAs, leading enterprises with 24/7 uptime requirements to favor bundled support models. In regulated sectors such as utilities and defense, certification gaps necessitate third-party validation, increasing deployment cost and timelines. Incumbent OEMs capitalize on this by promoting single-vendor accountability and integrated support structures. Commercial SONiC distributions partially mitigate fragmentation through enterprise-grade support, yet mid-market buyers continue to balance cost savings against operational risk, which tempers adoption in the white-box switch market.
*Our forecasts treat driver/restraint impacts as directional, not additive. The impact forecasts reflect baseline growth, mix effects, and variable interactions.
Segment Analysis
By Port Speed: Surge Toward 800 Gigabit Ethernet
The 100 GbE tier retained a 46.23% revenue share in 2025, reflecting its installed base across enterprise and legacy data center fabrics, but momentum is shifting rapidly toward higher bandwidth architectures. The white box switch market for 800 GbE is projected to grow at a 26.24% CAGR between 2026 and 2031, supported by the commercialization of 102.4 Tbps ASICs that enable dense 64-port OSFP spine configurations. These platforms meet the throughput and latency requirements of AI clusters while maintaining competitive cost per bit. As hyperscalers prioritize scalable, non-blocking fabrics, 800 GbE transitions from early deployment to volume adoption, displacing intermediate upgrade paths.
This acceleration compresses traditional upgrade cycles, with operators increasingly bypassing 400 GbE leaf upgrades and moving directly to 800 GbE spine layers to align with AI workload scaling. The resulting surge in demand strengthens merchant silicon volumes and improves ecosystem economics. Power-efficient linear pluggable optics reduce module energy consumption, directly lowering operating expenditure, while liquid-cooled chassis remove thermal constraints in racks exceeding 30 kW, enabling higher port density. Vendors are already pre-validating reference designs for these architectures, shortening deployment timelines and accelerating a rapid shift toward next-generation high-speed switching in white-box environments.


By Switch Layer: Core Upgrades Outpace Access Volumes
Access platforms accounted for 39.62% of revenue in 2025, reflecting their broad deployment across enterprise campus and edge environments, but growth is shifting toward higher-value core layers. Core switches are projected to expand at a 15.83% CAGR as hyperscalers redesign spine architectures around 800 GbE and emerging 1.6 Tbps ports. These upgrades increase core-layer share by consolidating multiple legacy chassis into fewer, higher-density systems, improving space and power efficiency. As a result, capital allocation is moving upward in the network hierarchy, where performance gains directly influence workload scalability and latency-sensitive applications.
At the same time, SONiC’s expanding enterprise feature set, including PVST+ and 802.1X support, is enabling gradual penetration into access-layer use cases, allowing ODMs to introduce cost-effective Marvell-based 1 GbE PoE switches for campus deployments. However, budget prioritization remains skewed toward AI-driven infrastructure, where non-blocking spine fabrics deliver the highest performance and economic impact. Consequently, while access-layer adoption broadens the addressable market, the majority of incremental revenue growth is concentrated in core switching, reinforcing its strategic importance in the white-box switch market.
By End-User Industry: Cloud Still Dominant, Edge Telco Rising
Cloud service providers accounted for 64.23% of revenue in 2025, maintaining clear dominance in the white-box switch market through scale-driven procurement models and rapid infrastructure refresh cycles. Their investments are concentrated in AI clusters, cloud computing, and high-performance data center fabrics, where disaggregated switching delivers cost efficiency and flexibility. These operators continue to dictate ODM production volumes and influence silicon roadmaps, particularly for 400 GbE and 800 GbE deployments. As a result, hyperscaler demand remains the primary revenue anchor, ensuring stable baseline growth while accelerating adoption of next-generation high-bandwidth architectures across global data center networks.
In contrast, the government and public sector are emerging as the fastest-growing segment, projected to expand at an 18.23% CAGR through 2031. National digital infrastructure programs, sovereign cloud initiatives, and increasing investments in secure, scalable networking for defense and public services support growth. Adoption is further driven by cost-optimization requirements and the need to reduce reliance on proprietary vendors. Although volumes remain smaller than those of hyperscalers, each deployment contributes to broader market validation and regulatory acceptance. This trend diversifies demand sources, strengthens long-term market resilience, and expands adoption beyond purely commercial cloud environments.
By Deployment Environment: Edge Buildouts Accelerate
Hyperscale data centers accounted for 62.32% of shipments in 2025, reflecting their continued dominance in driving volume demand for white box switches through large-scale, centralized deployments. These environments prioritize high-density spine leaf architectures optimized for AI and cloud workloads, where cost efficiency and scalability are critical. However, structural shifts in application delivery are redistributing incremental growth toward distributed infrastructure. Edge sites are projected to expand at an 18.83% CAGR from 2026 to 2031, driven by latency-sensitive use cases and regulatory requirements around data sovereignty. This is accelerating the deployment of compact, ruggedized 100 GbE and 400 GbE switches in metro and regional locations.
As architectures evolve, spine-leaf models are being adapted to smaller footprints, with deployments scaling down to as few as 6 racks while retaining performance and cost advantages. This enables white box economics to extend beyond hyperscale environments into edge scenarios. Vendors are increasingly bundling DPU-enabled servers with compact switching platforms, creating integrated solutions tailored for telecom operators and content delivery networks. These converged offerings simplify deployment and improve workload efficiency at the edge, reinforcing the edge's growing importance as a complementary demand driver in the white box switch market.
By Network Operating System: SONiC Extends Leadership
SONiC accounted for a 36.49% share in 2025, establishing itself as the leading network operating system within the white-box switch ecosystem, with commercial variants projected to grow at a 19.41% CAGR. Its expansion is supported by enterprise-grade enhancements, including support for protocols such as PVST+ and 802.1X, as well as 24/7 vendor-backed support that addresses reliability and operational concerns. These developments reduce the perceived feature gap versus proprietary NOS offerings and make SONiC increasingly viable for production environments beyond hyperscale deployments. As a result, SONiC-based solutions are capturing a growing portion of incremental demand in the white box switch market.
Competing NOS platforms are narrowing their positioning and losing breadth. Cumulus Linux has become closely aligned with NVIDIA silicon ecosystems, limiting its cross-vendor flexibility, while alternatives such as Pica8 and DENT focus on niche or specialized use cases with smaller addressable markets. In parallel, enterprise IT environments are shifting toward containerized, microservices-driven architectures, where SONiC’s modular and container-based design aligns with broader DevOps practices. This architectural compatibility strengthens its adoption trajectory, positioning SONiC as the default software layer for disaggregated networking platforms over the forecast period.
By Component: Services Gain Momentum
Hardware accounted for 65.43% of total spending in 2025, reflecting its role as the primary cost component in white-box switch deployments, particularly in hyperscale and data center environments. However, services are projected to grow at a 16.23% CAGR as enterprises increasingly rely on third-party expertise for integration, deployment, and ongoing management. This trend is driven by the operational complexity of disaggregated architectures and the shortage of in-house skills. Evidence from mid-market deployments shows payback periods as low as 88 days, even after factoring in consulting costs, reinforcing the cost efficiency and rapid ROI associated with white-box adoption.
Over time, services are becoming a critical value layer that offsets hardware commoditization and stabilizes vendor revenue streams. Offerings such as lifecycle management, NOS upgrades, monitoring, and advanced telemetry are creating recurring revenue models that extend beyond initial hardware sales. These capabilities improve network performance and reduce downtime, increasing customer reliance on managed service providers. As a result, vendors are shifting toward hybrid business models that combine low-margin hardware with higher-margin services, enhancing overall profitability and ensuring more predictable revenue generation across the white box switch market.
Geography Analysis
North America accounted for 39.47% of demand in 2025, anchored by hyperscale data center clusters in Virginia, Oregon, and Iowa, which continue to drive high-volume deployments of white-box switches. Capital expenditure plans exceed USD 60 billion in 2026, largely directed toward AI infrastructure that requires 800 GbE spine layers and liquid-cooled rack environments to sustain high-density compute loads. In parallel, enterprise adoption is gradually expanding, with sectors such as financial services and media piloting SONiC-based fabrics to reduce software licensing costs and improve operational flexibility. This combination of hyperscale dominance and incremental enterprise uptake reinforces North America’s position as the primary revenue contributor in the white box switch market.
Asia-Pacific is the fastest-growing region, projected to expand at a 15.21% CAGR, supported by strong government incentives for digital infrastructure and accelerating 5G deployment across major economies. Data localization policies and rising cloud adoption are driving demand for regional data center capacity, with managed colocation expected to exceed 23,900 MW by 2030, surpassing the United States. At the supply level, Taiwan-based ODMs are expanding manufacturing into Vietnam and Malaysia to leverage cost advantages, tax incentives, and geopolitical diversification. This localized production capability reduces lead times and strengthens supply chain resilience, enabling faster adoption of white box switching solutions across both hyperscale and emerging enterprise markets.
Europe’s growth is shaped by regulatory and sustainability priorities, as well as telecom-driven network transformation initiatives. Operators are prioritizing energy-efficient 400 GbE switching platforms combined with linear pluggable optics, which can reduce power consumption by up to 30% and align with regional carbon-reduction targets. Open RAN programs are further accelerating the adoption of disaggregated networking as carriers seek vendor diversification and cost control. Government-backed funding in countries such as the United Kingdom and Germany is supporting the transition toward open infrastructure models. Meanwhile, emerging regions, including South America, the Middle East, and Africa, are at early stages of adoption but are seeing increasing pilot deployments, indicating gradual expansion of the white box switch market beyond established geographies.

Competitive Landscape
The white box switch market remains moderately fragmented, with leading ODMs such as Accton, Quanta Cloud Technology, Celestica, Foxconn, and Delta competing primarily on manufacturing scale, supply chain efficiency, and priority access to merchant silicon rather than brand differentiation. Celestica has established early traction in 800 GbE AI fabrics by aligning product release cycles with hyperscaler deployment timelines, enabling faster commercialization of next-generation platforms. Competitive advantage is therefore driven by design wins and silicon availability, while pricing dynamics remain closely linked to volume economics and operational execution.
Strategic focus is shifting toward co-packaged optics and liquid-cooled architectures that reduce rack-level power consumption by more than 30% and enable higher port density in AI-centric deployments. Delta has introduced a 51.2 Tbps co-packaged optics switch, while Foxconn is targeting mass production of 10,000 units by Q3 2026, indicating early scaling of advanced designs. At the software layer, vendors such as Aviz Networks and Arrcus are capturing value through orchestration, automation, and lifecycle services, shifting margin pools away from commoditized hardware. Cisco’s G300, a SONiC-enabled 1.6 Tbps platform, signals incumbent adaptation to disaggregated models and confirms performance parity with integrated systems.
Looking ahead, differentiation is expected to center on programmable data-plane architectures and integration with DPUs for workload-specific offload, particularly in AI telemetry and segment routing use cases. Vendors that secure early access to advanced ASIC nodes and offer integrated support models are positioned to consolidate share among enterprise and telecom buyers seeking reduced operational risk. At the same time, entry barriers at the hardware level remain manageable, allowing specialized vendors to capture niche opportunities by combining ruggedized designs with tailored NOS stacks, sustaining competitive intensity and ongoing innovation.
White Box Switch Industry Leaders
Accton Technology Corporation
Quanta Cloud Technology Inc.
Hon Hai Precision Industry Co., Ltd.
Celestica Inc.
Delta Electronics, Inc.
- *Disclaimer: Major Players sorted in no particular order

Recent Industry Developments
- April 2026: Cisco introduced the G300 switch with 102.4 terabits throughput, 64 × 1.6 terabit ports, and native SONiC support, reinforcing open-hardware competitiveness.
- April 2026: Lanner Electronics unveiled AstraEdge AI-RAN servers integrating Nvidia L40S GPUs and BlueField-3 DPUs for edge AI inference in Open RAN deployments.
- February 2026: Broadcom began volume shipments of the Tomahawk 6 ASIC, enabling ODMs to launch 800 gigabit platforms with sub-250 nanosecond latency.
- February 2026: Edgecore released the AIS1600-64O, a 64-port OSFP liquid-cooled 800 gigabit switch targeting hyperscale AI fabrics.


Global White Box Switch Market Report Scope
The white box switch market refers to the ecosystem of unbranded, open networking switches built on standardized hardware and merchant silicon, primarily deployed by hyperscalers and enterprises. It includes hardware, network operating systems, and integration services, excluding proprietary branded switches and fully vertically integrated vendor solutions.
The White Box Switch Market Report is Segmented by Port Speed (10/25 GbE, 40 GbE, 100 GbE, 200/400 GbE, and 800 GbE), Switch Layer (Access, Distribution, and Core), End User Industry (Cloud, Telecom, Enterprise, and Government), Deployment (Hyperscale, Enterprise, and Edge), NOS (SONiC, Cumulus, Pica8, and Other), Component (Hardware, NOS, and Services), and Geography (North America, South America, Europe, Asia-Pacific, Middle East, and Africa). Then Market Forecasts are in Value (USD).
| 10/25 GbE |
| 40 GbE |
| 100 GbE |
| 200/400 GbE |
| 800 GbE |
| Access Switches |
| Distribution Switches |
| Core Switches |
| Cloud Service Providers |
| Telecom Operators |
| Enterprises |
| Government & Public Sector |
| Hyperscale Data Centers |
| Enterprise Data Centers |
| Edge Data Centers |
| SONiC |
| Cumulus Linux |
| Pica8 PicOS |
| Other NOS |
| Hardware |
| Network Operating System (NOS) |
| Services |
| North America | United States |
| Canada | |
| Mexico | |
| South America | Brazil |
| Argentina | |
| Rest of South America | |
| Europe | Germany |
| United Kingdom | |
| France | |
| Italy | |
| Spain | |
| Russia | |
| Rest of Europe | |
| Asia-Pacific | China |
| Japan | |
| India | |
| South Korea | |
| Australia | |
| Rest of Asia-Pacific | |
| Middle East | Saudi Arabia |
| United Arab Emirates | |
| Turkey | |
| Rest of Middle East | |
| Africa | South Africa |
| North Africa | |
| Rest of Africa |
| By Port Speed | 10/25 GbE | |
| 40 GbE | ||
| 100 GbE | ||
| 200/400 GbE | ||
| 800 GbE | ||
| By Switch Layer | Access Switches | |
| Distribution Switches | ||
| Core Switches | ||
| By End User Industry | Cloud Service Providers | |
| Telecom Operators | ||
| Enterprises | ||
| Government & Public Sector | ||
| By Deployment Environment | Hyperscale Data Centers | |
| Enterprise Data Centers | ||
| Edge Data Centers | ||
| By Network Operating System (NOS) | SONiC | |
| Cumulus Linux | ||
| Pica8 PicOS | ||
| Other NOS | ||
| By Component | Hardware | |
| Network Operating System (NOS) | ||
| Services | ||
| By Geography | North America | United States |
| Canada | ||
| Mexico | ||
| South America | Brazil | |
| Argentina | ||
| Rest of South America | ||
| Europe | Germany | |
| United Kingdom | ||
| France | ||
| Italy | ||
| Spain | ||
| Russia | ||
| Rest of Europe | ||
| Asia-Pacific | China | |
| Japan | ||
| India | ||
| South Korea | ||
| Australia | ||
| Rest of Asia-Pacific | ||
| Middle East | Saudi Arabia | |
| United Arab Emirates | ||
| Turkey | ||
| Rest of Middle East | ||
| Africa | South Africa | |
| North Africa | ||
| Rest of Africa | ||


Key Questions Answered in the Report
What is the white box switch market size today and how fast is it growing?
The white box switch market size stands at USD 3.38 billion in 2026 and is set to reach USD 6.65 billion by 2031, reflecting a 14.49% CAGR (Mordor Intelligence).
Which port speed segment is expanding the fastest?
800 gigabit Ethernet is the fastest-growing segment, projected to advance at a 26.24% CAGR during 2026-2031 as AI fabrics demand ultra-high bandwidth.
Why are hyperscalers adopting white box switches?
Hyperscalers reduce capital outlays by up to 50% through hardware-software disaggregation, gain automation flexibility, and deploy new ASIC generations within 12-month cycles.
How important is SONiC in enterprise adoption?
SONiC already holds 36.49% network operating system share and is forecast at a 19.41% CAGR, with commercial distributions adding 24/7 support and enterprise protocols (Mordor Intelligence).
Which region will lead future growth?
Asia-Pacific is expected to outpace all other regions with a 15.21% CAGR through 2031 as colocation capacity surpasses 23,900 MW by 2030.
What challenges could slow adoption?
Integration complexity for teams lacking DevOps skills and a fragmented warranty ecosystem remain key restraints, trimming overall CAGR impact by roughly 3.1 percentage points.
Page last updated on:


