Interactive Whiteboard Market Size and Share
Market Overview
| Study Period | 2019 - 2030 |
|---|---|
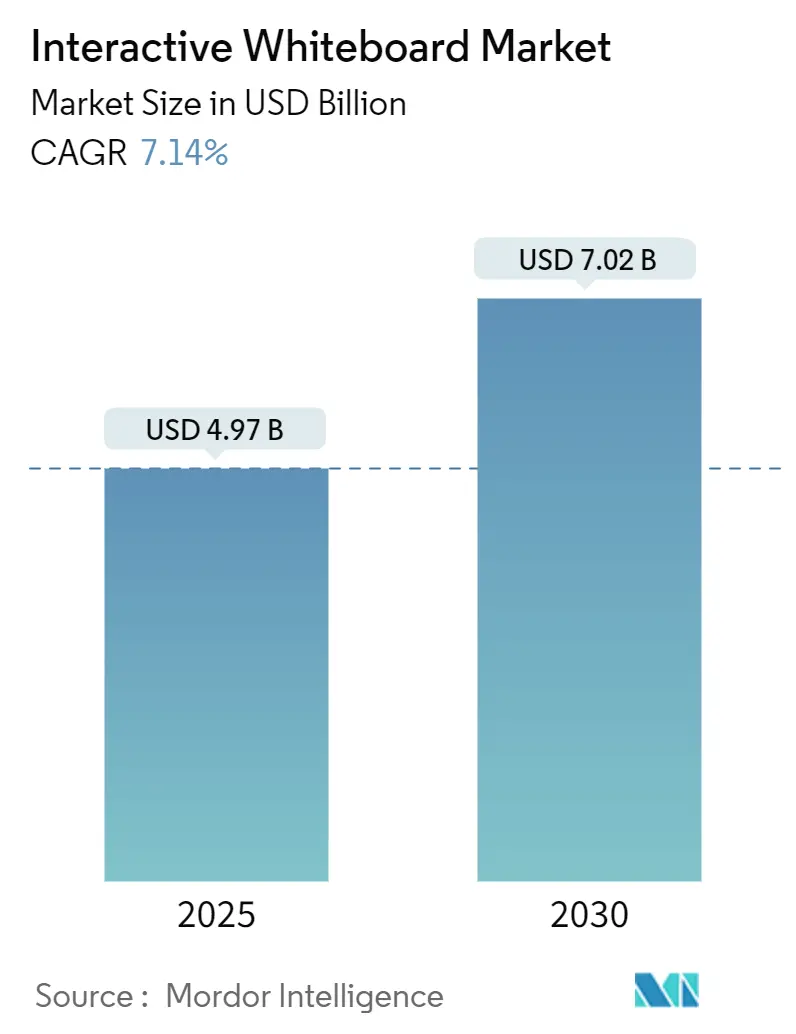
| Market Size (2025) | USD 4.97 Billion |
| Market Size (2030) | USD 7.02 Billion |
| Growth Rate (2025 - 2030) | 7.14% CAGR |
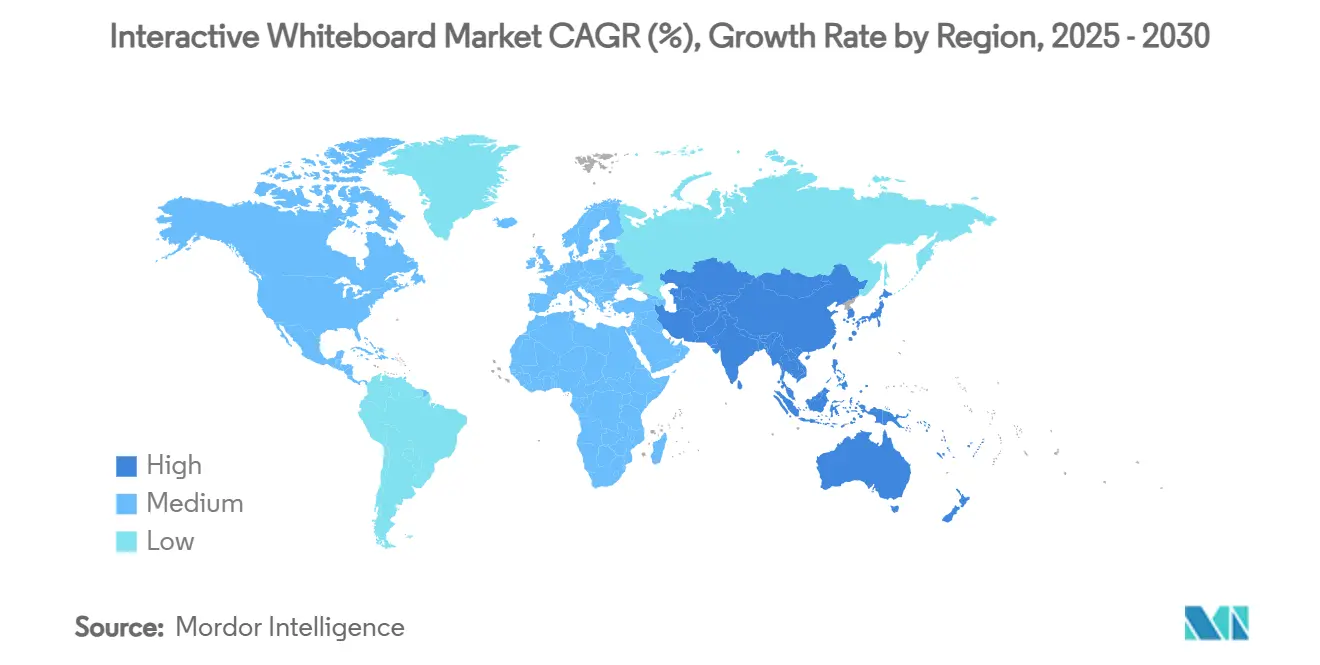
| Fastest Growing Market | Asia Pacific |
| Largest Market | North America |
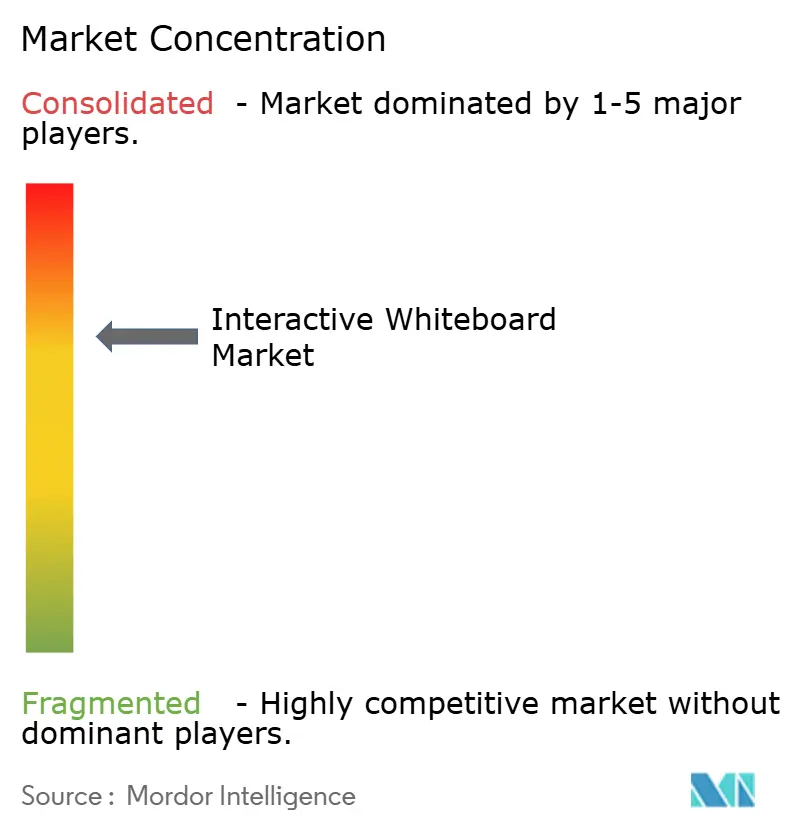
| Market Concentration | Medium |
Major Players *Disclaimer: Major Players sorted in no particular order Image © Mordor Intelligence. Reuse requires attribution under CC BY 4.0. | |
Interactive Whiteboard Market Analysis by Mordor Intelligence
The interactive whiteboard market size is USD 4.97 billion in 2025 and is forecast to reach USD 7.02 billion by 2030, expanding at a 7.14% CAGR. Demand pivots from emergency pandemic purchases to strategic digital-transformation rollouts across schools and enterprises. Hybrid learning, permanent remote work policies, and rapid gains in touch-sensing accuracy sustain purchasing momentum even as budget watchdogs scrutinize total cost of ownership. Larger screens, cloud-native software, and deeper integration with collaboration suites shift competitive focus away from stand-alone hardware toward platform ecosystems. Manufacturers that combine capacitive touch, 4K or 8K panels, and AI-enabled classroom or workplace analytics capture a value premium while cost-focused buyers remain loyal to proven infrared models.
Key Report Takeaways
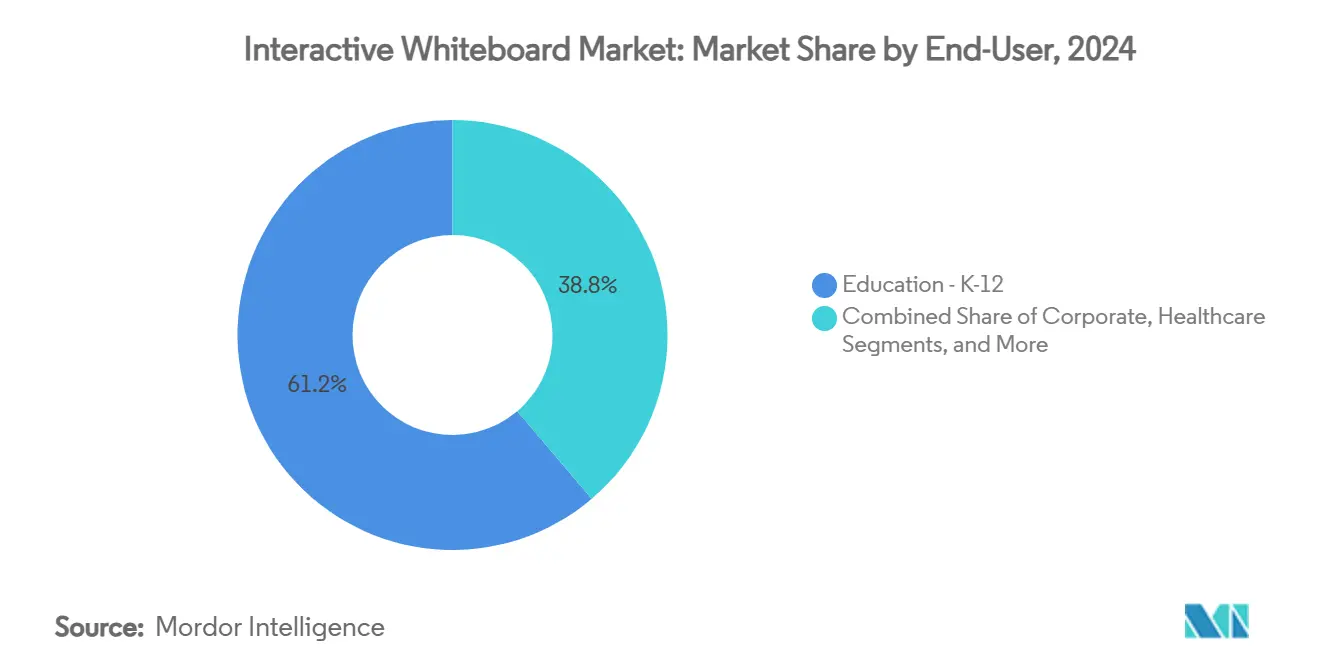
- By end-user, education K-12 held 61.27% of the interactive whiteboard market share in 2024; the corporate segment is projected to expand at an 8.50% CAGR to 2030.
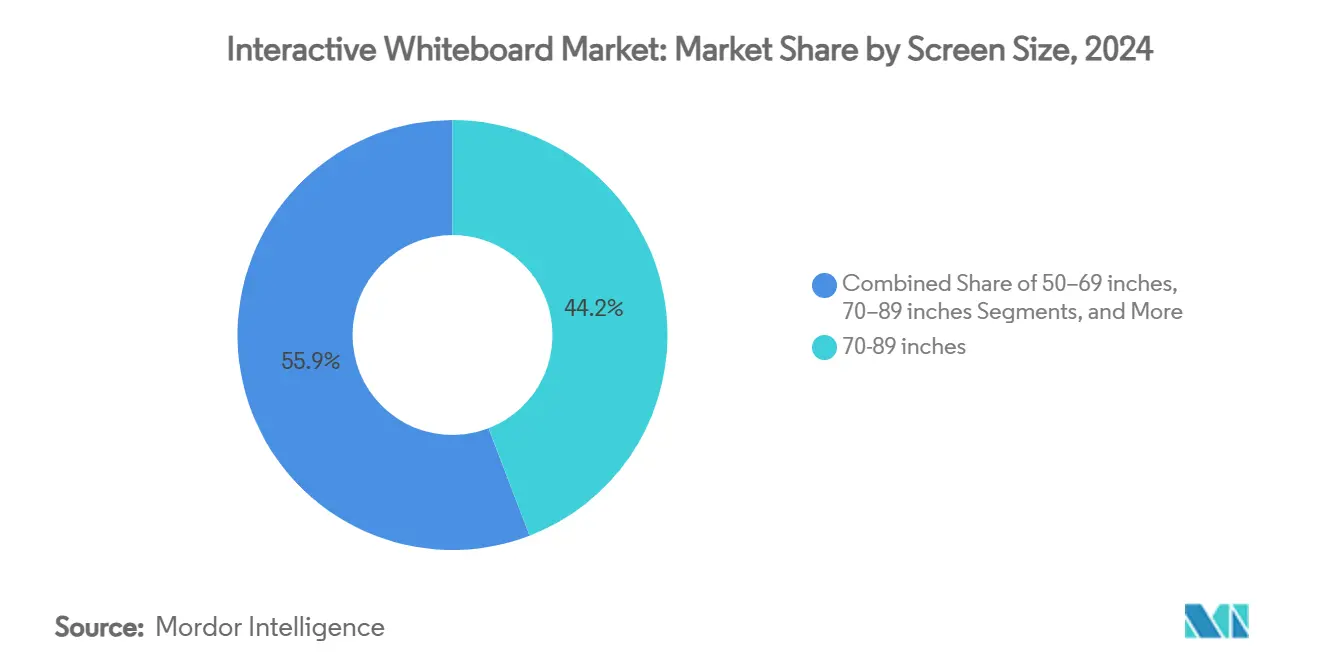
- By screen size, 70-89 inch units captured 44.15% of revenue in 2024, while 90+ inch displays are advancing at a 9.80% CAGR through 2030.
- By technology, infrared solutions accounted for 50.00% of the interactive whiteboard market size in 2024; capacitive touch is forecast to grow at a 10.26% CAGR between 2025-2030.
- By form factor, fixed wall-mounted units commanded 57.00% share of the interactive whiteboard market size in 2024, and mobile systems are growing at an 8.50% CAGR to 2030.
- By region, North America led with 28.70% revenue share in 2024, whereas the Asia Pacific is on track for the fastest 8.34% CAGR through 2030.
Global Interactive Whiteboard Market Trends and Insights
Drivers Impact Analysis*
| Driver | (~ ) % Impact on CAGR Forecast | Geographic Relevance | Impact Timeline |
|---|---|---|---|
| Soaring K-12 EdTech spending in APAC and North America | +1.1% | APAC core, North America secondary | Medium term (2-4 years) |
| Corporate demand for hybrid collaboration suites | +0.9% | Global, concentrated in developed markets | Short term (≤ 2 years) |
| Rapid advances in 4K/8K multi-touch and IR sensing | +1.3% | Global, led by technology centers | Long term (≥ 4 years) |
| Government “digital classroom” stimulus programs | +0.7% | North America and EU, expanding to APAC | Medium term (2-4 years) |
| Cloud-native whiteboard software ecosystems | +0.6% | Global, enterprise-focused markets | Long term (≥ 4 years) |
| Vocational XR labs needing wall-scale touch surfaces | +0.4% | APAC core, spill-over to developed markets | Long term (≥ 4 years) |
| Source: Mordor Intelligence | |||
Soaring K-12 EdTech Spending in APAC and North America
Government and private stakeholders treat classroom technology as long-term infrastructure instead of short-lived emergency gear. Middle-income families across Asia allocate larger education budgets, and ministries embed digital-lesson funding into recurring annual outlays. United States districts used pandemic relief to modernize classrooms, but many states now allocate general funds to sustain newly created digital workflows. Suppliers that bundle teacher training and analytics dashboards win renewals because districts prioritize measurable learning gains over raw hardware specifications. These conditions channel a steady flow of purchase orders to the interactive whiteboard market.
Corporate Demand for Hybrid Collaboration Suites
Permanent hybrid work arrangements turn interactive displays into core meeting-room equipment. Firms look beyond slide projection toward co-editing, digital white-boarding, and synchronous annotation, so procurement teams rank ecosystem compatibility above panel brightness. Integrations with Microsoft Teams, Zoom, and Google Workspace allow staff to start a session on desktops and continue on wall-mounted boards without friction. Premium buyers gravitate to 90+ inch panels that support multiple simultaneous users standing two metres apart, which boosts average selling prices. As boardrooms reopen, refresh cycles in the interactive whiteboard market accelerate.
Rapid Advances in 4K/8K Multi-touch and IR Sensing
Chipset improvements enable 50-point touch tracking at millisecond latency, allowing medical schools to perform detailed anatomy walkthroughs and architects to manipulate CAD files at scale. Samsung and LG released UHD boards in 2025 with Android 13, dual-pen recognition, and passive stylus support, proving that next-generation accuracy no longer demands proprietary operating systems. Capacitive modules now embed directly under glass without bezels, giving designers freedom to thin frames and standardize on consumer-TV production lines, a shift that lowers costs while lifting perceived quality.
Government “Digital Classroom” Stimulus Programs
Grants such as New York State’s USD 3.285 million annual Learning Technology Grant encourage districts to couple devices with open-license lesson content. Federal Small Business Innovation Research rounds in 2024 and 2025 funnel USD 10 million to startups building AI tutoring layers atop interactive displays. These structured awards create predictable adoption windows and reward vendors that supply accessibility features, multilingual interfaces, and robust audit logs required for public procurement.
Restraints Impact Analysis*
| Restraint | (~) % Impact on CAGR Forecast | Geographic Relevance | Impact Timeline |
|---|---|---|---|
| High TCO vs. interactive flat panels | -0.6% | Global, particularly cost-sensitive markets | Short term (≤ 2 years) |
| Device and BYOD substitution in advanced economies | -0.4% | North America and EU, urban centers | Medium term (2-4 years) |
| Lengthening refresh cycles in mature K-12 fleets | -0.3% | North America and EU mature markets | Medium term (2-4 years) |
| Shift to low-energy e-paper walls in “green” schools | -0.1% | EU and select North American districts | Long term (≥ 4 years) |
| Source: Mordor Intelligence | |||
High TCO vs. Interactive Flat Panels
Lifecycle cost audits demonstrate that full-function whiteboards carry higher service, training, and software licence expenses than non-touch displays paired with wireless casting. District CIOs weigh lamp life, replacement pens, and on-site support in TCO models, sometimes deciding to redeploy existing screens with screen-mirroring dongles instead of buying new touch units. Vendors counter by offering modular architectures where sensors, compute modules, and display panels upgrade separately, extending depreciation cycles and trimming ownership costs.
Device and BYOD Substitution in Advanced Economies
Smartphones and tablets dominate personal computing time, so students and employees often prefer annotating on their own screens while mirroring content to a large passive display. This workflow reduces the perceived need for touch-enabled front-of-room hardware. Higher-education IT teams therefore allocate budgets to Wi-Fi 6E and room-scheduling software rather than interactive whiteboards. Manufacturers respond with firmware that casts device screens onto the board and hands control to the presenter instantly, reinforcing relevance.
*Our forecasts treat driver/restraint impacts as directional, not additive. The impact forecasts reflect baseline growth, mix effects, and variable interactions.
Segment Analysis
By Screen Size: Large-Format Dominance with Premium Upswing
Interactive whiteboard market size analysis shows 70-89 inch panels generated 44.15% of 2024 revenue, underscoring their status as the classroom and mid-scale conference-room default. Growth continues as replacements favour UHD resolution and thinner bezels, yet the volume base keeps year-on-year growth moderate. A separate premium wave lifts 90+ inch units, which post a 9.80% CAGR through 2030 on the back of corporate experience centres and vocational labs. The 50-69 inch bracket caters to breakout rooms, while 20-49 inch systems settle into kiosks and cart-based roll-outs for special-needs instruction.
Expanding use cases, such as healthcare simulation and architectural walkthroughs, justify investment in wall-scale panels that let multiple users work side-by-side. Vendors pitch immersive “digital canvas” packages pairing 86-inch screens with motion-tracking cameras and ceiling-array microphones. As production yields improve, panel costs decline, making very-large-format boards attainable for mid-tier institutions and lifting overall interactive whiteboard market value.


By Technology: Capacitive Touch Climbs the Value Curve
Infrared retained 50.00% revenue share in 2024 by offering affordability and easy in-field repair, traits prized by cash-strapped districts. Capacitive platforms, however, deliver smartphone-grade responsiveness, palm rejection, and fine-line drawing that STEM educators and design teams demand, powering a 10.26% CAGR. Electromagnetic pens remain niche, powering language-lab handwriting capture and art studios. Hybrid sensor arrays emerge where suppliers mix IR for broad gestures with capacitive islands for precision drawing, optimising cost-to-performance ratios and expanding interactive whiteboard market addressability.
Educational consortia increasingly specify capacitive when procuring for science, technology, engineering, and mathematics initiatives, accepting higher acquisition prices in exchange for granular control and future-proofing for emerging 8K content. Corporate engineers and creatives follow a similar path, expecting a seamless leap from tablet to wall display without touch lag or parallax.
By End-User: Corporate Uptick Offsets K-12 Saturation
K-12 schooling contributed 61.27% of 2024 sales thanks to the vast installed base and curriculum mandates, but classroom penetration now exceeds 75% in many developed countries. Corporate buyers, meanwhile, fuel an 8.50% CAGR with boardroom upgrades that integrate video conferencing, digital white-boarding, and real-time document co-authoring. Higher-education growth steadies as universities convert lecture halls incrementally, while healthcare providers adopt boards for patient consultation, multidisciplinary team meetings, and simulation training.
Enterprises allocate larger per-room budgets than schools, often selecting premium 75-inch or 86-inch units plus bundled collaboration licences. Those orders lift average selling price even when shipment volumes plateau, propping up revenue in the interactive whiteboard market.
By Form Factor: Mobility Gains but Fixed Mounts Remain Core
Fixed wall mounts delivered 57.00% of 2024 turnover, reflecting ergonomic advantages and structured cable runs in purpose-built classrooms and meeting suites. Mobile carts post 8.50% CAGR as organisations convert open areas into ad-hoc collaboration zones. The maturity of Wi-Fi 6E, on-board batteries, and sturdy yet lightweight chassis makes relocation a one-person job, broadening usage from traditional lecture to pop-up design sprints and outdoor learning sessions.
Manufacturers standardise quick-release brackets and swappable compute modules so that a panel moves between rooms while retaining user profiles and security policies. This flexibility resonates with budget committees that want higher utilisation rates per device, nudging fresh demand into the interactive whiteboard market.
Geography Analysis
Enterprise Training and Simulation Cost-Reduction Initiatives
North America generated 28.70% of 2024 revenue on the strength of widespread K-12 adoption and corporate headquarters density. Continued growth faces budget headwinds as federal COVID relief sunsets, yet state grant programs and private foundations fill part of the gap. Many districts pivot to subscription-based software that extends utility of existing boards, buying manufacturers time before the next hardware refresh wave. Enterprises eye replacement cycles every three to four years to maintain parity with laptop horsepower, sustaining mid-single-digit shipment growth.
Asia Pacific posts the fastest 8.34% CAGR through 2030 as governments spread broadband and equip blended-learning classrooms across urban and rural regions. China spearheads volume with multi-year procurement frameworks that bundle displays, learning-management systems, and cloud servers. India follows, spurred by federal education missions and rising middle-class disposable income. Mature markets such as Japan, South Korea, and Australia spend on premium capacitive panels and AI-enhanced lesson-capture tools, birthing a varied yet robust regional demand profile that enlarges the interactive whiteboard market.
Europe delivers steady, policy-driven demand aligned with digital-competence frameworks and sustainability directives. EU incentive packages reward schools selecting energy-efficient boards and recyclable materials, pushing vendors to refine chassis designs. Germany, France, and the United Kingdom continue to upgrade secondary-school STEM labs and enterprise collaboration hubs. Eastern European members ramp procurement using structural funds, bridging the digital gap and extending the addressable base.
Middle East and Africa record double-digit shipment growth from a modest base, propelled by national visions that prioritise smart classrooms and smart cities. Gulf states lead premium adoption, whereas sub-Saharan Africa gravitates to budget infrared models often bundled with solar-powered projectors and offline content repositories. Supplier success correlates with local partnership networks that manage logistics and teacher training.

Competitive Landscape
Declining Hardware ASPs Driven by Next-Gen Chipsets
The interactive whiteboard market hosts a moderately fragmented roster. SMART Technologies and Promethean retain strong K-12 channel relationships, each offering end-to-end ecosystems from lesson-planning software to remote device management. Samsung and LG leverage consumer panel fabrication to price aggressively while layering Android-powered collaboration suites that appeal to enterprises. Together, the four firms control nearly 55% of global shipments, leaving the rest to regional specialists and emerging SaaS entrants.
Strategic moves concentrate on ecosystem lock-in rather than panel differentiation. Samsung’s 2025 eBoard integrates Google EDLA, allowing instant sign-in to Google Workspace, while LG’s CreateBoard Pro aligns with Windows and ChromeOS environments. Both brands court ISV partners developing STEM apps, language-lab modules, and AI note summarisation tools, extending utility far beyond digital ink.
Market entrants focusing on cloud-native software pair standard UHD televisions with sensor bars and stylus packs, undercutting traditional whiteboard pricing by up to 30%. Hardware incumbents counter through trade-in programmes, service-level guarantees, and integrated analytics dashboards that prove return on investment to administrators. Patent portfolios around palm rejection, parallax elimination, and multi-user recognition remain instrumental in securing regional tenders and discouraging copycat imports.
Interactive Whiteboard Industry Leaders
SMART Technologies ULC
Promethean Limited
BenQ Corporation
Sharp NEC Display Solutions, Ltd.
ViewSonic Corporation
- *Disclaimer: Major Players sorted in no particular order

Recent Industry Developments
- June 2025: Samsung Electronics Australia introduced the WAF-series Interactive eBoard featuring Google EDLA certification, dual-pen input, and split-note mode across 65-, 75-, and 86-inch models, targeting blended-learning classrooms and enterprise huddle rooms
- January 2025: LG Electronics USA launched the CreateBoard Pro TR3PN Series at FETC 2025 with Android 13, UHD resolution, and 50-point multi-touch support for 86-, 75-, and 65-inch panels
- January 2025: New York State Education Department confirmed USD 3.285 million annual Learning Technology Grant funding through 2027 to foster innovative, culturally responsive digital-classroom solutions
- November 2024: The U.S. Institute of Education Sciences allocated USD 10 million in SBIR grants to ed-tech startups developing AI-enhanced interactive learning platforms.


Global Interactive Whiteboard Market Report Scope
| 20-49 inches |
| 50-69 inches |
| 70-89 inches |
| 90 inches and above |
| Infrared |
| Capacitive |
| Electromagnetic |
| Resistive |
| Others (e.g., Laser, Ultrasonic) |
| Education - K-12 |
| Education - Higher Ed |
| Corporate |
| Government and Defense |
| Healthcare |
| Others (Hospitality, Retail) |
| Wall-Mounted (Fixed) |
| Mobile / Portable |
| North America | United States |
| Canada | |
| Mexico | |
| South America | Brazil |
| Argentina | |
| Rest of South America | |
| Europe | Germany |
| United Kingdom | |
| France | |
| Russia | |
| Rest of Europe | |
| Asia Pacific | China |
| Japan | |
| India | |
| South Korea | |
| Rest of Asia Pacific | |
| Middle East | Saudi Arabia |
| United Arab Emirates | |
| Rest of Middle East | |
| Africa | South Africa |
| Rest of Africa |
| By Screen Size (Value) | 20-49 inches | |
| 50-69 inches | ||
| 70-89 inches | ||
| 90 inches and above | ||
| By Technology | Infrared | |
| Capacitive | ||
| Electromagnetic | ||
| Resistive | ||
| Others (e.g., Laser, Ultrasonic) | ||
| By End-user | Education - K-12 | |
| Education - Higher Ed | ||
| Corporate | ||
| Government and Defense | ||
| Healthcare | ||
| Others (Hospitality, Retail) | ||
| By Form Factor | Wall-Mounted (Fixed) | |
| Mobile / Portable | ||
| By Geography | North America | United States |
| Canada | ||
| Mexico | ||
| South America | Brazil | |
| Argentina | ||
| Rest of South America | ||
| Europe | Germany | |
| United Kingdom | ||
| France | ||
| Russia | ||
| Rest of Europe | ||
| Asia Pacific | China | |
| Japan | ||
| India | ||
| South Korea | ||
| Rest of Asia Pacific | ||
| Middle East | Saudi Arabia | |
| United Arab Emirates | ||
| Rest of Middle East | ||
| Africa | South Africa | |
| Rest of Africa | ||


Key Questions Answered in the Report
What is the current value of the interactive whiteboard market?
The interactive whiteboard market size is USD 4.97 billion in 2025.
How fast is the market expected to grow?
Revenue is projected to advance at a 7.14% CAGR, reaching USD 7.02 billion by 2030.
Which region shows the highest growth momentum?
Asia Pacific is forecast to post the fastest 8.34% CAGR through 2030, driven by large-scale classroom digitisation.
What screen size segment is expanding the quickest?
Displays 90 inches and larger are rising at a 9.80% CAGR owing to demand for wall-scale collaboration.
Why are corporates investing in interactive whiteboards?
Permanent hybrid work models require integrated touch screens for co-editing, brainstorming, and seamless video meetings, fuelling an 8.50% CAGR in the corporate segment.
Which technology type is gaining share against infrared?
Capacitive touch solutions are expected to grow at 10.26% CAGR due to superior precision and multi-user support.
Page last updated on:


