
Technology, Media and Telecom
5th MayPricing Strategy for Semiconductor Components
3 Min Read
The White Box Server Market Report Segments the Industry Into by Server Type (Rack Mounted Server, GPU Server, Twin Server, Blade Server, and Storage Server), Processor Type (X86 Servers, and Non-X86 Servers), Organization Size (Large Enterprise, Small and Medium Enterprise), End User Vertical (IT and Telecommunication, Healthcare, and More), and by Geography.
Market Overview
| Study Period | 2021 - 2031 |
|---|---|
| Market Size (2026) | USD 24.23 Billion |
| Market Size (2031) | USD 48.87 Billion |
| Growth Rate (2026 - 2031) | 15.05 % CAGR |
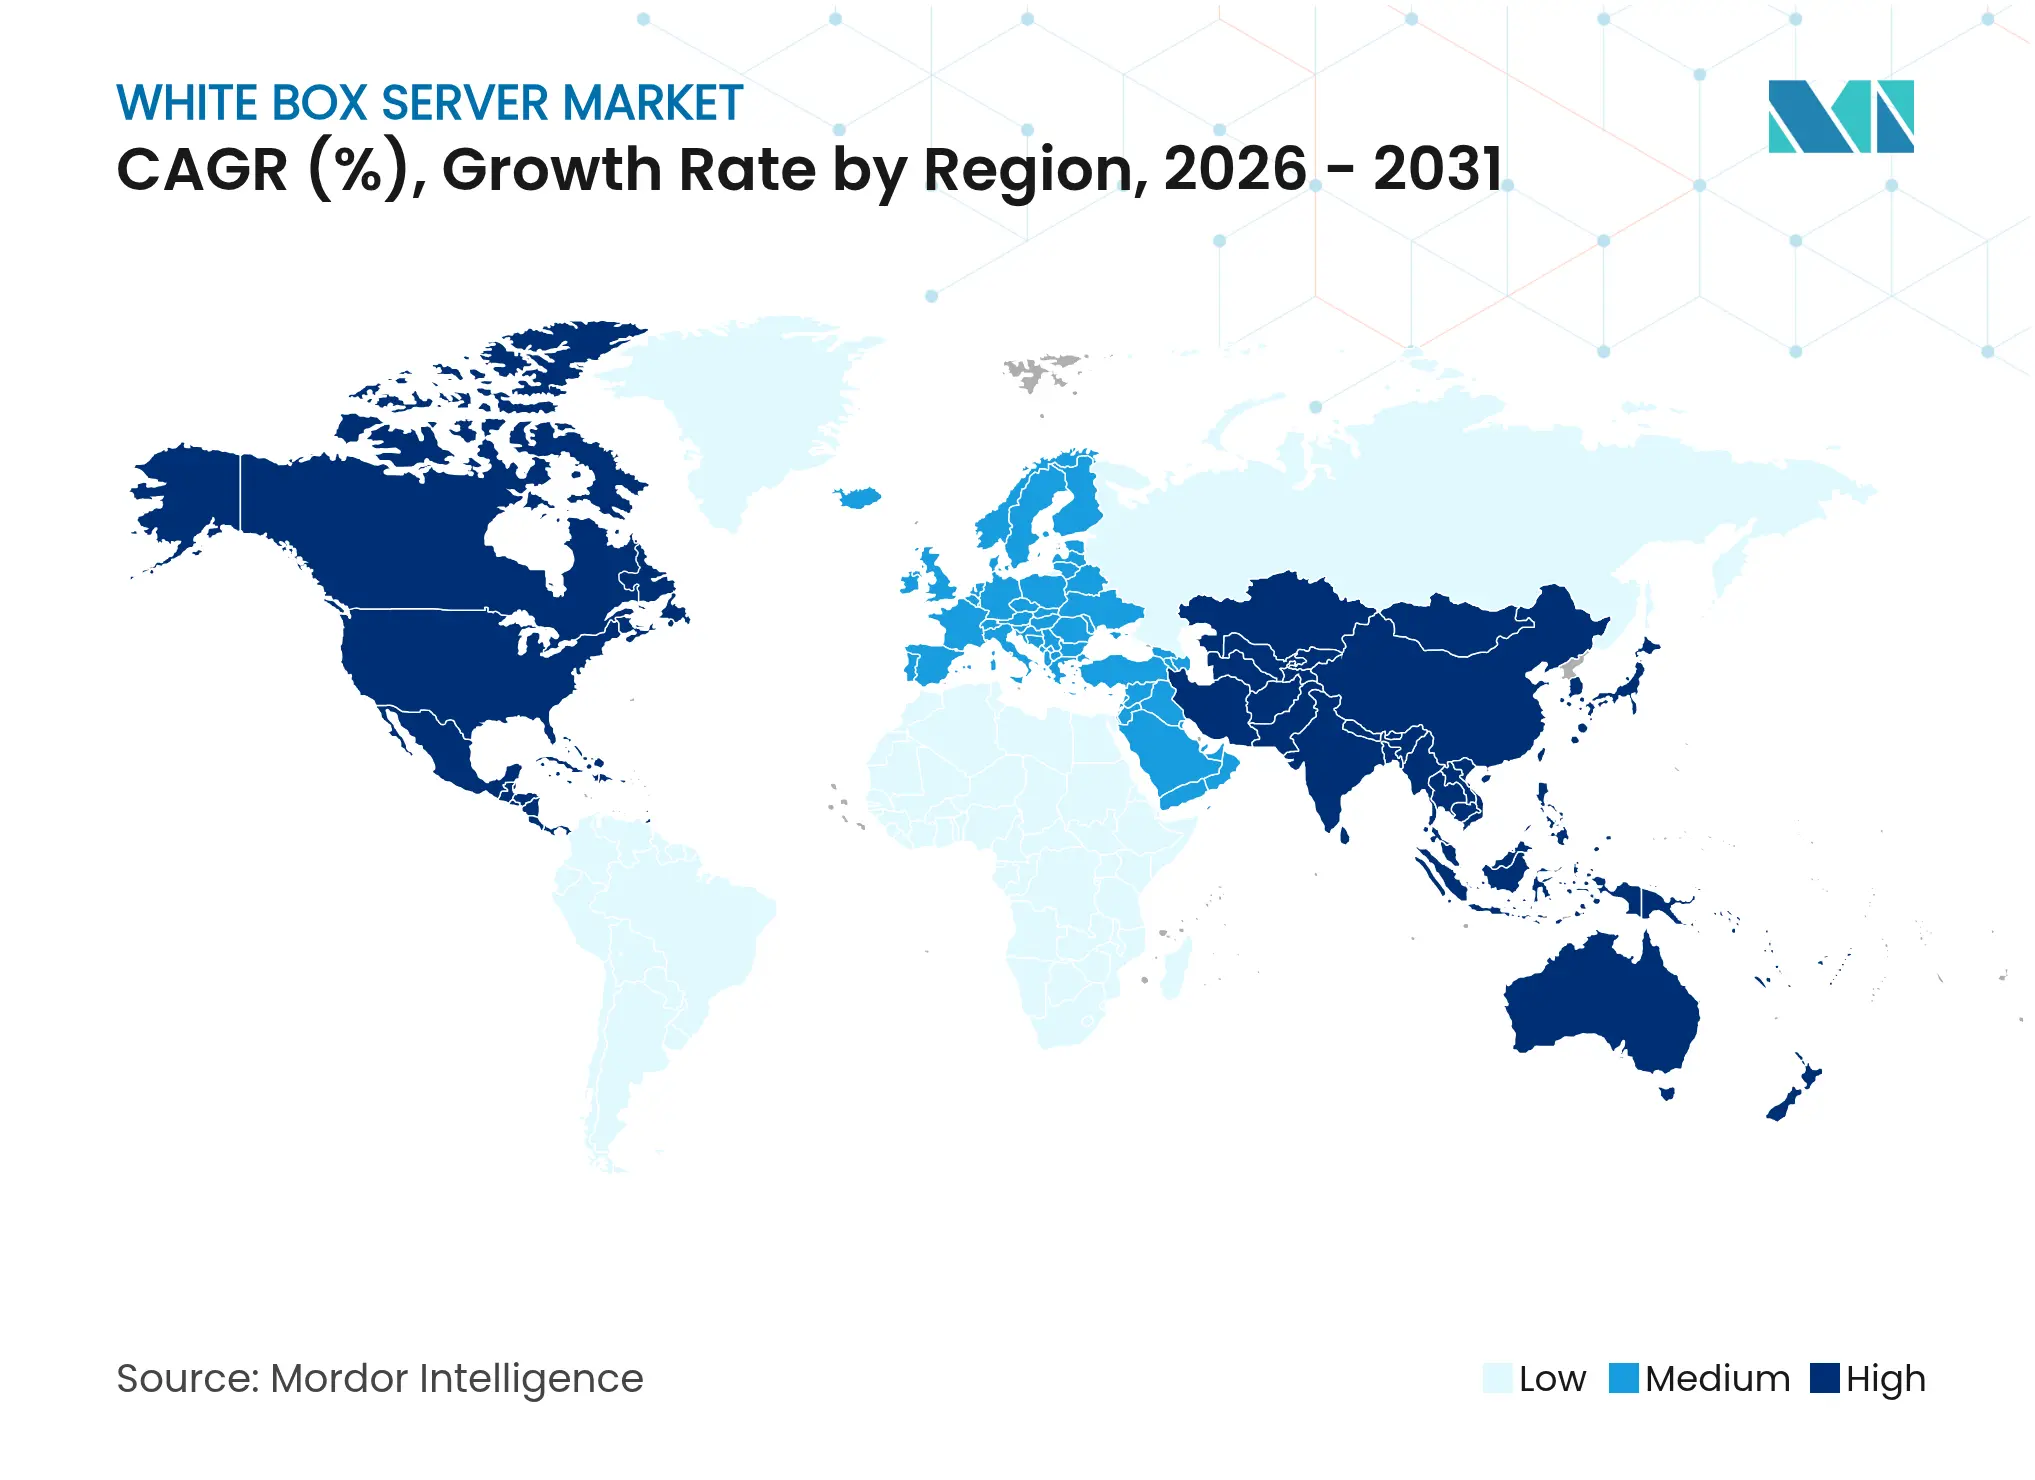
| Fastest Growing Market | Asia Pacific |
| Largest Market | North America |
| Market Concentration | High |
Major Players *Disclaimer: Major Players sorted in no particular order. Image © Mordor Intelligence. Reuse requires attribution under CC BY 4.0. |
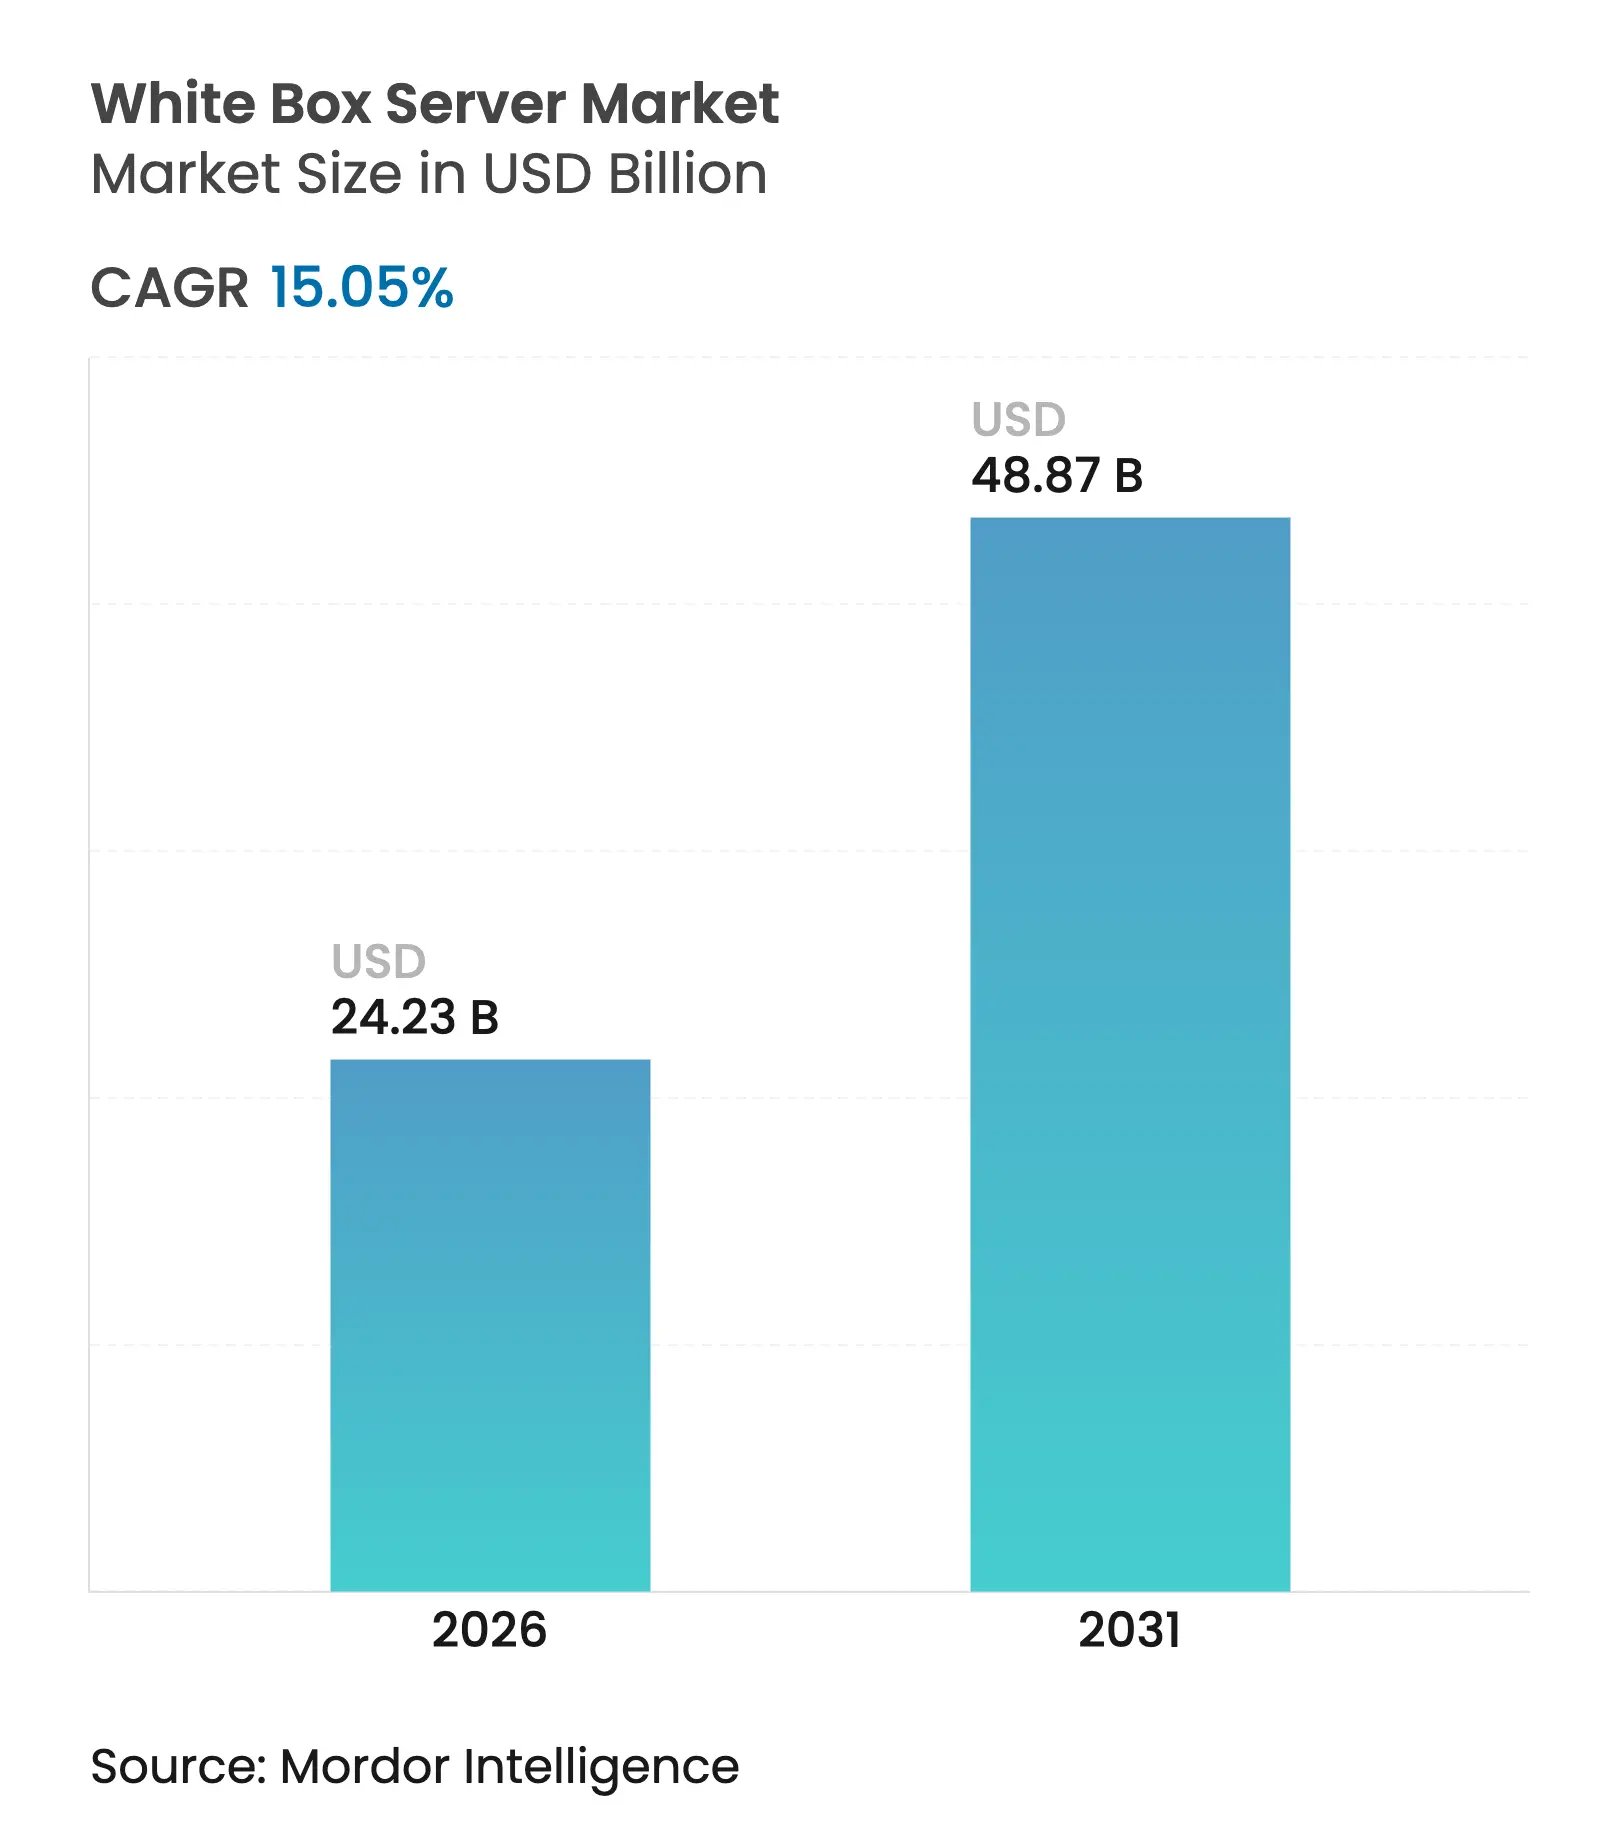
The white box server market size was valued at USD 21.06 billion in 2025 and estimated to grow from USD 24.23 billion in 2026 to reach USD 48.87 billion by 2031, at a CAGR of 15.05% during the forecast period (2026-2031). Accelerated adoption by hyperscale cloud providers, rising AI and GPU-dense workloads, and the cost advantage of direct original design manufacturer (ODM) sourcing underpin this growth. Enterprises increasingly view servers as commodity infrastructure and favor tailor-made configurations that lower total cost of ownership. Taiwan’s ODM cluster delivers rapid design iterations and competitive pricing, allowing buyers to bypass traditional OEM mark-ups. Standardization efforts under the Open Compute Project (OCP) further reduce integration complexity, encouraging broader enterprise uptake.
Key Report Takeaways
Note: Market size and forecast figures in this report are generated using Mordor Intelligence's proprietary estimation framework, updated with the latest available data and insights as of 2026.
Drivers Impact Analysis
| Driver | (~) % Impact on CAGR Forecast | Geographic Relevance | Impact Timeline | |||
|---|---|---|---|---|---|---|
Customization-driven
CapEx savings
Customization-driven
CapEx savings
| +3.2% | Global; strongest in North America and Asia-Pacific | Medium term (2-4 years) |
(~) % Impact on
CAGR Forecast
:
+3.2%
|
Geographic
Relevance
:
Global; strongest in
North America and Asia-Pacific
|
Impact Timeline
:
Medium term (2-4
years)
|
Hyperscale and cloud workload surge
Hyperscale and cloud workload surge
| +4.1% | Global, led by North America, expanding in Asia-Pacific | Short term (≤ 2 years) | |||
AI / GPU-dense
workload uptake
AI / GPU-dense
workload uptake
| +3.8% | North America and Europe primary; Asia-Pacific secondary | Short term (≤ 2 years) | |||
Open Compute Project
ecosystem scale-up
Open Compute Project
ecosystem scale-up
| +2.1% | Global, strongest in North America | Medium term (2-4 years) | |||
Composable
disaggregated infrastructure
Composable
disaggregated infrastructure
| +1.4% | North America and Europe; emerging in Asia-Pacific | Long term (≥ 4 years) | |||
National
open-hardware sovereignty programs
National
open-hardware sovereignty programs
| +0.9% | Europe primary; emerging in Asia-Pacific | Long term (≥ 4 years) | |||
| Source: Mordor Intelligence | ||||||
Customization-driven Capex savings
White box configurations cut capital expenditure by 25-30% against comparable OEM systems, as organizations purchase only the components their workloads require[1]Google Cloud Platform, “Deutsche Bank modernizes trading with Google Distributed Cloud,” cloud.google.com. Operating cost benefits follow because optimized builds consume less power and need fewer cooling resources. Finance leaders demanding granular justification of infrastructure budgets accelerate the shift to direct ODM engagement. The ability to specify form factor, power envelope, and I/O layout removes the premium once paid for one-size-fits-all OEM features.
Hyperscale and cloud workload surge
Cloud service providers need thousands of servers per build-out and value rapid lead times over brand labels. Foxconn projects AI servers to exceed 50% of its server revenue in 2025, reflecting a pivot toward GPU-rich builds for inference clusters. Direct ODM procurement shortens deployment cycles and improves cost profiles, enabling providers to scale edge locations across multiple regions consistently.
AI / GPU-dense workload uptake
AI frameworks demand high-bandwidth memory and accelerated compute that mainstream designs cannot sustain. Northwestern Medicine recorded 40% gains in radiology throughput after installing NVIDIA H100-equipped system. White box vendors integrate the newest GPUs and liquid-cooling loops within weeks, outpacing OEM product-cycle cadence.
Open Compute Project ecosystem scale-up
OCP reference designs simplify interoperability and cut qualification times for enterprises reluctant to adopt bespoke hardware earlier in the decade. Hardware sold under OCP guidelines is set to reach USD 46 billion in 2025, broadening the buyer base beyond hyperscalers. Standardized components reduce vendor lock-in and facilitate multi-sourcing strategies.
Restraints Impact Analysis
| Restraint | (~) % Impact on CAGR Forecast | Geographic Relevance | Impact Timeline | |||
|---|---|---|---|---|---|---|
Limited ODM global
service coverage
Limited ODM global
service coverage
| -1.8% | Global; most pronounced in emerging markets | Medium term (2-4 years) |
(~) % Impact on
CAGR Forecast
:
-1.8%
|
Geographic
Relevance
:
Global; most
pronounced in emerging markets
|
Impact Timeline
:
Medium term (2-4
years)
|
Weak enterprise
brand-warranty perception
Weak enterprise
brand-warranty perception
| -2.1% | North America and Europe | Short term (≤ 2 years) | |||
Semiconductor
supply-chain fragility
Semiconductor
supply-chain fragility
| -1.6% | Global; concentrated impact in Asia-Pacific | Short term (≤ 2 years) | |||
Firmware /
root-of-trust security gaps
Firmware /
root-of-trust security gaps
| -0.7% | Global; regulatory focus in Europe and North America | Long term (≥ 4 years) | |||
| Source: Mordor Intelligence | ||||||
Limited ODM global service coverage
Most ODMs cluster service centers in Asia, leaving enterprises elsewhere without 24/7 on-site swap programs. Organizations running mission-critical workloads weigh potential downtime costs higher than hardware savings, often favoring OEMs that maintain worldwide parts depots and field engineers.
Weak enterprise brand-warranty perception
Risk-averse IT managers equate familiar logos with reliability. Despite comparable warranty terms, lesser-known brands face scrutiny in regulated sectors where audit trails favor long-established vendors. The perception gap slows adoption for workloads that cannot tolerate failure.
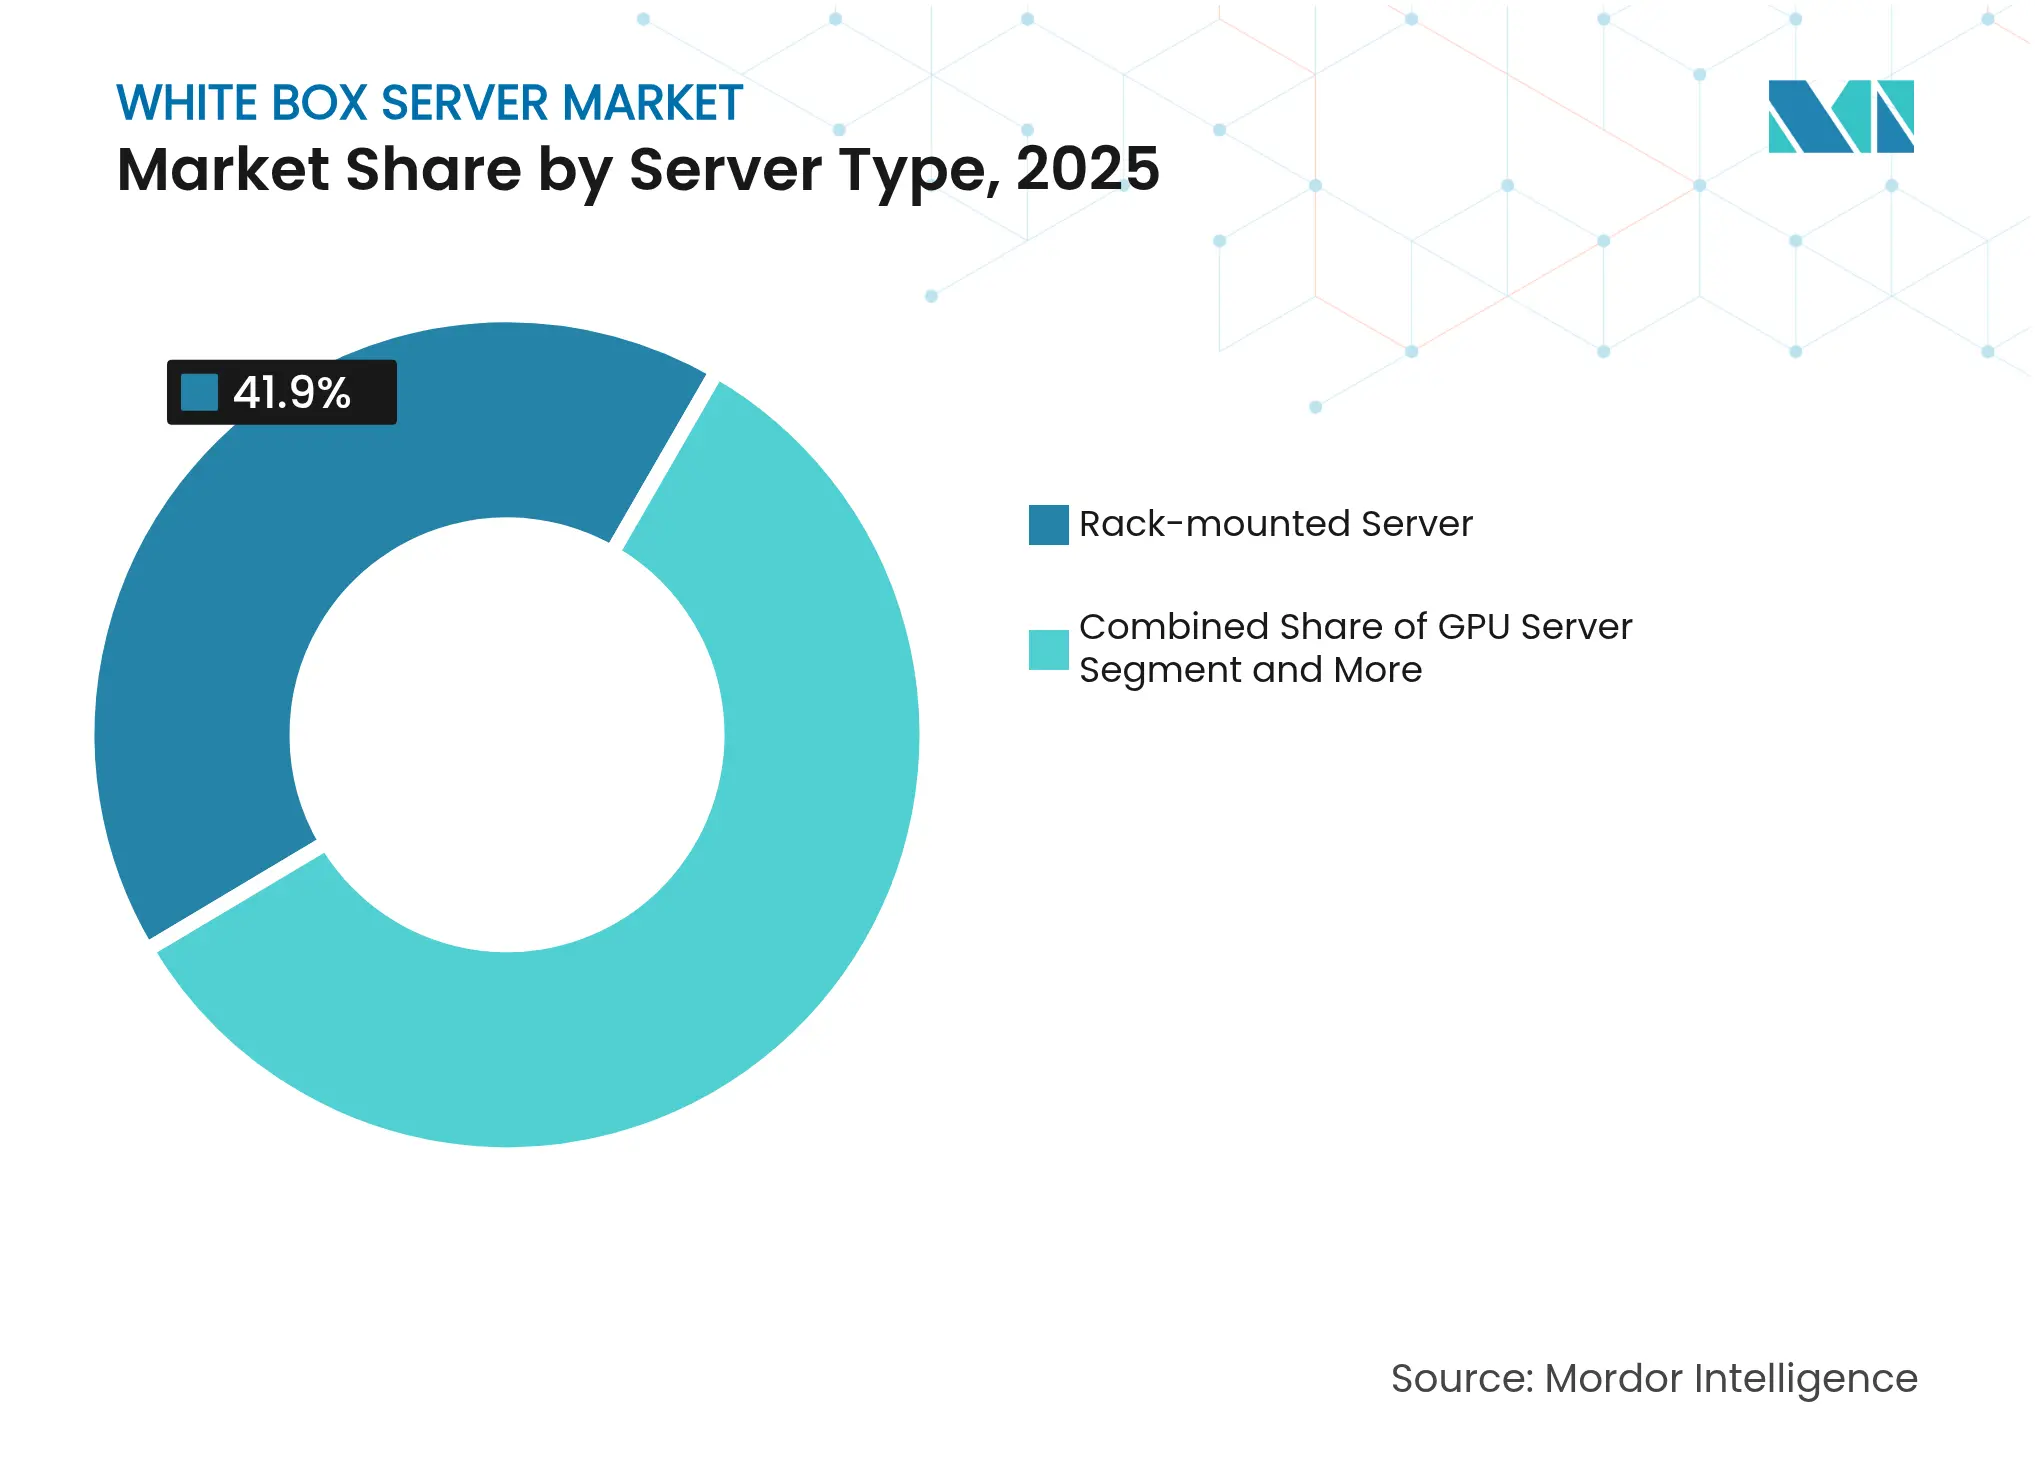
By Server Type: GPU servers redefine performance economics
Rack-mounted models retained a 41.90% share of the white box server market in 2025, anchored by standardized racks that dominate contemporary data centers. GPU servers, however, are expanding at a 16.98% CAGR as AI training and inference saturate workloads across healthcare, finance and manufacturing. Liquid-cooled AI SuperClusters delivered by Supermicro in Japan illustrate how specialized thermal solutions boost density without breaching power envelopes.
The white box server market size for GPU-optimized systems is projected to grow faster than any other configuration class between 2026 and 2031. Storage and twin servers serve data-heavy analytics and high-density compute nodes respectively, while blade platforms occupy niche enterprise deployments. Specialized designs underscore a broader pivot away from generic servers toward workload-specific hardware that maximizes performance per watt.
Note: Segment shares of all individual segments available upon report purchase
By Processor Type: Alternative architectures gain traction
x86 platforms commanded 91.45% of the white box server market size in 2025, yet ARM and RISC-V chips are growing at a 23.52% CAGR as buyers prioritize energy efficiency. China hosts 40% of global ARM server installations, a figure that will rise as sovereign IT policies champion non-x86 options.
The white box server industry benefits because ODMs integrate new silicon in weeks, whereas OEM roadmaps follow longer validation cycles. Ampere Computing’s 192-core processors exemplify high-density compute that reduces core-licensing fees for cloud-native workloads. Software ecosystem maturity remains the principal hurdle, but containerization and cross-compilation mitigate compatibility barriers for many microservices.
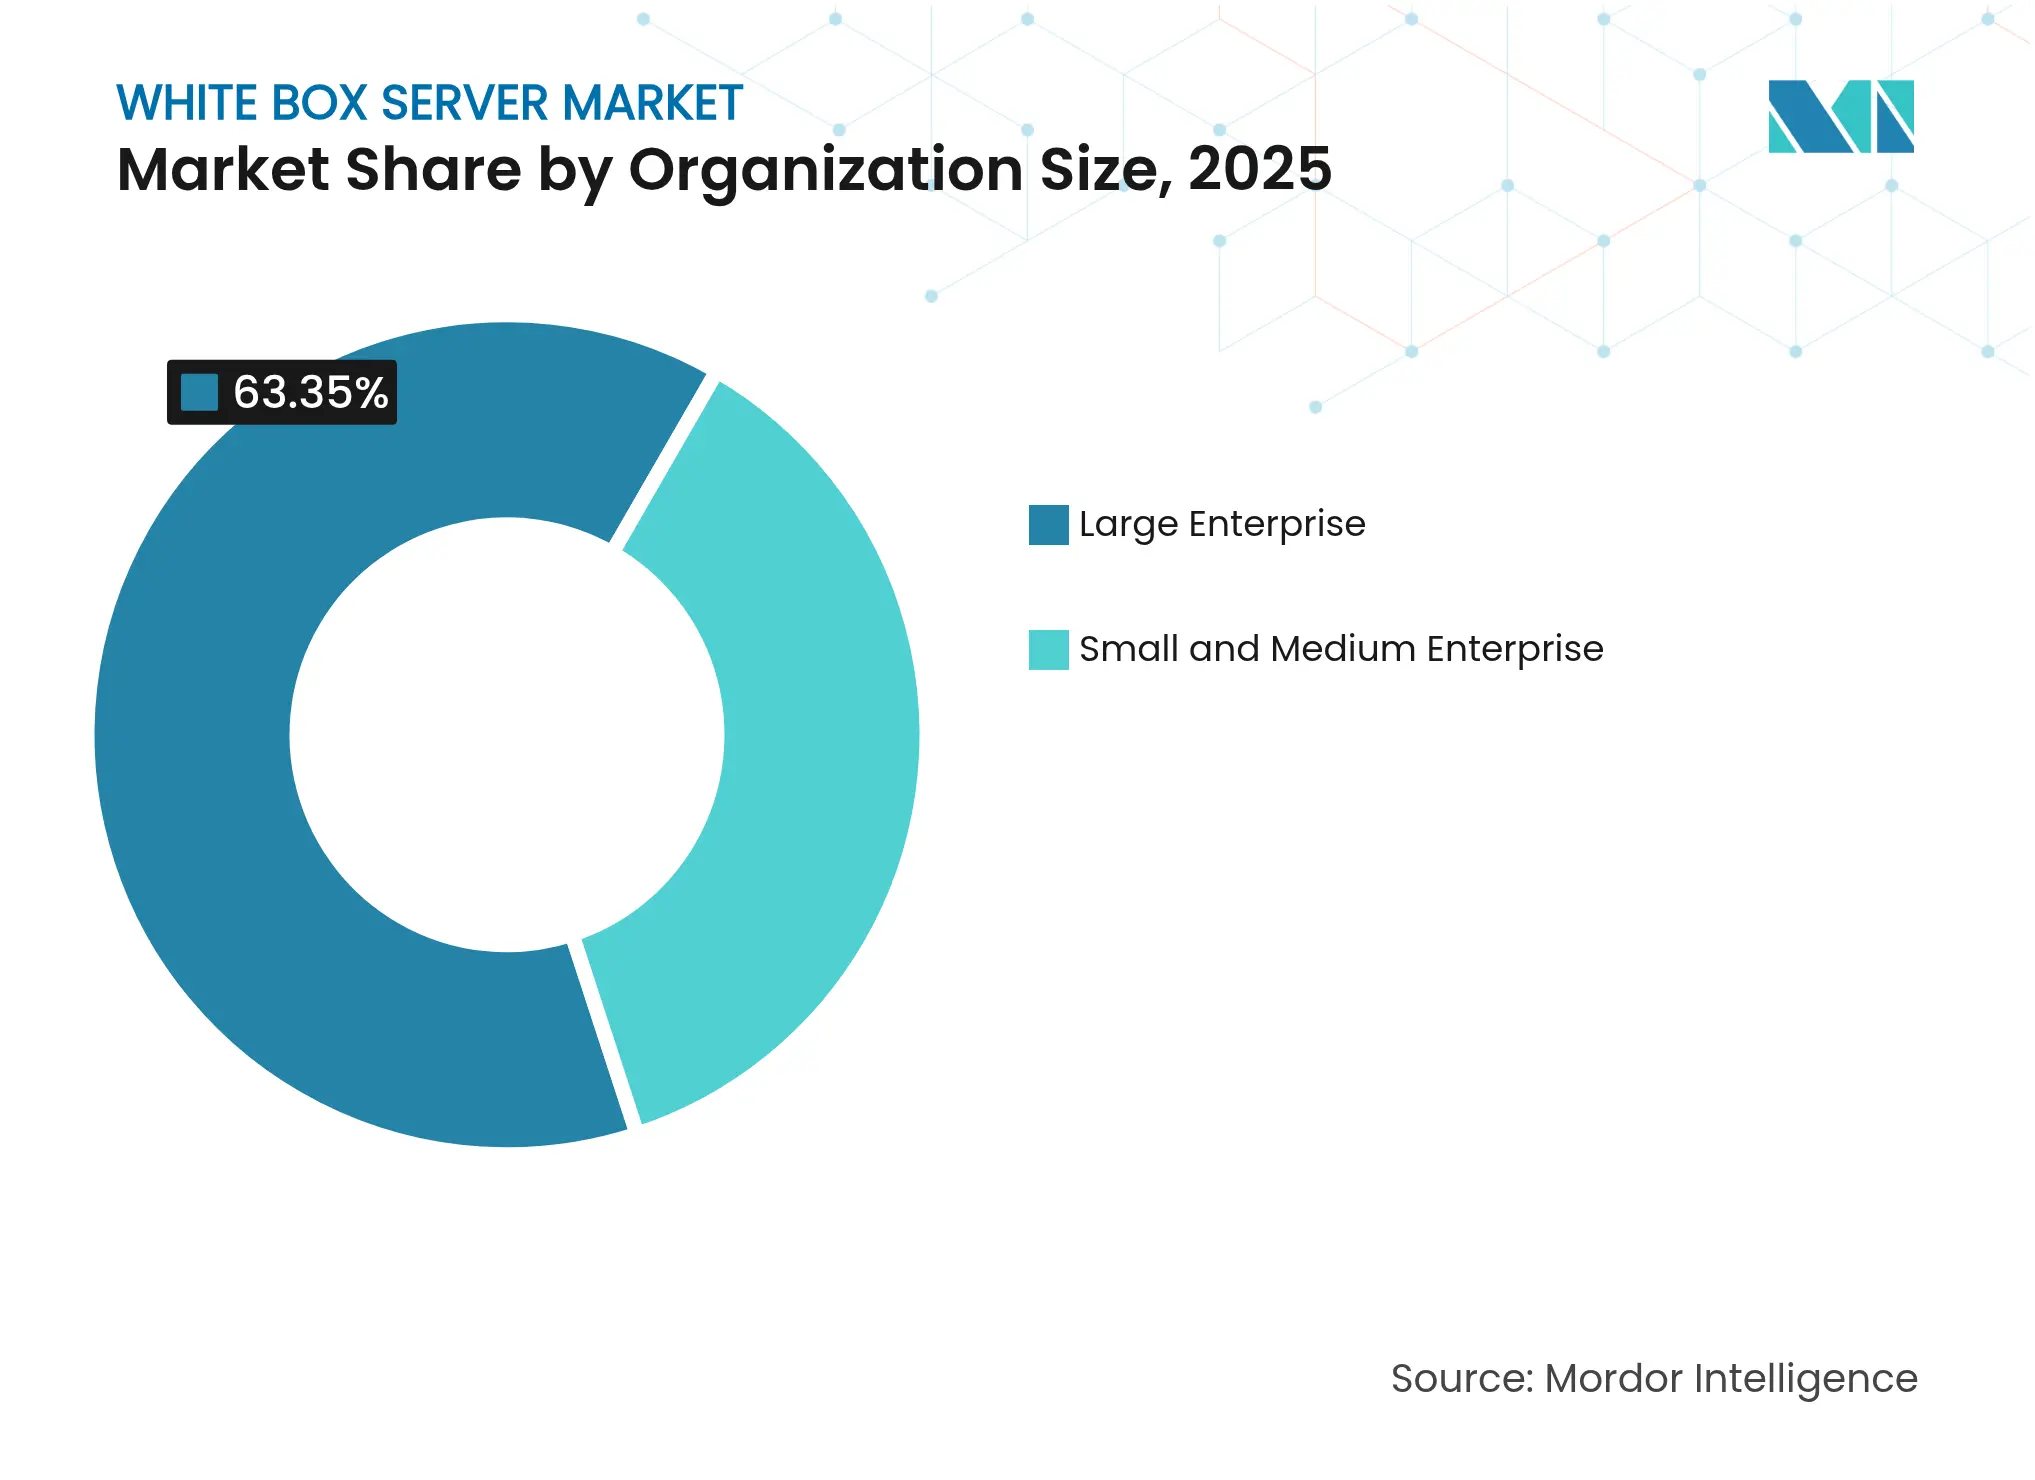
By Organization Size: SMEs close capability gaps
Large enterprises still control 63.35% of the white box server market, primarily due to established procurement frameworks and stringent support requirements. Yet small and medium enterprises are forecast to expand adoption at 13.74% CAGR through 2031 as cloud-native architectures and open-source stacks ease management overhead.
The white box server market share held by SMEs will climb as vendors package pre-validated configurations with remote management tools. These bundles replicate the plug-and-play convenience once exclusive to OEM appliances while preserving the cost savings of direct ODM sourcing. As digital transformation mandates permeate mid-market firms, value-driven infrastructure decisions intensify.
Note: Segment shares of all individual segments available upon report purchase
By End-user Vertical: Healthcare accelerates modernization
IT and telecommunications accounted for 28.15% of the white box server market in 2025, reflecting early hyperscale cloud adoption. Healthcare now leads growth, advancing at a 15.62% CAGR as diagnostic imaging and genomic sequencing datasets swell. Northwestern Medicine’s GenAI cluster cut model-training times by 40%, validating performance gains from GPU-dense configurations.
White box servers also penetrate manufacturing, banking and energy, each seeking workload-tuned builds for edge analytics, risk modeling and real-time grid optimization. National cyber-sovereignty concerns in government and defense further boost demand for open hardware unencumbered by proprietary firmware.
North America maintained 35.05% of the white box server market in 2025 on the back of hyperscale expansion and supportive regulatory stances toward open hardware. Meta and Google procure vast quantities directly from Taiwanese ODMs, compressing deployment windows for new data-center campuses. Tariff fluctuations have recently prompted some ODMs to shift assembly to Mexico and the United States, cushioning logistics risks without eroding cost advantages.
Asia-Pacific is projected to record the fastest growth at 15.18% CAGR, buoyed by China’s scale and Taiwan’s manufacturing dominance. Quanta Computer posted 30% year-on-year revenue growth to USD 0.048 trillion in 2024, driven largely by AI server demand. Regional data-center capacity of 12.2 GW in operation and 14.4 GW under development underscores sustained infrastructure expansion. Government incentives to foster local chip ecosystems further advance ARM and RISC-V adoption, amplifying ODM bargaining power.
Europe shows steady uptake, propelled by open-hardware sovereignty initiatives. The European Commission promotes RISC-V to curb dependence on non-EU intellectual property. Energy-efficiency mandates accelerate interest in liquid-cooled servers that reduce facility power usage effectiveness scores. Germany’s public-sector digital-workplace program exemplifies preference for vendor-neutral equipment, positioning white box solutions as compliant alternatives.
Market Concentration
The market remains highly fragmented, yet manufacturing concentration is high: Quanta Computer, Foxconn, Wistron, Supermicro and Wiwynn together supplied more than 80% of global white box shipments in 2024. Traditional OEMs such as Dell and HPE focus on integrated solutions and lifecycle services, but direct ODM engagement erodes their hardware margin stronghold.
Competition centers on time-to-market for emerging technologies. Supermicro’s partnership with xAI completed a 100,000-GPU data center in 122 days, illustrating how close collaboration with component vendors and in-house rack integration trims build schedules. Patent filings by Meta on low-latency failover topologies demonstrate hyperscalers’ willingness to design and even open-source niche innovations, accelerating vendor-neutral ecosystems.
New entrants include white box integrators that bundle global logistics, firmware validation and support into subscription models. Component suppliers also move upstream: NVIDIA provides reference designs for liquid-cooled AI systems, allowing ODMs to assemble turnkey clusters quickly. As semiconductor supply chains rebalance geographically, proximity to advanced-packaging facilities will shape future vendor competitiveness.

*Disclaimer: Major Players sorted in no particular order
1. INTRODUCTION
2. RESEARCH METHODOLOGY
3. EXECUTIVE SUMMARY
4. MARKET LANDSCAPE
5. MARKET SEGMENTATION
6. COMPETITIVE LANDSCAPE
7. MARKET OPPORTUNITIES AND FUTURE OUTLOOK
Market Definitions and Key Coverage
Our study defines the white box server market as all newly built, unbranded rack, blade, GPU, twin, storage, and density-optimized servers that are assembled by original-design manufacturers or electronic manufacturing services providers using commercial off-the-shelf components and shipped to end users or cloud builders for data-center and edge workloads.
Scope Exclusions: Branded OEM servers, refurbished hardware, and discrete networking or storage appliances are excluded.
Segmentation Overview
Detailed Research Methodology and Data Validation
Primary Research
Analysts interviewed ODM executives in Taiwan, procurement leads at North American hyperscalers, and regional system integrators in Europe and India. These conversations validated shipment mixes, average selling prices, non-x86 trial volumes, and refresh cycles; they clarified regional demand nuances that public data only hinted at.
Desk Research
We began with public datasets that anchor global supply and demand, customs import codes for server chassis, Uptime Institute's operational data-center census, and Open Compute Project adoption notes; these were supplemented by statistics from bodies such as the China Institute of Electronics, Eurostat trade tables, and the United States International Trade Commission. Company filings captured through D&B Hoovers and news archives from Dow Jones Factiva helped us follow ODM financials and hyperscaler capex signals. Trade journals and peer-reviewed cloud architecture papers rounded out technology trend insights. The sources noted are illustrative; numerous additional open publications informed our desk work.
Market-Sizing & Forecasting
A top-down model starts with global x86 and non-x86 server shipments reconstructed from production and trade data, which are then segmented by ODM share and configured ASPs. Select bottom-up checks, sampled supplier roll-ups and cloud rack counts, help refine totals. Key variables include hyperscale data-center capacity additions, rack power density limits, ODM share shift, non-x86 penetration rates, processor ASP trends, and Open Compute adoption. Multivariate regression with scenario analysis projects 2026-2030 values, while missing granular shipment splits are filled through ratio imputation from verified interviews.
Data Validation & Update Cycle
Outputs pass three-layer analyst review; variance flags trigger re-checks with source owners, and client copies are refreshed each year, with interim updates after material industry events.
Why Mordor's White Box Server Market Baseline Commands Reliability
Benchmark comparison
Published estimates often differ because each publisher selects its own scope, base year inputs, and forecast levers.
Buyers deserve clarity on why numbers vary and which set best matches real-world purchasing dynamics.
| Market Size | Anonymized source | Primary gap driver | ||
|---|---|---|---|---|
USD 21.06 B (2025) | Mordor Intelligence | - | Anonymized source:Mordor Intelligence | Primary gap driver:- |
USD 18.23 B (2024) | Global Consultancy A | Narrow ODM mix and lack of non-x86 coverage | ||
USD 16.50 B (2024) | Industry Journal B | Uses shipped unit ASPs without hyperscaler discount adjustment | ||
USD 16.26 B (2023) | Regional Consultancy C | Relies on historic OEM data, omits density-optimized and edge servers |
Pricing Strategy for Semiconductor Components
3 Min Read
Accelerating Additive Manufacturing Adoption in India
3 Min Read
When decisions matter, industry leaders turn to our analysts. Let’s talk.