Dark Fiber Market Size and Share
Market Overview
| Study Period | 2020 - 2031 |
|---|---|
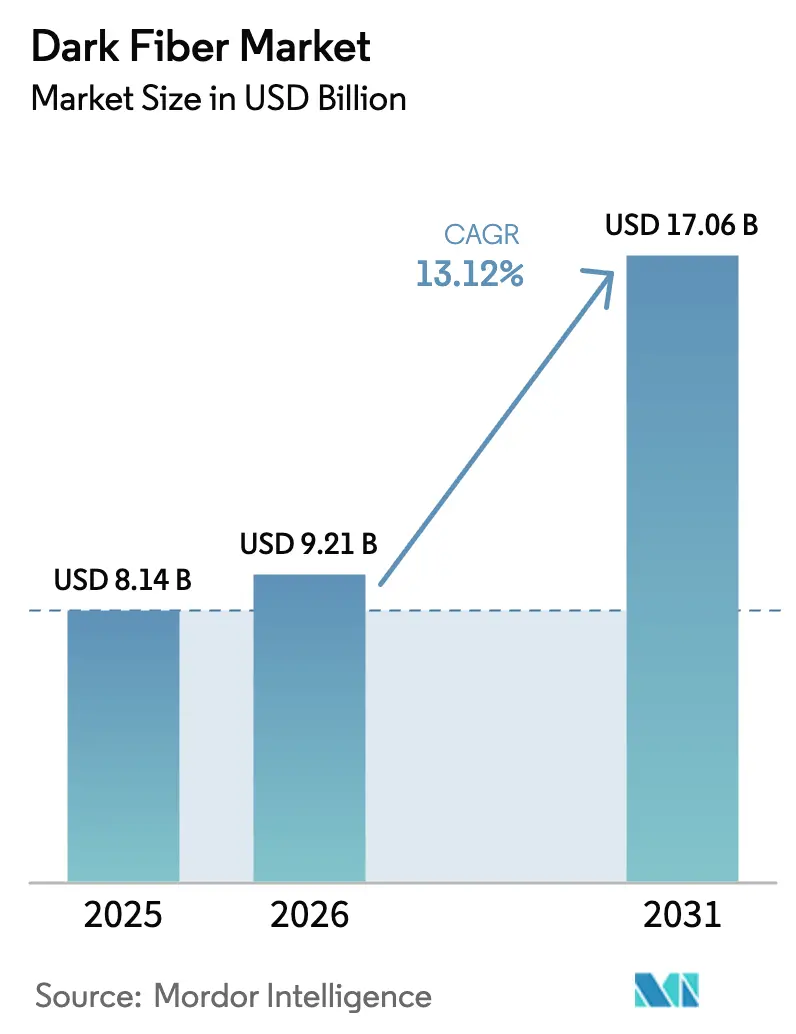
| Market Size (2026) | USD 9.21 Billion |
| Market Size (2031) | USD 17.06 Billion |
| Growth Rate (2026 - 2031) | 13.12% CAGR |
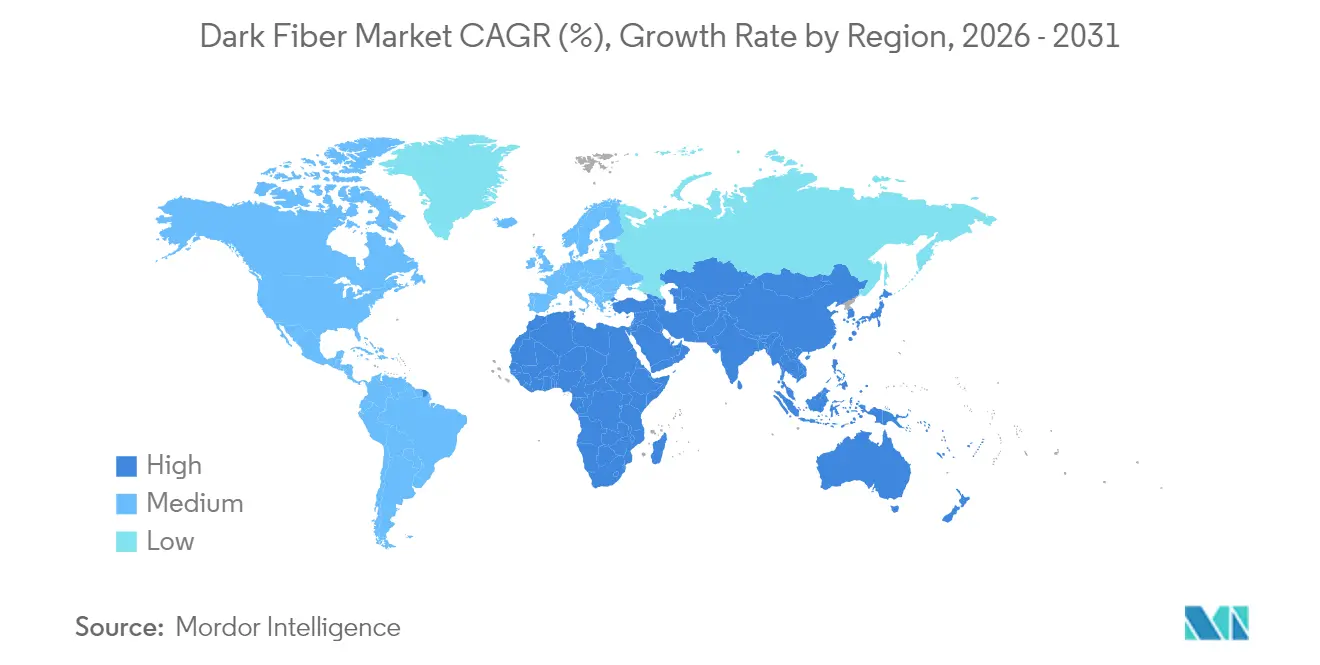
| Fastest Growing Market | Asia Pacific |
| Largest Market | North America |
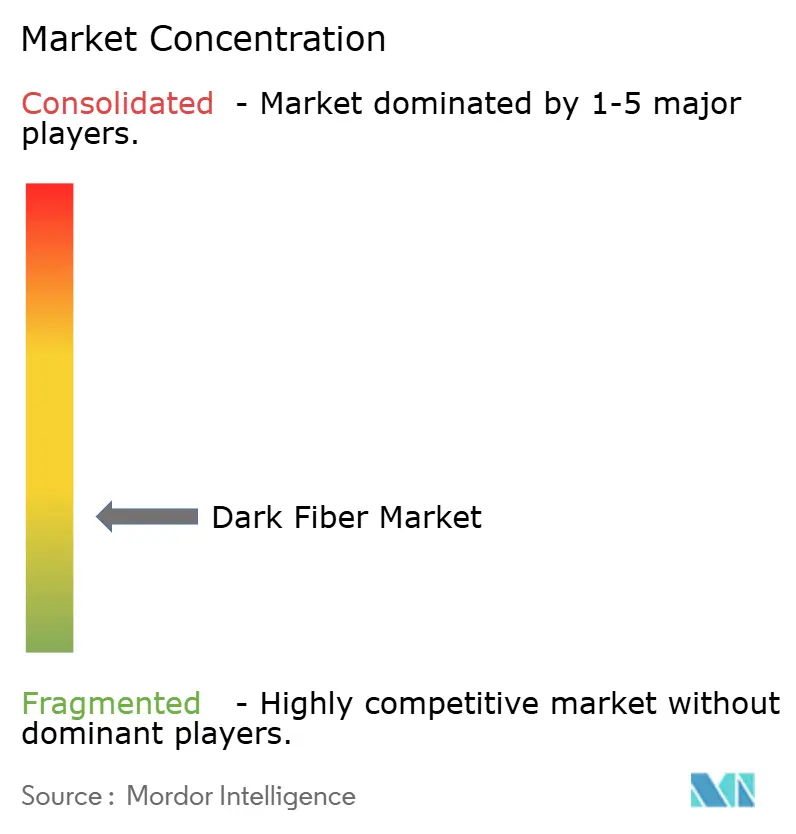
| Market Concentration | Low |
Major Players *Disclaimer: Major Players sorted in no particular order Image © Mordor Intelligence. Reuse requires attribution under CC BY 4.0. | |
Dark Fiber Market Analysis by Mordor Intelligence
The dark fiber market size in 2026 is estimated at USD 9.21 billion, growing from 2025 value of USD 8.14 billion with 2031 projections showing USD 17.06 billion, growing at 13.12% CAGR over 2026-2031. Fueled by the exponential bandwidth demands of artificial intelligence workloads, edge computing rollouts, and dense 5G backhaul, the dark fiber market is transitioning from leased lit services to owned infrastructure models. Hyperscale data center operators now favor direct control over fiber routes, pressuring incumbent telecom carriers that historically monetized capacity by the strand. Emerging deployment techniques, such as micro-trenching and aerial placement, help navigate urban right-of-way constraints, even as specialty fiber shortages add complexity. Geographic growth is pivoting toward the Asia-Pacific region, where sovereign cloud mandates and nationwide rural broadband programs are accelerating build-outs. Long-haul expansions remain essential for inter‐regional traffic flows, but submarine routes are gaining momentum as content providers scramble for diverse paths across oceans.
Key Report Takeaways
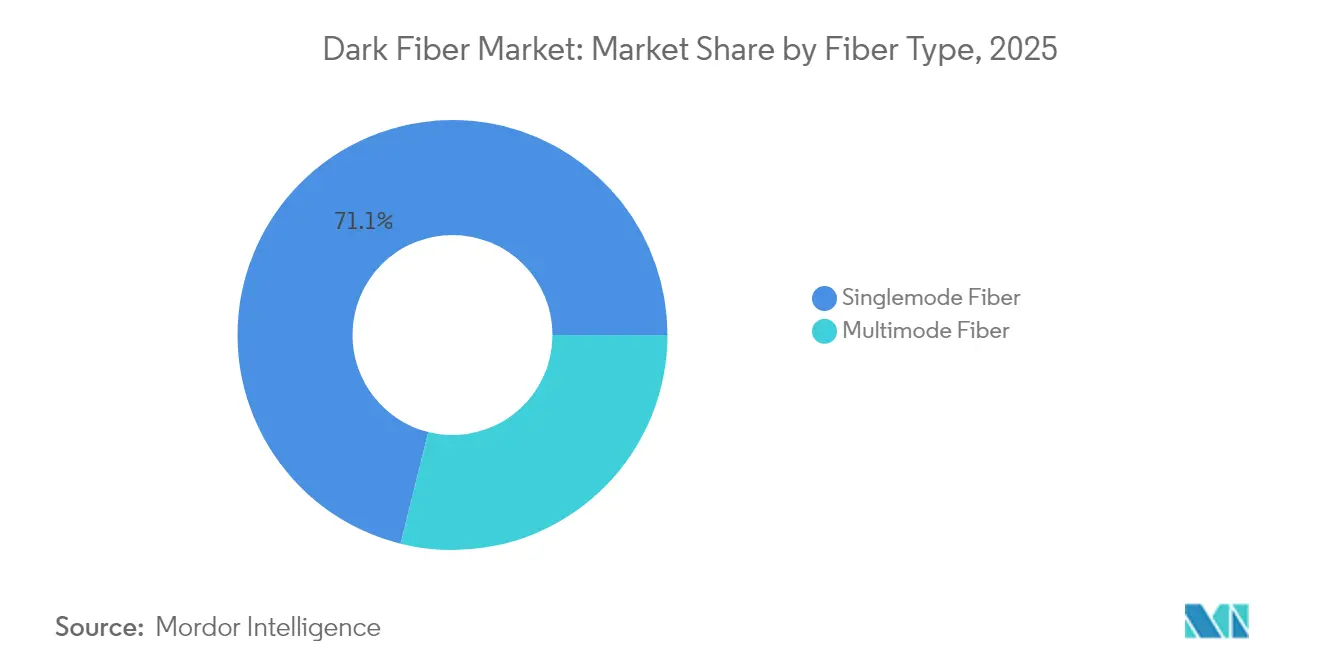
- By fiber type, single-mode fiber led with 71.12% revenue share in 2025, while multimode fiber is set to grow at a 13.64% CAGR through 2031.
- By network type, long-haul infrastructure captured 51.76% of the 2025 dark fiber market share; submarine deployments are forecast to expand at a 13.73% CAGR to 2031.
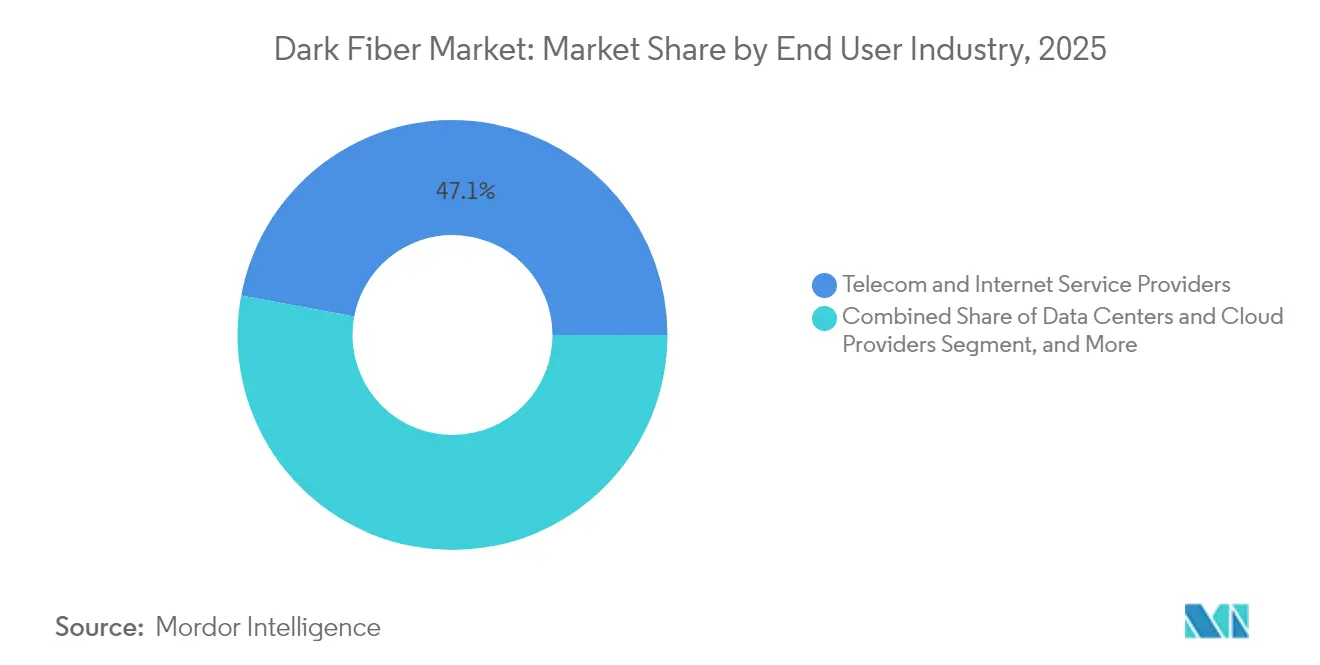
- By end-user industry, telecom and internet service providers held 47.05% of the 2025 revenue, whereas data centers and cloud providers are advancing at a 15.61% CAGR during the forecast period.
- By application, data transmission and telecommunication accounted for 52.44% of the dark fiber market size in 2025, and industrial automation is projected to grow at a 13.98% CAGR through 2031.
- By geography, North America commanded 39.21% of the 2025 revenue, while the Asia-Pacific region posted the fastest expansion with a 13.97% CAGR out to 2031.
Note: Market size and forecast figures in this report are generated using Mordor Intelligence’s proprietary estimation framework, updated with the latest available data and insights as of 2026.
Global Dark Fiber Market Trends and Insights
Drivers Impact Analysis*
| Driver | (~) % Impact on CAGR Forecast | Geographic Relevance | Impact Timeline |
|---|---|---|---|
| Growing Bandwidth Demand from Cloud and Content Providers | +3.2% | Global, concentrated in North America and Asia-Pacific | Medium term (2-4 years) |
| Rising Adoption of 5G Networks Requiring Dense Fiber Backhaul | +2.8% | Global, with early deployment in developed markets | Short term (≤ 2 years) |
| Increasing Data Center Interconnect Deployments | +2.5% | North America, Europe, Asia-Pacific core markets | Medium term (2-4 years) |
| Telecom Operators' Shift from Copper to Fiber Infrastructure | +2.1% | Global, accelerated in emerging markets | Long term (≥ 4 years) |
| Municipal Open-Access Dark Fiber Initiatives Accelerating Local Builds | +1.4% | North America and Europe, selective Asia-Pacific | Medium term (2-4 years) |
| Surging Subsea Cable Branching Units Enabling Terrestrial Landing Dark Fiber | +1.3% | Coastal regions globally, island nations | Long term (≥ 4 years) |
| Source: Mordor Intelligence | |||
Growing Bandwidth Demand From Cloud And Content Providers
Cloud hyperscalers crossed the utilization threshold where owning strands is cheaper than leasing, prompting multi-country route acquisitions that added 15,000 route-miles to Amazon and USD 2.3 billion in new fiber to Microsoft in 2024.[1]Reuters, “AI Boom Drives Demand for Data Center Infrastructure,” REUTERS.COM Content delivery networks now require sub-10 millisecond latency in metropolitan areas, leading to dense ring topologies that incumbent carriers struggle to monetize under legacy pricing models. The shift transfers pricing power to neutral infrastructure specialists and enlarges the addressable dark fiber market for wholesale providers.
Rising Adoption Of 5G Networks Requiring Dense Fiber Backhaul
Each 5G cell site demands 10-25 Gbps throughput, a tenfold jump from 4G. Verizon alone added 45,000 new fiber connections during its 2024 Ultra Wideband rollout, investing USD 1.8 billion primarily in dark fiber contracts.[2]Wall Street Journal, “Data Sovereignty Drives Fiber Infrastructure Investment,” WSJ.COM The European Union’s Gigabit Infrastructure Act accelerates similar builds across member states. Densification outpaces conduit availability, elevating micro-trenching and pole attachments as cost-efficient alternatives and sustaining the near-term demand for dark fiber.
Increasing Data Center Interconnect Deployments
Interconnect traffic increased by 340% between 2024 and 2025 as distributed cloud architectures connected edge and core facilities. Digital Realty committed USD 890 million for metro rings in 23 cities, illustrating the capital shift toward owning links that secure sub-5 millisecond performance.[3]Financial Times, “Submarine Cables Connect Asia-Pacific Markets,” FT.COM Ultra-low-latency requirements in finance and gaming intensify strand ownership strategies, converting demand into multi-stranded, redundant rings that enlarge the dark fiber market footprint.
Telecom Operators’ Shift From Copper To Fiber Infrastructure
Copper upkeep costs rose 35% in 2025, pushing operators to retire legacy loops. AT&T’s modernization program plans USD 14 billion for 30 million fiber-served premises by 2030, sourcing dark fiber routes in rural and suburban zones. Regulatory speed mandates in emerging markets add urgency. Infrastructure-as-a-service vendors supplying turnkey strands help carriers defray capital while fueling the dark fiber market’s rural penetration.
Restraints Impact Analysis*
| Restraint | (~) % Impact on CAGR Forecast | Geographic Relevance | Impact Timeline |
|---|---|---|---|
| High Initial Capital Expenditure for Fiber Laying | -2.1% | Global, more pronounced in developing markets | Short term (≤ 2 years) |
| Complex Right-of-Way and Permitting Procedures | -1.8% | North America and Europe, urban corridors | Medium term (2-4 years) |
| Fiber Route Saturation in Tier-1 Metro Corridors | -1.2% | Major metropolitan areas globally | Long term (≥ 4 years) |
| Supply Chain Disruptions for Specialty Fiber and Duct Materials | -0.9% | Global, concentrated manufacturing dependencies | Short term (≤ 2 years) |
| Source: Mordor Intelligence | |||
High Initial Capital Expenditure For Fiber Laying
Typical construction now costs USD 15,000–50,000 per route mile, inflated by a 28% rise in equipment and labor costs in 2024. Bond-funded municipal plans stalled, with 40% of projects missing financing milestones and slip dates extending beyond 18 months. Seven-plus-year returns deter new entrants and incite consolidation trends that may temper the addressable base of independent providers in the dark fiber market.
Complex Right-Of-Way And Permitting Procedures
Tier-1 cities face dual controls from transportation and environmental agencies, stretching timelines by 12–24 months. Submarine landing permits can exceed 36 months as coastal protection rules tighten, with the Federal Communications Commission processing 847 applications in 2024 at an average of 28 months. Urban property owners command USD 125,000 per mile for access, which lifts cost curves and delays monetization, especially for startups relying on external capital.
*Our forecasts treat driver/restraint impacts as directional, not additive. The impact forecasts reflect baseline growth, mix effects, and variable interactions.
Segment Analysis
By Fiber Type: Singlemode Leads Backbone Economics
Single-mode fiber captured 71.12% of 2025 revenue and remains the anchor for long-distance builds, thanks to minimal signal loss over multi-kilometer spans, a performance edge that protects the dark fiber market share leadership of this strand type. Terabit-class wavelength division multiplexing keeps single-mode relevant for backbone, metropolitan, and submarine projects where operators need room to scale capacity without undertaking new civil works. The dark fiber market size tied to single-mode strands expands further as enterprises demand carrier-grade resilience on private routes that bypass congested lit networks.
Multimode fiber, although limited to sub-300-meter reaches, is experiencing an acceleration of 13.64% CAGR in data center and factory environments, where wider cores simplify installation and reduce transceiver costs. Composite cables bundling single-mode and multimode cores now dominate campus builds, allowing customers to future-proof against shifting distance and bandwidth needs. Vendors are pushing OM5 multimode enhancements that support short-wave division multiplexing, a step that could stretch use cases beyond server-row connections. The combined approach secures duct utilization efficiency, reinforcing operator preference for higher core counts that preserve upgrade headroom without repeat trenching.


By Network Type: Long-Haul Dominance, Submarine Momentum
Long-haul infrastructure accounted for 51.76% of 2025 revenue, underscoring its pivotal role in linking hyperscale data centers and national traffic hubs. Lucrative intercity routes command the highest revenue per strand kilometer and protect the segment’s dark fiber market share. Metro rings terminate this capacity into enterprise districts, but it is the backbone span that ensures uninterrupted cloud and content delivery across continents.
Submarine systems are projected to post the fastest 13.73% CAGR as global content providers co-fund new cables that diversify geopolitical exposure and reduce latency between hemispheres. Next-generation wet plant designs now ship with 24 to 48 fiber pairs, converting physical routes into dense wholesale inventories that expand the dark fiber market size associated with subsea corridors. Meanwhile, metro operators exploit “dig-once” policies to extend landings inland, stitching together hybrid terrestrial-subsea meshes that raise resiliency benchmarks for OTT and fintech customers.
By End User Industry: Data Centers Drive Ownership Shift
Telecom and internet service providers still held 47.05% of 2025 spend, yet hyperscale data centers and cloud operators are scaling at a 15.61% CAGR as they swap leased wavelengths for outright asset control, redirecting budget toward 20-year indefeasible rights of use that enlarge their slice of the dark fiber market size. Having strands on the balance sheet tightens latency guarantees, shields against tariff hikes, and eases multicloud peering within neutral colocation campuses.
Government and defense agencies follow a similar path, ring-fencing secure capacity that meets sovereignty rules, while financial institutions chase microsecond advantages between trading venues. Smaller verticals, such as healthcare and education, now tap into managed dark solutions, where operators bundle monitoring, splicing, and spectrum provisioning, thereby lowering the skill barrier to fiber ownership. This service overlay widens the customer funnel and sustains mid-teens growth even as incumbent carriers rationalize copper retirement plans.
By Application: Industrial Automation Gains Traction
Data transmission and telecommunication retained 52.44% of the 2025 revenue, serving internet backbones, enterprise WANs, and wholesale transit demands that underpin the foundational dark fiber market share for classic carrier workloads. These routes require rigorous service-level guarantees that favor dark strands over best-effort lit transport, ensuring deterministic performance for bandwidth-intensive SaaS and video traffic.
Industrial automation, however, is advancing at a 13.98% CAGR as manufacturers retrofit plants with machine vision, predictive maintenance, and autonomous guided vehicles that rely on jitter-free fiber loops. Factory operators deploy ring-topology dark fiber to shuttle high-volume sensor data within microsecond budgets, supporting Industry 4.0 objectives without risk of electromagnetic interference. Military and emergency services networks adopt similar hardened architectures for mission-critical uptime, broadening the addressable market size for dark fiber by specialized providers who can meet stringent physical security and redundancy norms.

Geography Analysis
North America accounted for 39.21% of 2025 spending, driven by hyperscale data center clusters in Virginia, Ohio, and Texas, as well as a wave of municipal open-access builds. The dark fiber market size in North America is growing steadily as operators exchange legacy copper for fiber to meet regulatory minimums on broadband speeds, while state-level subsidy programs help offset the economic challenges faced by smaller carriers in rural areas. Urban congestion challenges are being mitigated as cities streamline multi-agency permitting into one-touch processes, thereby progressively reducing build timelines.
Europe supports growth through the Gigabit Infrastructure Act, which mandates that buildings be fiber-ready by 2027. Cross-border connectivity stimulates investments in new terrestrial corridors, extending from Frankfurt to Marseille, and submarine entries into Ireland and Portugal. The region’s data sovereignty rules are driving demand for intra-EU routing diversity, resulting in a second-tier boom in dark fiber market contracting among data center operators, financial firms, and cloud resellers. Asia-Pacific posts the fastest 13.97% CAGR thanks to China’s USD 43 billion rural fiber subsidy and India’s USD 8.7 billion modernization program. Southeast Asian nations are pursuing sovereign cloud projects, which involve establishing terrestrial corridors from Singapore through Malaysia into Thailand. Meanwhile, Japan and South Korea are upgrading their aging metro ducts with higher fiber counts to meet the proliferation of edge computing. The Middle East and Africa witness national broadband agendas that prioritize landing points and pan-regional corridors, although project finance can lag behind political ambition. South America is led by Brazil and Argentina in spearheading fiber densification, despite macroeconomic volatility.

Competitive Landscape
The dark fiber market remains moderately fragmented as scale delivers economic advantages only when matched by extensive local right-of-way expertise. Zayo Group and Crown Castle expand through acquisitions and organic builds, yet regional specialists and municipal networks challenge incumbents on price and route uniqueness. Competitive dynamics in Tier-1 metros intensify as alternate providers overbuild traditional rights-of-way with higher core count cables, compelling incumbents to digitize maintenance and adopt performance guarantees.
Strategic themes emphasize vertical integration. Players are internalizing construction units, deploying software-defined network controllers to allocate wavelengths on demand, and embedding real-time fiber health sensors. Patent activity in optical sensing increased 34% year over year, underscoring the industry’s focus on reducing maintenance opex through predictive analytics.
Private equity remains active, attracted by predictable multi-year IRUs (indefeasible rights of use) and low churn. Yet, high capital intensity and longer payback windows motivate consolidation waves, where sub-regional providers merge to achieve economies of scale. Specialty segments such as security-hardened fiber for defense and low-latency financial routes maintain premium margins, allowing niche operators to thrive alongside scaled peers.
Dark Fiber Industry Leaders
Zayo Group Holdings Inc.
Crown Castle Fiber LLC
Colt Technology Services Group Limited
FirstLight Fiber Inc.
euNetworks Group Holdings Limited
- *Disclaimer: Major Players sorted in no particular order

Recent Industry Developments
- November 2025: Apar Industries Ltd., through its subsidiary Apar Transmission & Distribution Project Pvt. Ltd. (ATDPPL), has entered the dark fiber monetization sector. ATDPPL will operate, maintain, and monetize Karnataka Power Transmission Corporation Ltd.’s (KPTCL) Optical Ground Wire (OPGW) network statewide for 15 years.
- April 2025: Arelion and Gold Data have forged a strategic alliance, leveraging dark fiber to connect Arelion's Point-of-Presence (PoP) at KIO Networks' MEX 5 data center in Tultitlán, Mexico, directly to its PoP at KIO Networks' QRO1 data center in Querétaro, Mexico. This partnership highlights the companies' dedication to bolstering Latin America's economic expansion via enhanced high-capacity, low-latency connectivity.
- August 2024: euNetworks Group Holdings Limited (euNetworks), a bandwidth infrastructure firm based in Western Europe, has completed an equity recapitalization worth EUR 2.1 billion. Key players in this recapitalization include a vehicle managed by Stonepeak, with anchors Mercer and Aware Super, as well as direct investments from the Investment Management Corporation of Ontario (IMCO) and APG Asset Management (APG). These equity commitments come on the heels of the company's June debt refinancing, bolstering euNetworks' momentum as it scales and pursues its strategic goals. Specializing in both city and long-haul fiber networks, euNetworks connects pivotal data centers and hubs across Europe. The company boasts deep fiber networks in 18 cities and a unique long-haul network stretching 45,000 route kilometers across 17 countries.


Global Dark Fiber Market Report Scope
| Singlemode Fiber |
| Multimode Fiber |
| Long-Haul |
| Metro |
| Submarine |
| Telecom and Internet Service Providers |
| Data Centers and Cloud Providers |
| Government and Defense |
| Banking, Financial Services and Insurance |
| Healthcare |
| Education |
| Manufacturing |
| Energy and Utilities |
| Data Transmission and Telecommunication |
| Enterprise Networking |
| Industrial Automation |
| Military and Defense Communications |
| North America | United States | |
| Canada | ||
| Mexico | ||
| Europe | Germany | |
| United Kingdom | ||
| France | ||
| Russia | ||
| Rest of Europe | ||
| Asia-Pacific | China | |
| Japan | ||
| India | ||
| South Korea | ||
| Australia | ||
| Rest of Asia-Pacific | ||
| South America | Brazil | |
| Argentina | ||
| Rest of South America | ||
| Middle East and Africa | Middle East | Saudi Arabia |
| United Arab Emirates | ||
| Rest of Middle East | ||
| Africa | South Africa | |
| Egypt | ||
| Rest of Africa | ||
| By Fiber Type | Singlemode Fiber | ||
| Multimode Fiber | |||
| By Network Type | Long-Haul | ||
| Metro | |||
| Submarine | |||
| By End User Industry | Telecom and Internet Service Providers | ||
| Data Centers and Cloud Providers | |||
| Government and Defense | |||
| Banking, Financial Services and Insurance | |||
| Healthcare | |||
| Education | |||
| Manufacturing | |||
| Energy and Utilities | |||
| By Application | Data Transmission and Telecommunication | ||
| Enterprise Networking | |||
| Industrial Automation | |||
| Military and Defense Communications | |||
| By Geography | North America | United States | |
| Canada | |||
| Mexico | |||
| Europe | Germany | ||
| United Kingdom | |||
| France | |||
| Russia | |||
| Rest of Europe | |||
| Asia-Pacific | China | ||
| Japan | |||
| India | |||
| South Korea | |||
| Australia | |||
| Rest of Asia-Pacific | |||
| South America | Brazil | ||
| Argentina | |||
| Rest of South America | |||
| Middle East and Africa | Middle East | Saudi Arabia | |
| United Arab Emirates | |||
| Rest of Middle East | |||
| Africa | South Africa | ||
| Egypt | |||
| Rest of Africa | |||


Key Questions Answered in the Report
What is the value of the dark fiber market in 2026?
The dark fiber market size stands at USD 9.21 billion in 2026.
How fast is the dark fiber market expected to grow?
It is forecast to post a 13.12% CAGR and reach USD 17.06 billion by 2031.
Which region is expanding the quickest for dark fiber deployments?
Asia-Pacific is the fastest-growing region with a 13.97% CAGR through 2031.
Why are hyperscale data centers buying dark fiber rather than leasing?
Owning strands delivers lower long-term costs, tighter performance control, and improved security once utilization exceeds roughly 40% of capacity.
What are the main hurdles to new dark fiber builds?
High upfront construction costs and lengthy right-of-way permitting cycles are the two most significant restraints.
Which network segment is growing fastest within dark fiber?
Submarine cable systems show the strongest momentum, registering a 13.73% CAGR as transoceanic data traffic surges.
Page last updated on:


