Vitamin B3 Market Size and Share
Market Overview
| Study Period | 2020 - 2030 |
|---|---|
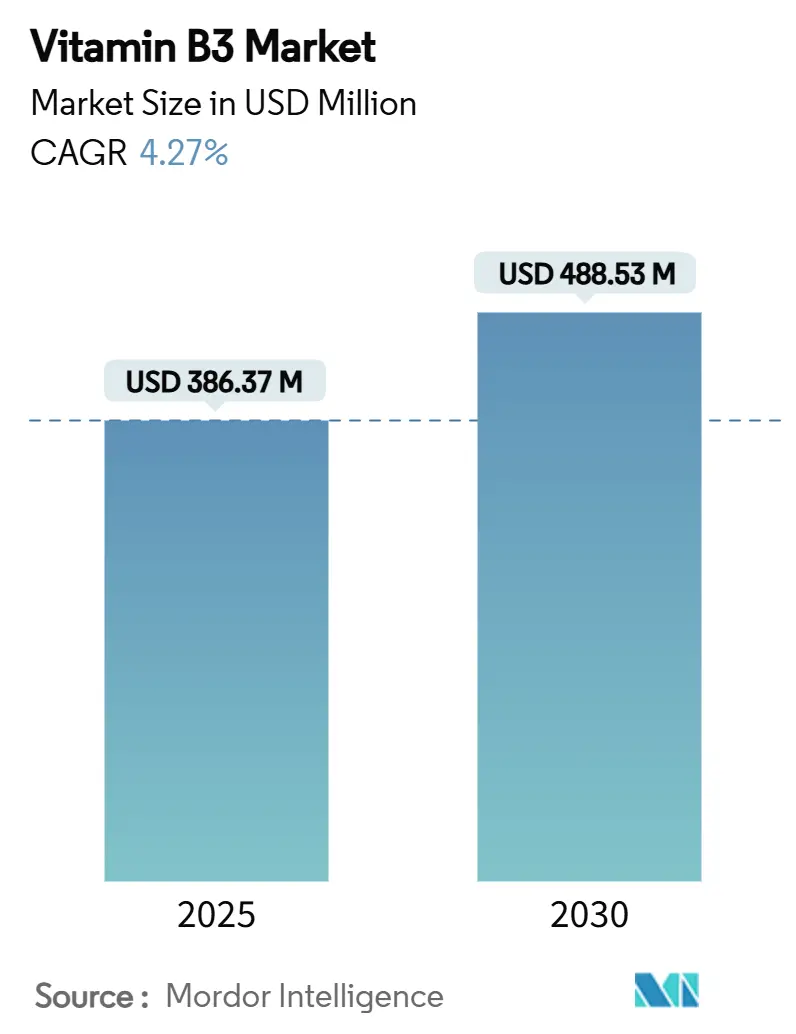
| Market Size (2025) | USD 386.37 Million |
| Market Size (2030) | USD 488.53 Million |
| Growth Rate (2025 - 2030) | 4.27% CAGR |
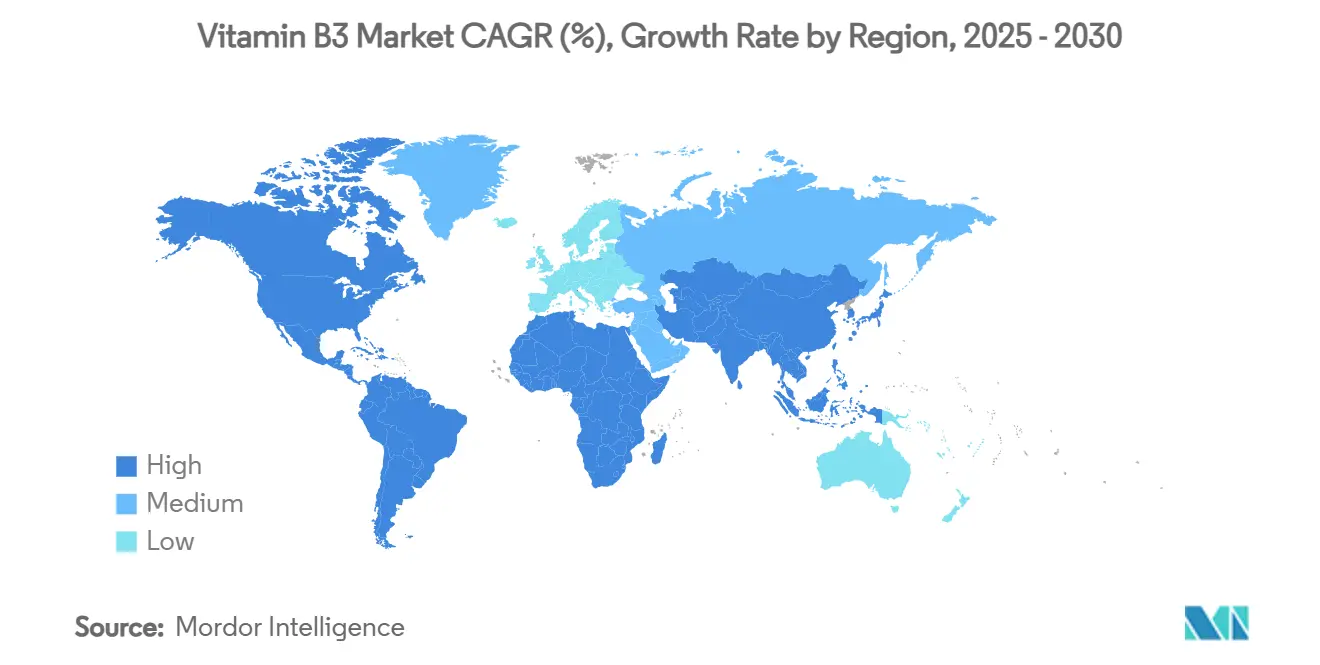
| Fastest Growing Market | Asia Pacific |
| Largest Market | Asia Pacific |
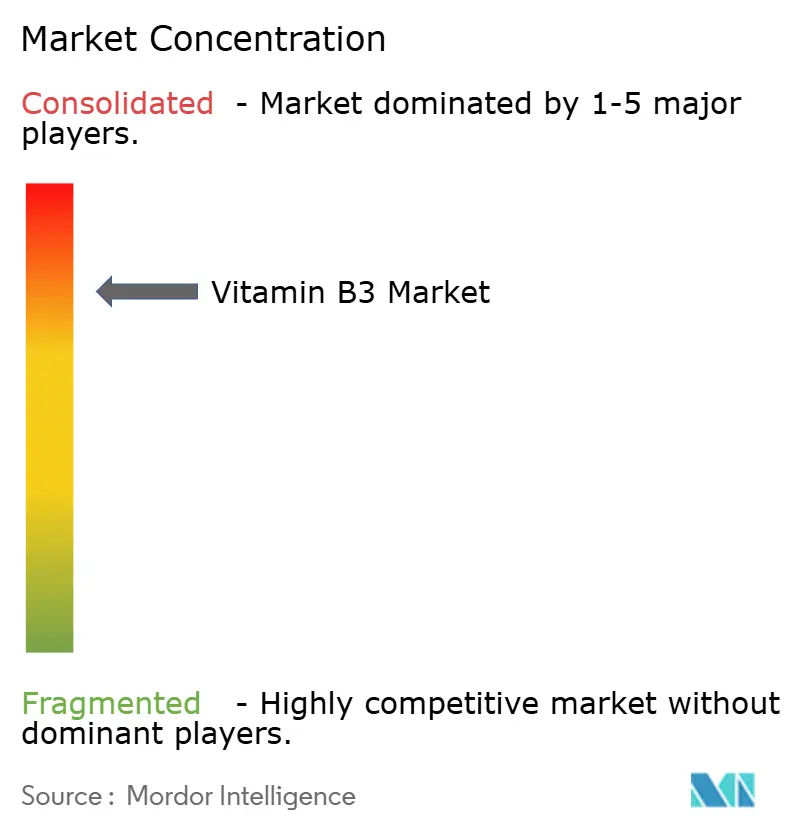
| Market Concentration | High |
Major Players
*Disclaimer: Major Players sorted in no particular order Image © Mordor Intelligence. Reuse requires attribution under CC BY 4.0. |
|
Vitamin B3 Market Analysis by Mordor Intelligence
The Vitamin B3 market size is USD 386.37 million in 2025 and is projected to reach USD 488.53 million by 2030 at a steady 4.27% CAGR. Growing fortification mandates, premium demand for cosmetics-grade niacinamide, and technological shifts toward bio-based synthesis are reshaping value pools within the Vitamin B3 market. Intensifying sustainability requirements are steering producers toward lower-carbon processes, while consumer interest in skin health and healthy aging is broadening application breadth. Oligopolistic supply structures continue to wield pricing power, yet dependence on a concentrated Chinese raw-material base exposes the Vitamin B3 market to regulatory shock. Companies that secure backward integration, geographic redundancy, and specialty-grade capabilities are positioned to capture margin upside.
Key Report Takeaways
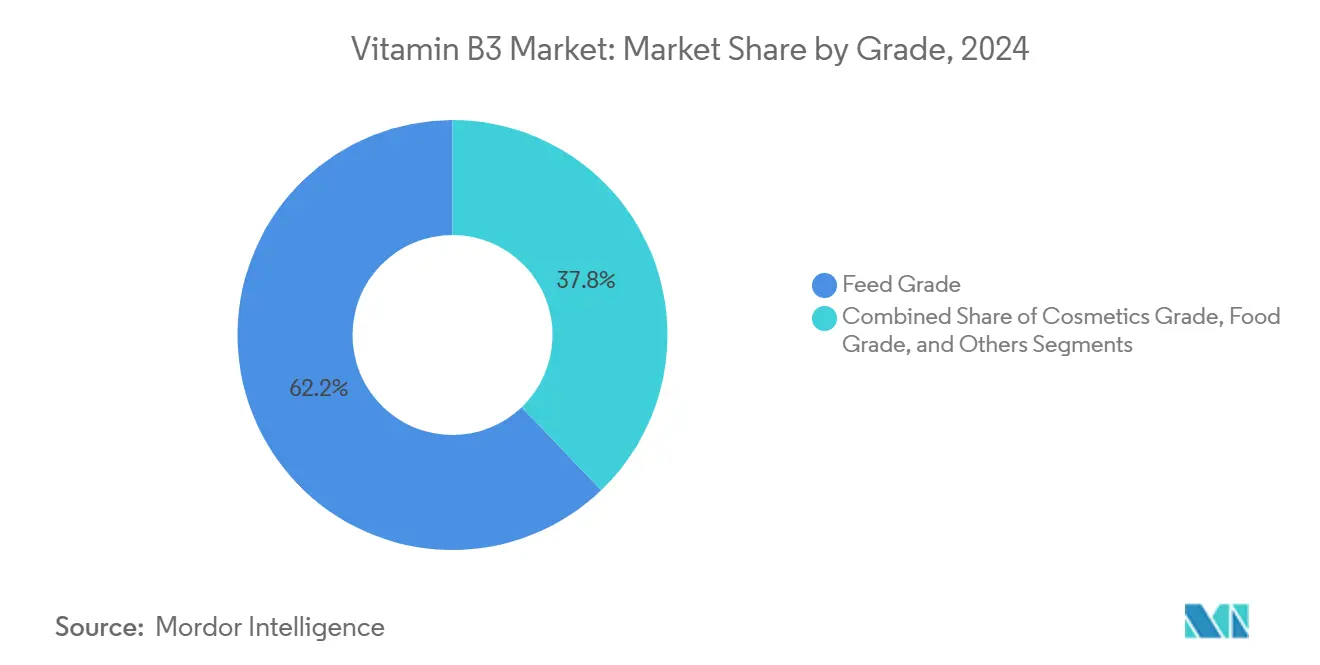
- By grade, Feed Grade captured 62.16% of the Vitamin B3 market share in 2024, followed by Cosmetics Grade, advancing at a 6.78% CAGR to 2030.
- By form, Dry Form accounted for 74.31% of the Vitamin B3 market size in 2024, and Wet/Liquid Form is expanding at an 8.09% CAGR through 2030.
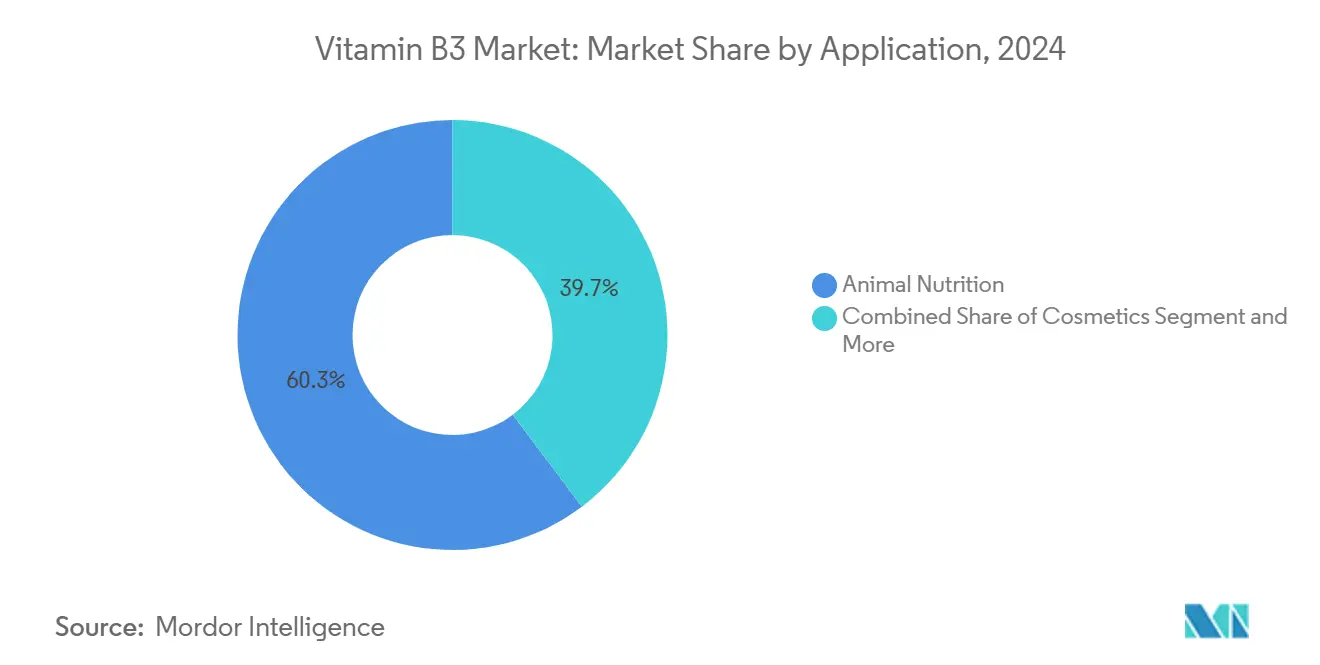
- By application, Animal Nutrition held 60.28% of the Vitamin B3 market size in 2024, and Cosmetics applications are progressing at an 8.51% CAGR to 2030.
- By geography, Asia-Pacific commanded a 40.41% share of the Vitamin B3 market in 2024 and is scaling at a 9.17% CAGR through 2030.
Global Vitamin B3 Market Trends and Insights
Drivers Impact Analysis*
| Driver | (~) % Impact on CAGR Forecast | Geographic Relevance | Impact Timeline |
|---|---|---|---|
| Surging demand for fortified F&B | +1.2% | Global, with stronger impact in North America & Europe | Medium term (2-4 years) |
| Feed-industry vitamin premix boom | +0.8% | APAC core, spill-over to South America | Short term (≤ 2 years) |
| Cosmetics shift to niacinamide actives | +1.5% | Global, led by North America & Europe | Long term (≥ 4 years) |
| Bio-based, lower-carbon synthesis routes | +0.6% | Europe & North America primarily | Long term (≥ 4 years) |
| Companion-animal cardiometabolic health demand | +0.4% | North America & Europe | Medium term (2-4 years) |
| US/EU re-shoring of vitamin supply | +0.3% | North America & Europe | Long term (≥ 4 years) |
| Source: Mordor Intelligence | |||
Surging Demand for Fortified F&B
Governments worldwide are ramping up Vitamin B3 consumption through food fortification mandates, aiming to tackle widespread micronutrient deficiencies. According to the FDA's 21 CFR 104.20 guidelines, processed grain foods should be fortified with niacin at levels of 15-34 mg per pound, ensuring each serving provides 8-15% of the adult daily value[1]U.S. Food and Drug Administration. "21 CFR 104.20 -- Statement of purpose." June 13, 2024. https://www.ecfr.gov/current/title-21/chapter-I/subchapter-B/part-104/subpart-B/section-104.20.. The WHO has underscored niacin's importance in its updated guidelines on wheat flour fortification, especially for developing nations grappling with deficiencies. As food manufacturers navigate and comply with these fortification mandates across various jurisdictions, a consistent demand surge is evident. The OECD's 2024 framework for the regulatory governance of large-scale food fortification outlines six essential pillars for government implementation, hinting at a wider embrace of mandatory fortification initiatives. Furthermore, emerging markets, where micronutrient deficiencies are still a pressing concern, are witnessing a policy shift. This is largely driven by the enticing economic returns on fortification investments, which are projected to be significantly higher than the initial outlay.
Feed-Industry Vitamin Premix Boom
As livestock producers refine feed formulations for better productivity and to meet regulatory standards, the animal nutrition sector is witnessing significant growth. The University of Missouri has set a niacin requirement of 30 grams per ton for both growers and finishers in swine production, highlighting a trend of standardized supplementation practices in the industry. Demonstrating the vast scale of industrial vitamin consumption in animal nutrition, European premix giant Vilofoss churns out over 375,000 tons of vitamin and mineral premixes each year from its 15 manufacturing plants. The European Food Safety Authority's (EFSA) recent green light on niacin for all animal species further emphasizes the regulatory trust in its safety and effectiveness. With rising protein demand in developing markets and intensified livestock production systems, the appetite for vitamin premixes remains strong. Moreover, as the industry pivots towards precision nutrition—motivated by sustainability and cost-efficiency—there's a marked sophistication in vitamin supplementation programs.
Cosmetics Shift to Niacinamide Actives
Niacinamide, once a niche player, is now at the forefront of the cosmetics industry's premium market expansion. Clinical studies underscore niacinamide's prowess in addressing acne, melasma, and psoriasis, while also offering anti-aging benefits through improved DNA repair and diminished oxidative stress[2]Camillo, Lara, Elisa Zavattaro, and Paola Savoia. "Nicotinamide: A Multifaceted Molecule in Skin Health and Beyond" Medicina 61, no. 2: 254. 2025. https://doi.org/10.3390/medicina61020254.. Its antimicrobial strength, effective at concentrations between 15,000-40,000 ppm against a range of microorganisms, underscores its versatility in personal care. With Japan and the EU granting regulatory nods for cosmetic uses, niacinamide's safety is now widely recognized, spurring its adoption across diverse skincare products. As consumers gravitate towards clean beauty and scientifically validated actives, niacinamide commands a premium price, outpacing traditional feed-grade applications. Moreover, innovations in dermal fillers and injectables hint at even broader market prospects.
Bio-Based, Lower-Carbon Synthesis Routes
Driven by the imperatives of environmental sustainability, industries are rapidly adopting bio-based production methods. These methods not only aim to curtail carbon footprints but also seek to eliminate toxic intermediates. For instance, Lonza has pioneered a catalytic green process that harnesses air oxidation of picoline, coupled with ammonia recycling. This method boasts an impressive 96% conversion rate and a 91% yield, all while generating minimal waste. In another stride towards sustainability, photocatalytic synthesis employs metal-free carbon nitride-based catalysts. These catalysts present a greener alternative to conventional, energy-heavy chemical production methods, thanks to their enhanced efficiency derived from unique surface properties and superior photoabsorption. Furthermore, engineered E. coli strains are being utilized as microbial cell factories. These strains are achieving elevated concentrations in bioreactors, presenting a cost-effective solution compared to traditional chemical synthesis, all while adhering to sustainability mandates. This shift towards bio-based production not only sidesteps the regulatory scrutiny often faced by conventional chemical processes but also holds the promise of slashing manufacturing costs through heightened efficiency and reduced waste. As these technological strides gain momentum, early adopters stand poised to seize a larger slice of the market, underscoring the notion that sustainability is swiftly becoming a key competitive edge.
Restraints Impact Analysis*
| Restraint | (~) % Impact on CAGR Forecast | Geographic Relevance | Impact Timeline |
|---|---|---|---|
| Raw-material & price volatility | -0.9% | Global, with acute impact in APAC | Short term (≤ 2 years) |
| China environmental crack-downs on pyridine | -1.1% | Global supply chains, originating from China | Medium term (2-4 years) |
| Whole-food nutrition preference | -0.3% | North America & Europe primarily | Long term (≥ 4 years) |
| Legacy cartel scrutiny and compliance costs | -0.4% | Global, with focus on Europe & North America | Medium term (2-4 years) |
| Source: Mordor Intelligence | |||
Raw-Material & Price Volatility
Vitamin manufacturers in competitive markets face significant margin pressures due to supply chain disruptions and commodity price fluctuations. In Q1 2024, DSM-Firmenich highlighted the sector's vulnerability to pricing volatility, reporting negative impacts on vitamin prices. The company noted that, absent these pricing effects, organic sales would have seen an uptick. Meanwhile, BASF's declaration of Force Majeure for select vitamin products, a direct consequence of a plant fire, underscores the ripple effect operational disruptions can have on global supply chains[3]BASF. "BASF declares Force Majeure for selected vitamin A, vitamin E, and carotenoid products as well as selected aroma ingredients." October 31, 2024. https://www.basf.com/global/en/media/news-releases/2024/08/p-24-263.. The precedent set by the vitamins cartel serves as a cautionary tale: market concentration can pave the way for price manipulation. In this scenario, duopolies managed to uphold elevated prices long after collusion, whereas markets with three or four players reverted to competitive pricing at a swifter pace. Furthermore, the industry's reliance on specialized chemical intermediates introduces bottlenecks, intensifying price volatility across the value chain. Coupled with high fixed costs and extended production cycles, manufacturers find it challenging to swiftly adapt to demand shifts, further deepening price instability during market upheavals.
China Environmental Crack-Downs on Pyridine
China's tightening environmental regulations are hampering pyridine production, a vital precursor for Vitamin B3. The State Administration for Market Regulation in China has intensified its scrutiny of chemical manufacturing, introducing stricter labeling mandates as part of a broader regulatory clampdown. In a move emblematic of the industry's shift to meet environmental standards, DSM-Firmenich has shuttered its Vitamin B6 and C plants in China, aligning with its overarching vitamin transformation strategy. Now, pharmaceutical projects in China must navigate rigorous pollution control measures during environmental assessments, leading to heightened compliance costs and operational challenges. Given China's dominance in pyridine production, any disruptions pose a systemic risk to the global Vitamin B3 supply chain, especially since alternative production avenues demand hefty capital and regulatory green lights. In response to these environmental hurdles, there's a noticeable pivot towards alternative synthesis methods and a push for diversifying production locations.
*Our forecasts treat driver/restraint impacts as directional, not additive. The impact forecasts reflect baseline growth, mix effects, and variable interactions.
Segment Analysis
By Grade: Feed Applications Anchor Volume, Cosmetics Capture Value
In 2024, Feed Grade commands a dominant 62.16% share of the Vitamin B3 market, underscoring its pivotal role in global trade volumes. Regulatory dosing guidelines for livestock and the advantages of integrated premix operations ensure a steady flow, even amidst tight margins. With large contract volumes, plants maintain consistent utilization, allowing for cost absorption across diverse grade portfolios. However, as Feed Grade continues to be the dominant segment, it grapples with heightened competition from regional premix blenders and Asian SMEs, known for their low-cost, dry-blend operations. Consequently, major players are reallocating incremental capital expenditures towards cosmetics and pharmaceuticals, sectors where product differentiation is pronounced and regulatory challenges act as a barrier to entry for newcomers.
While Cosmetics Grade occupies a smaller tonnage segment, it boasts a robust 6.78% CAGR, contributing disproportionately to revenues due to average selling prices (ASPs) that far exceed those of feed counterparts. The surge in dermo-cosmetic product launches and over-the-counter skin serums, often featuring 5%-10% niacinamide concentrations, is driving this specialty demand. As Cosmetics Grade reshapes the earnings landscape of the Vitamin B3 market, brands are prioritizing traceability and purity. This heightened focus elevates standards for USP/BP-compliant production, steering preference towards suppliers adept in advanced crystallization and micronization techniques.


By Form: Dry Dominance Faces Liquid Innovation
Dry formulations, crystalline, powder, and granulated forms, hold 74.31% of the Vitamin B3 market size in 2024 because they integrate seamlessly into bulk premixes and fortified flour lines. Their low moisture and superior stability accommodate tropical warehousing and long transit times, making them the preferred choice for global commodity trading. Unit operations such as fluid-bed drying enable high throughput, keeping operating costs favorable for volume-driven applications. However, liquid niacinamide formulations are pacing 8.09% CAGR, capitalizing on precision-dose advantages and the elimination of dust hazards in cosmetics and pharma cleanrooms. The surge in water-based serums and leave-on skincare lines escalates liquid demand, reinforcing this shift.
Recent advances in nano-emulsion and encapsulation technologies reduce oxidation risk while improving skin penetration, further boosting liquid uptake. Feed-industry integrators experiment with liquid inclusion systems that improve homogeneity in micro-dosed rations, potentially bridging the gap between commodity and specialty domains. Yet, high transport costs for aqueous solutions and cold-chain requirements restrain broader substitution. Producers focus on modular plant designs that can toggle between dry spray granulation and wet crystallization, optimizing asset flexibility. The coexistence of both forms ensures the Vitamin B3 market maintains supply optionality while accommodating divergent performance specifications.
By Application: Animal Nutrition Leads, Cosmetics Accelerates
Animal Nutrition anchors 60.28% of the Vitamin B3 market size in 2024, reflecting its entrenched role in feed conversion optimization and disease mitigation in intensive livestock systems. Swine, poultry, and aqua feed formulators lock in contractual offtake volumes that underpin predictable baseline demand. Regulatory re-authorizations from EFSA and FDA reaffirm safety, sustaining inclusion across all commercial diets. Nonetheless, cosmetics applications outpace the aggregate market at 8.51% CAGR as beauty consumers prioritize clinically validated, multi-functional actives. Ingredient houses formulate high-purity niacinamide, sometimes co-encapsulated with ceramides, squeezing additional premium from the same molecule.
Human Nutrition/Dietary Supplements remain steady, buoyed by longevity research highlighting NAD+ precursors for metabolic resilience. Fortified bakery and cereal products ensure incremental but mandated niacin consumption; however, limited consumer visibility means pricing remains less elastic. Pharmaceutical and agrochemical uses persist as niche outlets, with the former leveraging nicotinamide’s anti-inflammatory properties and the latter employing it as an intermediate in crop protection agents. The diversified application spread insulates the Vitamin B3 market from singular demand shocks, though strategic emphasis is clearly shifting toward cosmetic and supplement adjacencies that promise margin expansion.
Geography Analysis
Asia-Pacific commands 40.41% of the Vitamin B3 market and is accelerating at a 9.17% CAGR through 2030 as it balances world-scale manufacturing with rising domestic demand. China’s cost advantage remains compelling, but stringent VOC and wastewater standards trigger capacity rationalization, creating a supply-demand tightrope. India’s feed-grain and poultry sectors lift volumetric consumption, while Japan’s cosmeceutical ecosystem absorbs high-purity niacinamide for premium skincare lines. Emerging ASEAN economies institute wheat-flour fortification programs, injecting incremental volume into the regional Vitamin B3 market.
North America exhibits mature but resilient demand backed by robust regulatory frameworks such as GRAS status and explicit fortification directives. Re-shoring initiatives spur feasibility analyses for domestic pyridine and niacin plants, yet capital intensity keeps most projects at the concept stage. The United States and Canada drive specialty-grade growth in dermo-cosmetic and pet-nutrition channels, cushioning flat feed tonnage. Mexico benefits from rising pork production and fortified-flour mandates, modestly expanding regional volume.
Europe foregrounds sustainability, propelling interest in bio-catalytic processes and plant-based feedstocks. Germany’s BfR recently capped daily supplemental nicotinamide at 160 mg, signaling continued consumer-safety vigilance. Cosmetic-grade demand thrives in France and Italy’s dermo-pharmacy segment, while companion-animal premiumization opens new distribution avenues. Eastern Europe’s intensified poultry complexes adopt precision-feed systems, boosting feed-grade consumption. South America and the Middle East & Africa trail in absolute volume but unlock upside through urbanization and government-led fortification campaigns, giving the Vitamin B3 market an expanding geographic footprint.

Competitive Landscape
Global supply, scoring 8/10 on the concentration scale, sees DSM-Firmenich, Lonza, and Jubilant Ingrevia wielding significant influence through their capacity, technology, and customer ties. Amid ongoing pricing pressures, DSM-Firmenich is rationalizing its vitamin portfolio—closing select assets in China and fine-tuning its premix networks—to bolster returns. Lonza, through its “One Lonza” initiative, is shifting away from lower-margin capsule operations, redirecting capital towards CDMO and high-value biosynthesis, underscoring a trend of portfolio refinement.
Meanwhile, Jubilant Ingrevia is capitalizing on its cost-effective operations in India to delve into cosmetics-grade markets, recently debuting ultra-low-residual solvents niacinamide, tailored for K-beauty brands. By vertically integrating, companies secure vital pyridine intermediates, and with plants spread across two continents, they effectively counter regional disruptions. Instead of radical molecule redesigns, the focus on technology differentiation leans towards yield optimization, effluent reduction, and impurity control, highlighting a shift from commodity to specialty.
Collaborating with biotech start-ups, firms are fast-tracking their entry into microbial niacin pathways, providing a buffer against potential environmental restrictions on petrochemical methods. While the stringent regulations in the Vitamin B3 market pose challenges for new entrants, established players grapple with shrinking margins unless they transition towards specialty grades and adopt ESG-compliant manufacturing practices.
Vitamin B3 Industry Leaders
-
DSM-Firmenich
-
Lonza Group AG
-
Jubilant Ingrevia Ltd.
-
Brother Enterprises Holding
-
Lasons India Pvt Ltd.
- *Disclaimer: Major Players sorted in no particular order

Recent Industry Developments
- January 2025: Jubilant Ingrevia has announced the commissioning of its new cGMP compliant facility at Bharuch, Gujarat. The new facility, which has a capacity of 5,000 metric tonnes, will manufacture nutraceuticals and dietary-active ingredients for human consumption.
- October 2024: BASF declared Force Majeure for selected vitamin A, vitamin E, and carotenoid products following a fire at its Ludwigshafen plant, leading to supply disruptions that may affect the broader vitamin market dynamics.


Global Vitamin B3 Market Report Scope
| Feed Grade |
| Food Grade |
| Cosmetics Grade |
| Others (Pharmaceutical Grade) |
| Dry |
| Wet |
| Animal Nutrition |
| Human Nutrition/Dietary Supplements |
| Food and Beverage Fortification |
| Cosmetics |
| Others (Pharmaceutical Industry, AgroChemicals) |
| North America | United States |
| Canada | |
| Mexico | |
| Rest of North America | |
| Europe | Germany |
| United Kingdom | |
| Italy | |
| France | |
| Spain | |
| Netherlands | |
| Russia | |
| Belgium | |
| Sweden | |
| Rest of Europe | |
| Asia-Pacific | China |
| India | |
| Japan | |
| Australia | |
| Indonesia | |
| South Korea | |
| Thailand | |
| Singapore | |
| Rest of Asia-Pacific | |
| South America | Brazil |
| Argentina | |
| Chile | |
| Peru | |
| Rest of South America | |
| Middle East and Africa | South Africa |
| Saudi Arabia | |
| United Arab Emirates | |
| Nigeria | |
| Egypt | |
| Iran | |
| Turkey | |
| Rest of Middle East and Africa |
| By Grade | Feed Grade | |
| Food Grade | ||
| Cosmetics Grade | ||
| Others (Pharmaceutical Grade) | ||
| Form | Dry | |
| Wet | ||
| Application | Animal Nutrition | |
| Human Nutrition/Dietary Supplements | ||
| Food and Beverage Fortification | ||
| Cosmetics | ||
| Others (Pharmaceutical Industry, AgroChemicals) | ||
| Geography | North America | United States |
| Canada | ||
| Mexico | ||
| Rest of North America | ||
| Europe | Germany | |
| United Kingdom | ||
| Italy | ||
| France | ||
| Spain | ||
| Netherlands | ||
| Russia | ||
| Belgium | ||
| Sweden | ||
| Rest of Europe | ||
| Asia-Pacific | China | |
| India | ||
| Japan | ||
| Australia | ||
| Indonesia | ||
| South Korea | ||
| Thailand | ||
| Singapore | ||
| Rest of Asia-Pacific | ||
| South America | Brazil | |
| Argentina | ||
| Chile | ||
| Peru | ||
| Rest of South America | ||
| Middle East and Africa | South Africa | |
| Saudi Arabia | ||
| United Arab Emirates | ||
| Nigeria | ||
| Egypt | ||
| Iran | ||
| Turkey | ||
| Rest of Middle East and Africa | ||


Key Questions Answered in the Report
What is the current size and growth outlook for the Vitamin B3 market?
The Vitamin B3 market stands at USD 386.37 million in 2025 and is forecast to reach USD 488.53 million by 2030, posting a 4.27% CAGR.
Which segment is expanding fastest within the Vitamin B3 landscape?
Cosmetics-grade niacinamide is the fastest-growing segment, advancing at a 6.78% CAGR through 2030 as skincare brands embrace science-backed actives.
How concentrated is global Vitamin B3 supply?
The market scores 8/10 for concentration, with DSM-Firmenich, Lonza, and Jubilant Ingrevia controlling well over 80% of installed capacity.
Why is Asia-Pacific pivotal to Vitamin B3 trade flows?
Asia-Pacific represents 40.41% of global demand and houses the bulk of pyridine-based manufacturing, making it both the key production hub and fastest-growing consumption region.
What are the main supply-side risks facing Vitamin B3 buyers?
Environmental crack-downs on Chinese pyridine plants and feedstock price volatility can disrupt supply and elevate costs in the short to medium term.
What strategic moves can buyers take to mitigate supply risk?
Diversifying sourcing, locking in long-term contracts with vertically integrated producers, and evaluating bio-based suppliers can reduce exposure to raw-material shocks.
Page last updated on:


