Natural Vitamin E Market Size and Share
Market Overview
| Study Period | 2021 - 2031 |
|---|---|
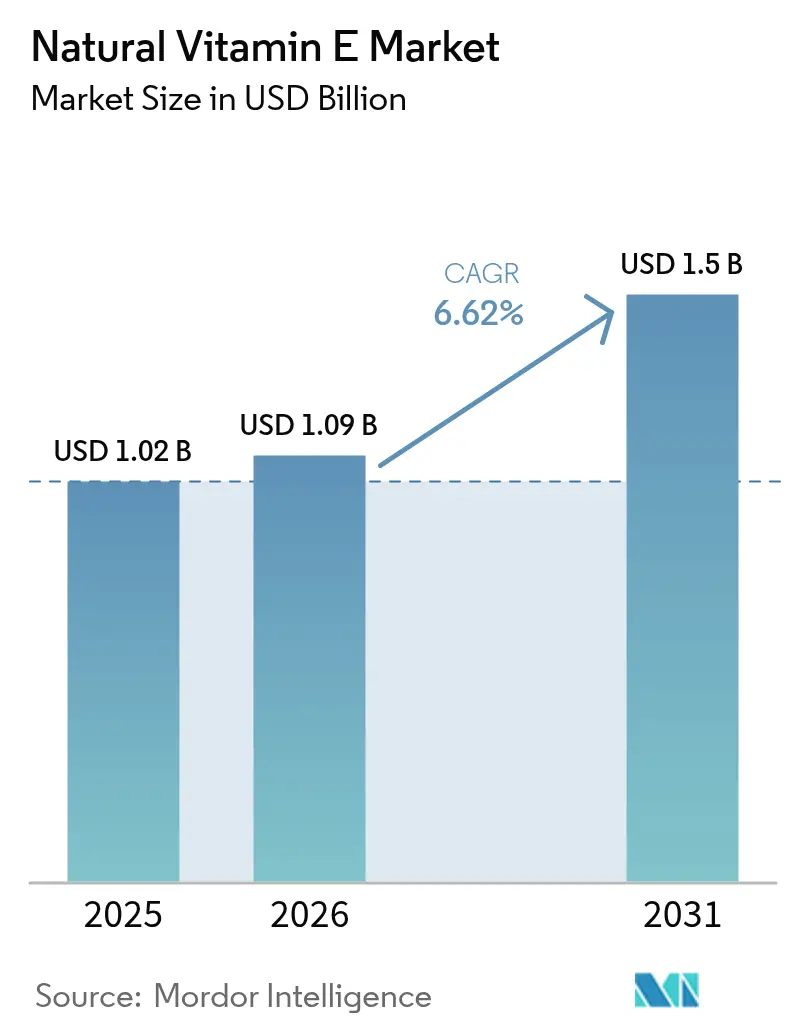
| Market Size (2026) | USD 1.09 Billion |
| Market Size (2031) | USD 1.5 Billion |
| Growth Rate (2026 - 2031) | 6.62% CAGR |
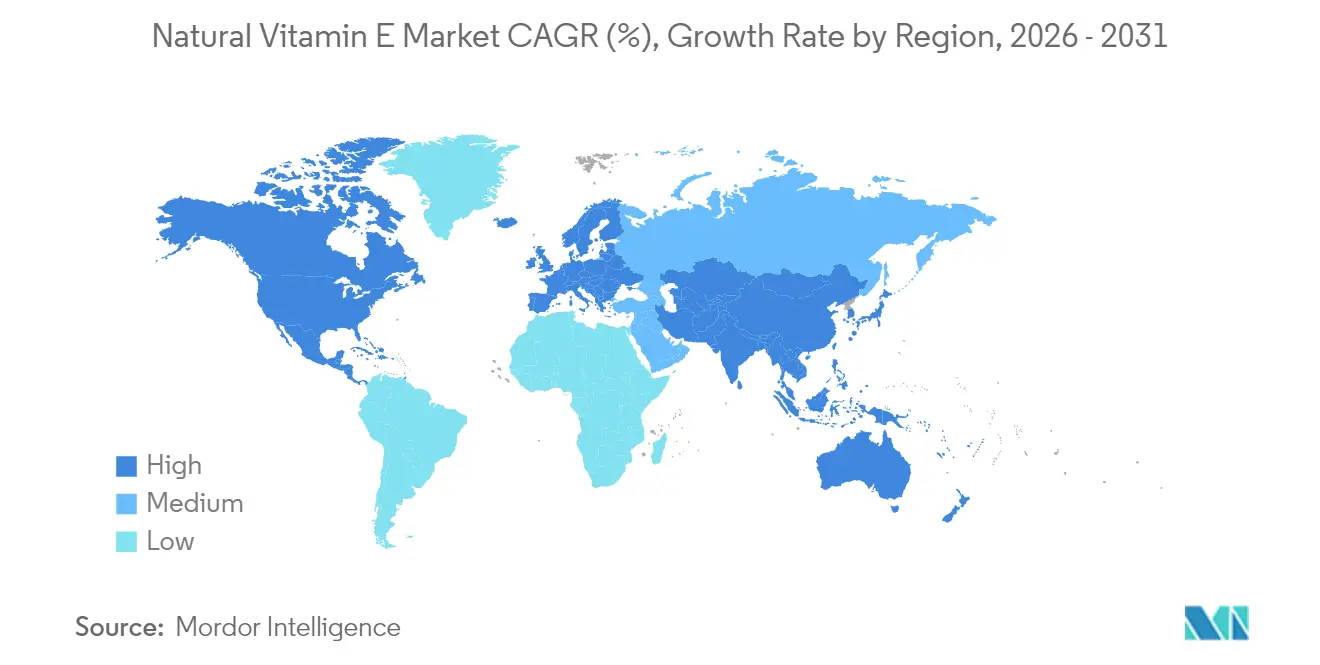
| Fastest Growing Market | Asia Pacific |
| Largest Market | Asia Pacific |
| Market Concentration | Medium |
Major Players
*Disclaimer: Major Players sorted in no particular order Image © Mordor Intelligence. Reuse requires attribution under CC BY 4.0. |
|
Natural Vitamin E Market Analysis by Mordor Intelligence
The natural vitamin E market size is expected to grow from USD 1.02 billion in 2025 to USD 1.09 billion in 2026 and is forecast to reach USD 1.5 billion by 2031 at 6.62% CAGR over 2026-2031. This trajectory underlines robust demand resilience during recent supply-chain shocks, notably the BASF Ludwigshafen outage, and mirrors escalating clean-label preferences across the food, supplement, and beauty categories. Increased regulatory validation, such as the European Food Safety Authority's antioxidant health claim and the U.S. FDA's GRAS confirmations, continues to support product adoption[1]Source: EFSA, "Scientific opinion on the tolerable upper intake level for vitamin E," efsa.europa.eu. The natural vitamin E market benefits further from the convergence of lifestyle disease prevalence with a broader functional food agenda, while regional players accelerate investments in diversified feedstocks to offset raw material price volatility. Competitive positioning is shaped by technology differentiation in extraction yields and stabilization systems, as well as supply-chain redundancy following the 2024 force-majeure episode.
Key Report Takeaways
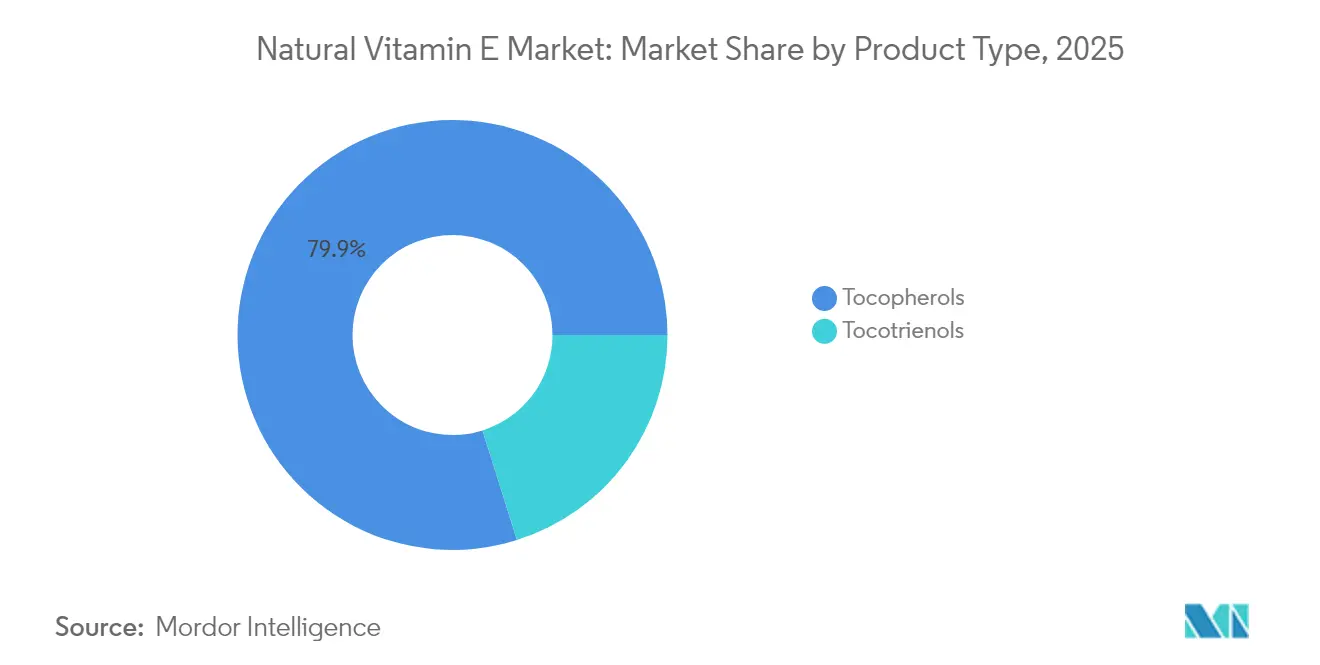
- By product type, tocopherols led with an 79.85% natural vitamin E market share in 2025, whereas tocotrienols are projected to have the fastest growth rate of 8.64% through 2031.
- By source, soybean oil commanded 46.25% share of the natural vitamin E market size in 2025, while sunflower oil is forecast to expand at a 7.4% CAGR to 2031, buoyed by its non-GMO positioning.
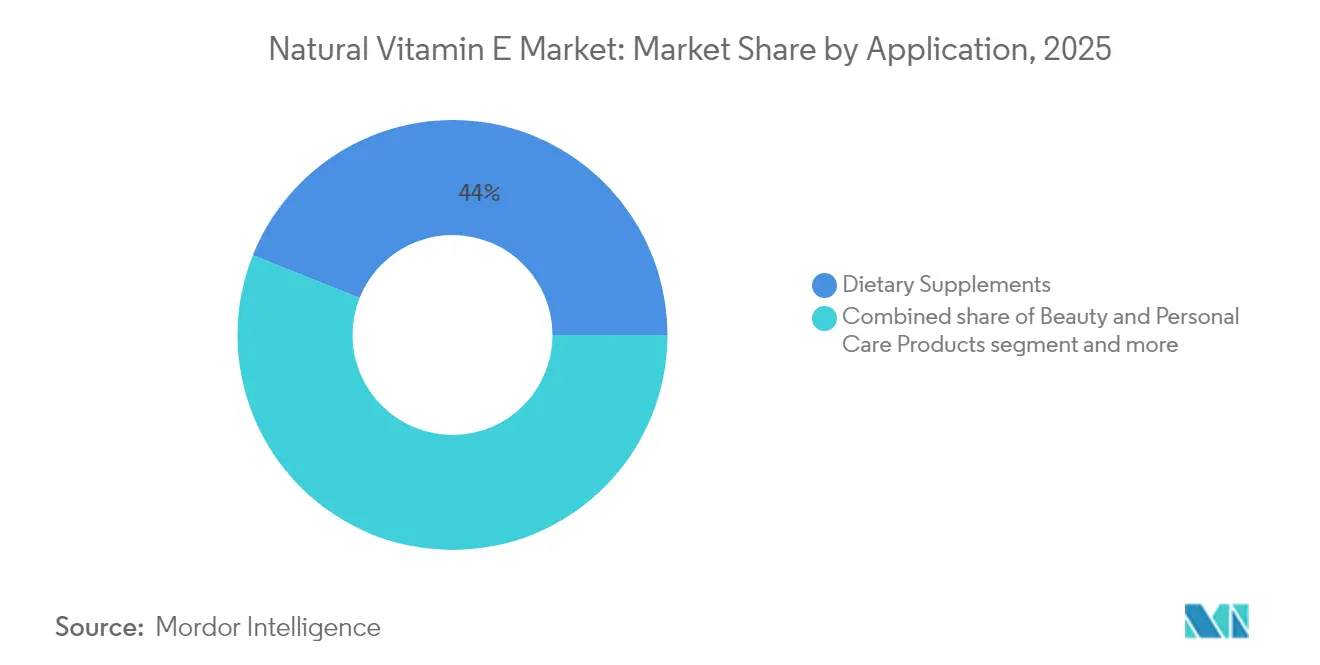
- By application, dietary supplements accounted for 43.95% of the natural vitamin E market size in 2025; meanwhile, beauty and personal-care products are projected to advance at a vigorous 9.28% CAGR over 2026-2031.
- By geography, the Asia-Pacific region captured a 34.75% revenue share in 2025 and is projected to pace ahead with a 7.12% CAGR to 2031.
Note: Market size and forecast figures in this report are generated using Mordor Intelligence’s proprietary estimation framework, updated with the latest available data and insights as of 2026.
Global Natural Vitamin E Market Trends and Insights
Drivers Impact Analysis*
| Driver | (~) % Impact on CAGR Forecast | Geographic Relevance | Impact Timeline |
|---|---|---|---|
| Rising demand for natural antioxidants in functional foods | +1.8% | Global, with Asia-Pacific core leadership | Medium term (2-4 years) |
| Clean-label demand for natural ingredients in dietary supplements | +1.5% | North America and Europe, spill-over to Asia-Pacific | Short term (≤ 2 years) |
| Growing adoption vitamin E in cosmetics and personal care growth | +1.2% | Global, with Europe regulatory leadership | Medium term (2-4 years) |
| Growing incidence of lifestyle diseases | +1.0% | Global, with developed markets priority | Long term (≥ 4 years) |
| Regulatory green-light for higher natural-E inclusion in animal feed | +0.8% | Europe, North America, with Asia-Pacific adoption | Medium term (2-4 years) |
| Shift to non‑GMO and allergen‑sensitive sources | +0.6% | North America core, Europe secondary | Short term (≤ 2 years) |
| Source: Mordor Intelligence | |||
Rising demand for natural antioxidants in functional foods
Functional food formulation increasingly prioritizes natural antioxidants over synthetic alternatives, driving sustained demand for natural vitamin E across multiple food categories. The FDA's Generally Recognized as Safe (GRAS) status for α-tocopherol acetate derived from edible fruits and vegetables, confirmed in December 2018, validates natural vitamin E's use as a substitute for synthetic forms without increasing dietary intake. This regulatory endorsement aligns with manufacturers' shift toward natural preservation systems in processed foods, where vitamin E serves dual functions: nutrient fortification and oxidative stability enhancement. Consumer preferences reinforce this demand trend. According to a Glanbia Nutritionals report, 72% of consumers preferred functional beverages with added health benefits, while 44% actively sought products containing natural ingredients in 2023/24[2]Source: Glanbia Nutritionals, "Functional Beverages to Support Wellbeing," glanbianutritionals.com. These statistics demonstrate the correlation between clean-label expectations and the increased use of natural vitamin E in functional beverages, fortified snacks, and nutraceuticals.
Clean-label demand for natural ingredients in dietary supplements
The food industry's increasing preference for natural antioxidants over synthetic alternatives drives consistent demand for natural vitamin E across food categories. The FDA's Generally Recognized as Safe (GRAS) status for α-tocopherol acetate from edible fruits and vegetables, confirmed in December 2018, validates natural vitamin E as a substitute for synthetic forms without increasing dietary intake. This regulatory approval aligns with manufacturers' adoption of natural preservation systems in processed foods, where vitamin E serves dual purposes, including nutrient fortification and enhancing oxidative stability. Consumer preferences further support this shift; for instance, the International Food Information Council's 2024 Report indicates that 36% of U.S. consumers associate natural or clean labeling with enhanced product safety, demonstrating the influence of clean-label positioning on consumer trust and purchase decisions [3]Source: International Food Information Council, "2024 IFIC Food & Health SURVEY," ific.org. FDA guidance confirms that natural vitamin E provides approximately twice the biological activity of synthetic forms due to its higher RRR-α-tocopherol content. These factors, along with increased demand for identity-preserved sourcing and transparent supply chains, establish natural vitamin E as both a nutritional component and a clean-label element in functional foods, supplements, and fortified beverages.
Growing adoption vitamin E in cosmetics and personal care growth
The cosmetics industry increasingly uses natural vitamin E due to its functional benefits and consumer appeal. The FDA's Modernization of Cosmetics Regulation Act, implemented through Cosmetics Direct, requires registration of cosmetic products containing vitamin E, enhancing transparency in the supply chain. European regulations focus on sustainability and ethical sourcing, with the Corporate Sustainability Due Diligence Directive mandating supply chain verification for natural vitamin E sources. Advancements in vitamin E stabilization techniques, such as cyclodextrin inclusion complexes, improve product shelf life while maintaining antioxidant properties. This regulatory framework benefits suppliers who can effectively manage both cosmetic ingredient and dietary supplement requirements for natural vitamin E products.
Growing incidence of lifestyle diseases
The increasing prevalence of chronic diseases has led to preventive nutrition strategies that incorporate natural vitamin E as a key ingredient across various therapeutic areas. The WHO/FAO Joint Expert Consultation has identified changes in dietary patterns and sedentary lifestyles as significant risk factors for chronic diseases, highlighting nutrition's central role in public health policy. This health context supports the inclusion of vitamin E in functional foods and supplements targeting cardiovascular health, cognitive function, and metabolic disorders. Japan's regulatory framework for functional foods, which includes Foods for Specified Health Uses (FOSHU) and Foods with Function Claims, establishes clear pathways for vitamin E health claims. Other markets are adopting similar approaches. The focus on clinical evidence benefits natural vitamin E suppliers who can provide data on bioavailability and efficacy to support health claims. Market trends show that stress relief, cardiovascular support, and anti-aging applications enable premium pricing for clinically validated natural vitamin E ingredients.
Restraints Impact Analysis*
| Restraint | (~) % Impact on CAGR Forecast | Geographic Relevance | Impact Timeline |
|---|---|---|---|
| Volatile prices of soybean, rapeseed and palm distillates | -1.5% | Global, with Asia-Pacific supply concentration | Short term (≤ 2 years) |
| Limited certified non-GMO raw-material supply chains | -1.2% | North America and Europe demand centers | Medium term (2-4 years) |
| Allergen and sustainability scrutiny on soy‑derived streams | -0.8% | Europe regulatory leadership, North America adoption | Medium term (2-4 years) |
| Competition from synthetic alternatives | -0.6% | Global, with price-sensitive segments | Long term (≥ 4 years) |
| Source: Mordor Intelligence | |||
Volatile prices of soybean, rapeseed and palm distillates
Raw material price volatility creates margin pressure and supply planning challenges that limit market growth, particularly as oilseed markets experience weather-related disruptions and geopolitical tensions. USDA Economic Research Service data indicate U.S. soybean ending stocks of 455.0 million bushels for marketing year 2024/25, while global rapeseed production decreased by 1.3 million metric tons due to reduced EU and Australian yields[4]Source: U.S. Department of Agriculture, "U.S. 2025/26 Soybean Supply Forecast Declines on Lower Beginning Stocks and Production," usda.gov. This supply-demand imbalance affects the availability of deodorizer distillates (DODs), the primary feedstock for natural vitamin E extraction. Natural vitamin E manufacturers face significant exposure to these fluctuations, as DODs are by-products of the edible oil refining industry, making supply volumes dependent on overall edible oil processing trends. Reduced soybean or rapeseed crushing capacity from poor harvests, trade restrictions, or biofuel diversion decreases feedstock availability and increases costs. Palm oil distillates experience similar volatility, with additional uncertainty from deforestation-related sustainability regulations and export restrictions in major producing countries like Indonesia and Malaysia.
Limited certified non-GMO raw-material supply chains
The strict requirements for Non-GMO certification create supply chain bottlenecks that limit market growth, as identity-preserved sourcing systems cannot meet the increasing demand for verified natural ingredients. The Non-GMO Project's verification process requires detailed documentation of raw material sources, segregation protocols, and processing methods, which many suppliers in the soybean, rapeseed, and palm value chains struggle to consistently fulfill. Consequently, certified non-GMO natural vitamin E ingredients command higher prices, restricting their use in price-sensitive applications. The geographic concentration of raw materials intensifies these challenges. The United States, Brazil, and Argentina produce a significant portion of the world's soybeans, and these regions predominantly cultivate genetically modified crops. This results in limited availability of non-GMO soybean distillates, creating strong competition among food, nutraceutical, and supplement manufacturers for verified ingredients. The requirement for strict identity preservation throughout the supply chain, including segregation during cultivation, transport, crushing, and refining, further increases operational complexity and costs.
*Our forecasts treat driver/restraint impacts as directional, not additive. The impact forecasts reflect baseline growth, mix effects, and variable interactions.
Segment Analysis
By Product Type: Tocotrienols Drive Innovation Despite Tocopherol Dominance
Tocopherols hold an 79.85% market share in 2025, due to their established regulatory status and broad application across food, supplement, and cosmetic formulations. Tocotrienols are experiencing the fastest growth at 8.64% CAGR through 2031, supported by new clinical research and specific health applications. In the natural vitamin E market, tocopherols maintain their position as the primary product type through their established use in nutraceuticals, fortified foods, and functional beverages. Their antioxidant properties, straightforward extraction from oilseed sources, and clear regulatory status make them the standard choice for manufacturers.
Tocotrienols, while less common but more biologically active, are gaining prominence in premium market segments. Their specific health benefits include neuroprotective, cholesterol-lowering, and anti-inflammatory properties, attracting health-conscious consumers. Scientific research continues to validate their enhanced bioactivity compared to tocopherols, particularly in cardiovascular and cognitive health applications, supporting their increased market adoption despite premium pricing.


By Source: Sunflower Oil Gains Traction Amid Soybean Dominance
Soybean oil holds 46.25% market share in 2025 as the primary feedstock for natural vitamin E extraction, supported by established processing infrastructure and regulatory compliance. Sunflower oil exhibits the highest growth rate at 7.4% CAGR through 2031, benefiting from its non-GMO status and allergen-free characteristics that meet clean-label requirements. Sunflowers' drought resistance and reduced fertilizer needs enhance their market position in environmentally conscious regions.
Rapeseed/canola oil and corn oil maintain stable market positions, while palm oil deodorizer distillates face environmental concerns despite their efficiency in tocotrienol extraction. Rice bran and other specialty sources serve specific market segments with distinct tocopherol profiles. The European Food Safety Authority's re-evaluation of tocopherols as food additives has validated the safety of all major feedstock sources, supporting ongoing market diversification.
By Application: Beauty and Personal Care Accelerates Beyond Dietary Supplements
Dietary supplements hold the largest market share at 43.95% in 2025, as vitamin E continues to be essential in antioxidant and immune support formulations globally. The beauty and personal care segment is experiencing the highest growth rate with a 9.28% CAGR through 2031, supported by increasing demand for nutricosmetics and topical antioxidant products. Fortified and functional food and beverage applications continue to grow steadily, supported by regulatory updates such as China's revised GB 14880 standards, which modify vitamin E fortification levels across food categories.
The FDA's Modernization of Cosmetics Regulation Act has introduced systematic oversight, benefiting natural vitamin E suppliers with comprehensive documentation. While pharmaceutical applications maintain stable demand in specialized segments, animal feed constitutes a significant volume despite lower unit prices. The market faces regulatory challenges, particularly in beauty-from-within products that may be classified as drugs, necessitating careful management of product claims across different applications.
Geography Analysis
Asia-Pacific holds a 34.75% share of the natural vitamin E market in 2025 and is projected to grow at a 7.12% CAGR through 2031. This growth stems from increasing middle-class populations, urbanization, and government initiatives supporting functional foods. China's updated regulatory framework, including revised food ingredient standards and health food catalogues, provides clear pathways for market expansion while ensuring safety standards. The region's manufacturing base, concentrated in Malaysia, China, and India, offers supply chain advantages but also presents concentration risks. Vietnam's health supplement regulations, which mandate GMP certification and Vietnamese-language labeling, demonstrate the regulatory evolution supporting natural ingredient market development.
North America maintains a stable market position with established regulations and consumer preference for natural ingredients, despite slower growth compared to Asia-Pacific. The FDA's GRAS designations for natural vitamin E sources and Non-GMO Project verifications enable quality-based market differentiation. European markets prioritize sustainability, with the Corporate Sustainability Due Diligence Directive requiring supply chain verification, benefiting natural vitamin E suppliers with transparent sourcing practices.
South America and Middle East and Africa present growth opportunities driven by increasing health awareness and expanding middle-class populations. While their regulatory frameworks are still developing compared to established markets, these regions are adopting international standards and certifications, creating opportunities for suppliers with robust regulatory compliance and quality management systems.

Regulatory Landscape
Natural vitamin E used in foods and supplements is handled through additive, fortification, and labeling rules that vary by region, but converge on tight control of permitted forms and intake limits. In the European Union, vitamin E addition is regulated under Regulation (EC) No 1925/2006 (authorized vitamins and minerals for fortification) and its use as a food additive is framed by Regulation (EC) No 1333/2008, which grounds compliance in the specific vitamin E forms and conditions of use set out in EU legislation.
In the United States, alpha-tocopherol derivatives relevant to this category are addressed through FDA food additive and GRAS pathways, including 21 CFR Part 172 for direct food additives and GRAS listings for certain tocopherol forms. As an administrative anchor for market participants tracking permitted substances, the FDA Substances Added to Food inventory entry for Alpha-Tocopherol Acetate shows an update date of 21 April 2026. In the United Kingdom, the Committee on Toxicity discussion paper prepared for the 14 July 2026 meeting revisited excess vitamin E exposure considerations, reinforcing the need for formulators to manage serving sizes and claims against tolerable upper intake benchmarks when positioning high-dose products.
Value Chain Analysis
Natural vitamin E supply starts with feedstock generation from edible oil refining, where vegetable oil deodorizer distillates (DODs) from soybean, sunflower, rapeseed/canola, and corn oils provide the primary raw material stream. These distillates are processed by specialized firms to concentrate and purify tocopherols and tocotrienols using molecular distillation and downstream steps such as crystallization, esterification, and chromatography, before being formulated into standardized concentrates or beadlets for dietary supplements, fortified foods and beverages, and cosmetics.
Midstream processing is capital intensive, with molecular distillation and advanced extraction lines requiring significant investment, and it is sensitive to feedstock availability and specification requirements (identity-preserved, non-GMO, and allergen-managed lots). Bottlenecks also reflect competition for high-quality deodorizer distillate with other downstream uses, including biodiesel and oleochemicals, and certification lead times that slow rapid supplier switching. Distribution typically runs through ingredient distributors and blenders into brand owners and contract manufacturers, a structure that favors suppliers able to provide documentation packages spanning food, supplement, and cosmetic compliance while maintaining redundancy after disruptions such as the BASF Ludwigshafen outage.
Competitive Landscape
The natural vitamin E market exhibits moderate concentration, reflecting a balance of competition between established multinational suppliers and specialized ingredient companies. Supply chain resilience became a crucial competitive factor following the 2024 explosion at BASF's Ludwigshafen plant, which led to force majeure declarations and highlighted the risks associated with concentrated production. Companies with diversified manufacturing facilities and alternative feedstock capabilities gained advantages during supply disruptions.
Technology differentiation in the market centers on extraction efficiency, stabilization methods, and analytical capabilities that ensure regulatory compliance and quality assurance. DSM-Firmenich maintains its position as the only Western vitamin E supplier, utilizing proprietary beadlet technology and comprehensive regulatory support, which enables premium pricing strategies.
Market opportunities exist in specialized applications such as nutricosmetics and functional textiles, where innovations in delivery systems and bioavailability enhancement create new market segments. The EPA's tolerance exemption for vitamin E compounds as inert ingredients in pesticide formulations has opened regulatory pathways for applications beyond traditional nutrition markets.
Natural Vitamin E Industry Leaders
-
BASF SE
-
Archer Daniels Midland Company
-
Brenntag AG
-
Merck KGaA
-
dsm-firmenich
- *Disclaimer: Major Players sorted in no particular order

Market Opportunities and Future Outlook
Opportunities are concentrated where natural vitamin E delivers both technical functionality and label advantages, particularly in formulations aiming to replace synthetic antioxidants (such as BHA and BHT) while also providing nutrient fortification in fats, oils, bakery, beverages, and supplement formats. Regulatory clarity continues to support adoption: the EU framework under Regulation (EC) No 1925/2006 defines permitted fortification forms, while the United States provides market access through FDA food additive provisions (21 CFR Part 172) and GRAS pathways, supporting product development programs built around compliant forms and substantiated labeling.
Supply and capability shifts also create room for processors with secure feedstock contracts and high-purity finishing capacity. The announced discontinuation of Cargill natural tocopherol production (communicated in May 2026 with discontinuation in July 2026) tightens the competitive set and increases the importance of qualifying alternative suppliers and distributors quickly. Demand is also moving toward non-GMO and allergen-sensitive sourcing, supporting sunflower-derived inputs, as reflected in supplier activity around upcycled sunflower by-products (for example, Kensing Sun E), along with premiumization in tocotrienol-based ingredients (including annatto-derived lines) that require specialized purification and documentation for differentiated claims.
Recent Industry Developments
- July 2026: Cargill discontinued production of all natural tocopherols, following an earlier communicated plan to exit the category. This change shifts sourcing strategies for downstream users that relied on its output and increases the need for qualification of alternative suppliers and distributors with equivalent specifications.
- August 2025: BASF lifted force majeure on multiple vitamin products, including DL-alpha-tocopherol and vitamin E-acetate 98%, after prior supply disruptions. The change supported broader supply normalization and altered procurement dynamics for formulators balancing natural versus synthetic vitamin E inputs during tight markets.
- April 2024: Kensing launched Sun E, an upcycled, non-GMO natural vitamin E ingredient derived from sunflower seed by-products, expanding its natural vitamin E portfolio after acquiring Advanced Organic Materials. The launch reinforced the shift toward alternative, traceable feedstocks and gave brand owners a sustainability-oriented sourcing option aligned with clean-label positioning.


Research Methodology Framework and Report Scope
Market Definition and Coverage
For this study, the natural vitamin E market covers the sales value of naturally derived vitamin E ingredients used in finished products across nutrition, food, and personal care uses, counted at the ingredient level in USD.
Scope exclusions: Exclusions include synthetic vitamin E forms, and we do not count the full retail value of finished supplements, foods, or cosmetics that only contain vitamin E as an ingredient.
Segmentation Overview
-
By Product Type
- Tocopherols
- Tocotrienols
-
By Source
- Soybean Oil
- Rapeseed/Canola Oil
- Sunflower Oil
- Corn Oil
- Palm-Oil Deodoriser Distillates
- Others (Rice-bran, etc.)
-
Application
- Dietary Supplements
- Fortified/Functional Food and Beverage
- Beauty and Personal Care Products
- Pharmaceuticals
- Others (Animal Feed etc.)
-
Geography
-
North America
- United States
- Canada
- Mexico
- Rest of North America
-
Europe
- Spain
- United Kingdom
- Germany
- France
- Italy
- Rest of Europe
-
Asia-Pacific
- China
- Japan
- India
- Australia
- Rest of Asia-Pacific
-
South America
- Brazil
- Argentina
- Rest of South America
-
Middle East and Africa
- Saudi Arabia
- South Africa
- Rest of Middle East and Africa
-
North America
Data Sources, Market Sizing, and Validation
Desk Research
Desk research was used to set the fact base around supply, regulatory context, and use patterns for natural vitamin E. We reviewed public sources such as the USDA and other agriculture statistics programs to understand oilseed processing trends, and customs statistics portals to sense trade flows of relevant oils and derivatives.
To anchor application demand and claims language, we also referred to FDA GRAS listings and EFSA guidance, along with peer reviewed nutrition and formulation literature and selected trade association publications. Company annual reports, investor presentations, and reputable press were used to map capacity moves and pricing direction, and then a paid subscription for company financials and a patent database were used selectively to validate timelines and product focus areas. This list is not exhaustive, and many other public sources were also used for data collection, validation, and research clarification.
Primary Interviews and Surveys
Primary work was used to check what desk sources could not show clearly, especially how natural vitamin E demand splits by application and how pricing moves between tocopherols and tocotrienols. We spoke with stakeholders across ingredient production, distributors, and downstream formulators to confirm assumptions on purity grade, typical formulation rates, and contract buying cycles.
Since this is a global market, inputs were cross-checked across APAC, EMEA, and the Americas, and follow-ups were done when responses indicated large differences in yield assumptions, sourcing constraints, or near-term demand changes.
Distribution of primary research fieldwork respondents
| Company type | Respondent position | Region |
|---|---|---|
| Top tier: 38% | CXOs: 12% | APAC: 43% |
| Mid tier: 48% | Functional/Unit leaders: 37% | EMEA: 33% |
| Smaller Players: 14% | Managers: 51% | Americas: 24% |
Market-Sizing & Forecasting
Sizing was built using both top-down and bottom-up logic, starting from a demand pool reconstructed through application-level consumption signals and then narrowing it to natural vitamin E ingredients. In practice, the top-down approach uses indicators such as dietary supplement output trends, clean label food fortification activity, personal care formulation shifts, and regional growth patterns, which are then converted into ingredient demand using typical inclusion rates and observed grade mixes.
To keep the model realistic, the totals were corroborated through selective bottom-up approximations such as sampled supplier volumes, channel checks with distributors, and price per kg ranges applied to estimated tonnage (with gaps handled by using conservative ranges and cross-region comparables when a single market had thin visibility). Inputs that materially change the curve include tocopherols versus tocotrienols share movement, soybean and sunflower based feedstock availability, yield and recovery rates from deodorizer distillates, and application mix shifts between supplements and beauty uses.
For forecasting, we used scenario analysis supported by simple regression checks where historical drivers were consistent, and then the final outlook was adjusted based on expert consensus on feedstock conditions, demand resilience, and realistic price progression rather than a straight-line CAGR.
Data Validation & Update Cycle
Validation was done by triangulating the modeled market value against independent signals such as trade movements, feedstock availability trends, and observed pricing direction in key regions. When outputs drifted away from these signals, assumptions were reopened, and respondents were re-contacted to clarify whether the variance came from grade mix, application reallocation, or timing effects.
Before sign-off, the model goes through multi-step analyst reviews, where outliers are stress-tested and key inputs are checked for consistent units and currency timing. Reports are refreshed annually, and interim updates are made when material events occur, such as major capacity changes, supply disruptions, or sharp feedstock swings. Right before delivery, a final pass is completed so clients receive the latest updated view.
Mordor Intelligence's Natural Vitamin E Market Size Compared With Other Published Estimates
Published market sizes for natural vitamin E can look far apart because the underlying scope is not always the same, and the conversion from demand indicators into ingredient value is handled differently by each publisher. We see the biggest differences when estimates mix ingredient sales with finished-product value, or when they blend natural and synthetic vitamin E into one total.
Synthetic vitamin E sits outside Mordor Intelligence's scope, and that single exclusion, combined with counting only ingredient-level revenues across applications, explains much of the spread versus figures that include broader vitamin E products or downstream retail value.
Benchmark comparison
| Source | Market Size | Gaps in Research Methodology |
|---|---|---|
| Mordor Intelligence | USD 1.09 B (2026) | |
| Industry Publisher A | USD 1.10 B (2025) | Uses a different base year and may apply broader application coverage and assumption sets for inclusion rates and regional mix, which can shift the ingredient demand build-up even when the natural-only label is used. |
| Trade Release B | USD 1.91 B (2025) | Often bundles wider natural vitamin E product forms and end uses, and can lean toward value attribution beyond the ingredient layer, which typically inflates the number versus an ingredient-sales-only model. |
The table shows that year alignment and what is being counted, ingredient sales versus broader product value, drive most of the difference. By keeping the scope tight to natural ingredient revenue and checking totals against feedstock, application signals, and price ranges, the estimate stays easier to audit and repeat when the market shifts.


Key Questions Answered in the Report
How large is the natural vitamin E market in 2026?
The natural vitamin E market size stands at USD 1.09 billion in 2026 with a 6.62% CAGR outlook to 2031.
Which region contributes the most revenue?
Asia-Pacific leads with 34.75% share in 2025 and is projected to outpace other regions at a 7.12% CAGR.
What segment grows fastest by application?
Beauty and personal-care products record the highest 9.28% CAGR through 2031, surpassing supplements.
Why are sunflower-based tocopherols gaining traction?
Sunflower oil offers non-GMO and allergen-free advantages, supporting a 7.4% CAGR in source-level growth.
Page last updated on:


