Vitamin E Market Size and Share
Market Overview
| Study Period | 2021 - 2031 |
|---|---|
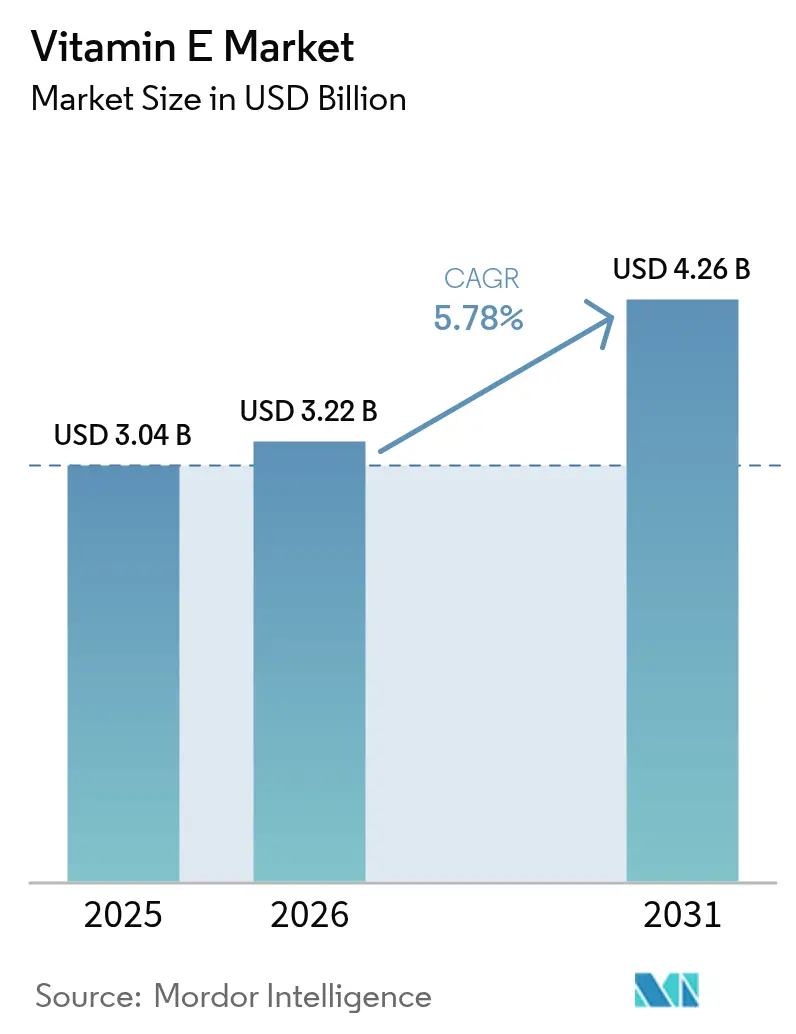
| Market Size (2026) | USD 3.22 Billion |
| Market Size (2031) | USD 4.26 Billion |
| Growth Rate (2026 - 2031) | 5.78% CAGR |
| Fastest Growing Market | Europe |
| Largest Market | Asia Pacific |
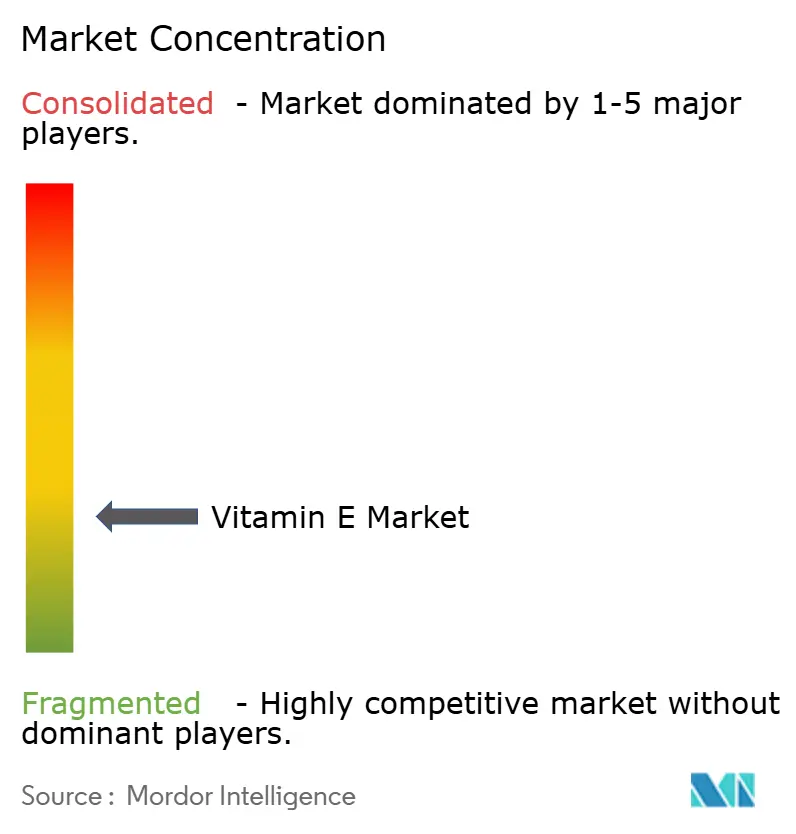
| Market Concentration | Low |
Major Players
*Disclaimer: Major Players sorted in no particular order Image © Mordor Intelligence. Reuse requires attribution under CC BY 4.0. |
|
Vitamin E Market Analysis by Mordor Intelligence
Vitamin E market size in 2026 is estimated at USD 3.22 billion, growing from 2025 value of USD 3.04 billion with 2031 projections showing USD 4.26 billion, growing at 5.78% CAGR over 2026-2031. The market growth stems from increased consumer awareness of vitamin E's health benefits, including its antioxidant properties, immune system support, and skin health benefits, driving demand in dietary supplements and functional foods. The market has seen a shift toward plant-based vitamin E sources, such as sunflower, soybean, and safflower oils, aligning with consumer preference for natural and clean-label products. The cosmetics and personal care industry's incorporation of vitamin E for its moisturizing and anti-aging properties has contributed to market expansion. The fortification of foods and beverages with essential nutrients has created opportunities in functional food segments. The market growth is further supported by urbanization, higher disposable incomes, and increased health awareness in emerging economies, particularly in the Asia-Pacific region.
Key Report Takeaways
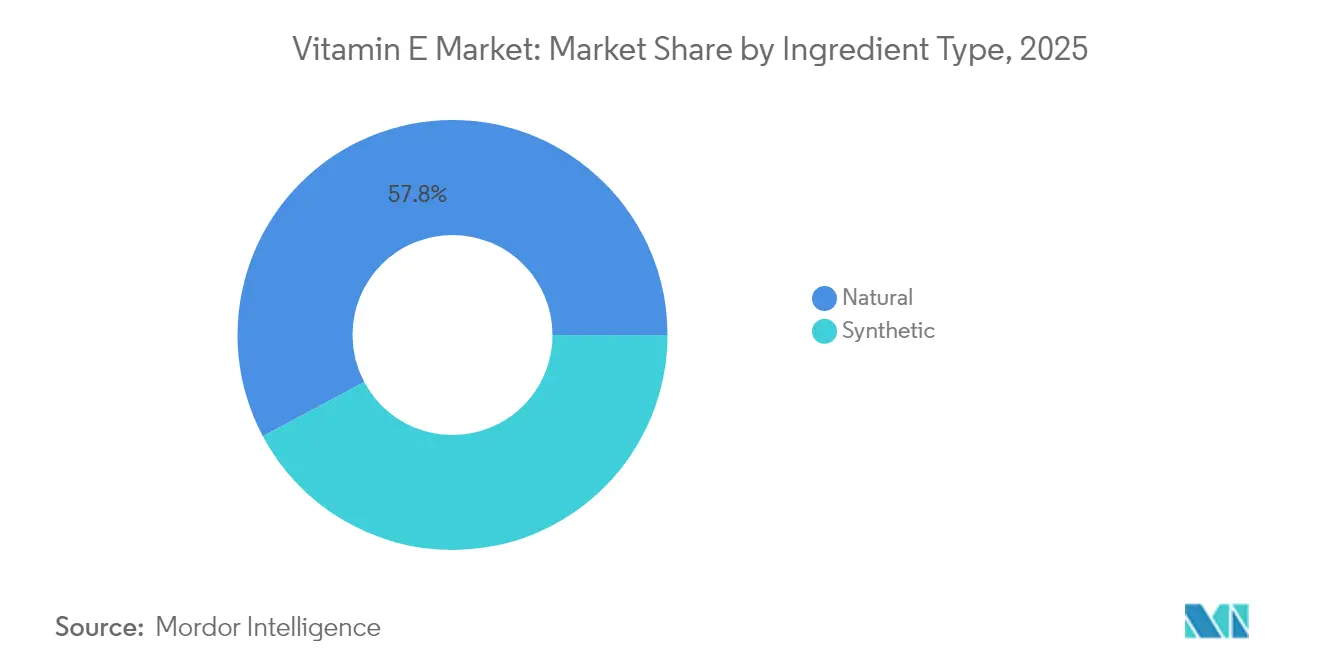
- By ingredient type, natural vitamin E led with 57.80% revenue share in 2025; it is projected to expand at a 6.02% CAGR through 2031.
- By application, dietary supplements held 47.10% of the vitamin E market share in 2025, while cosmetics and personal care are forecast to advance at a 6.18% CAGR to 2031.
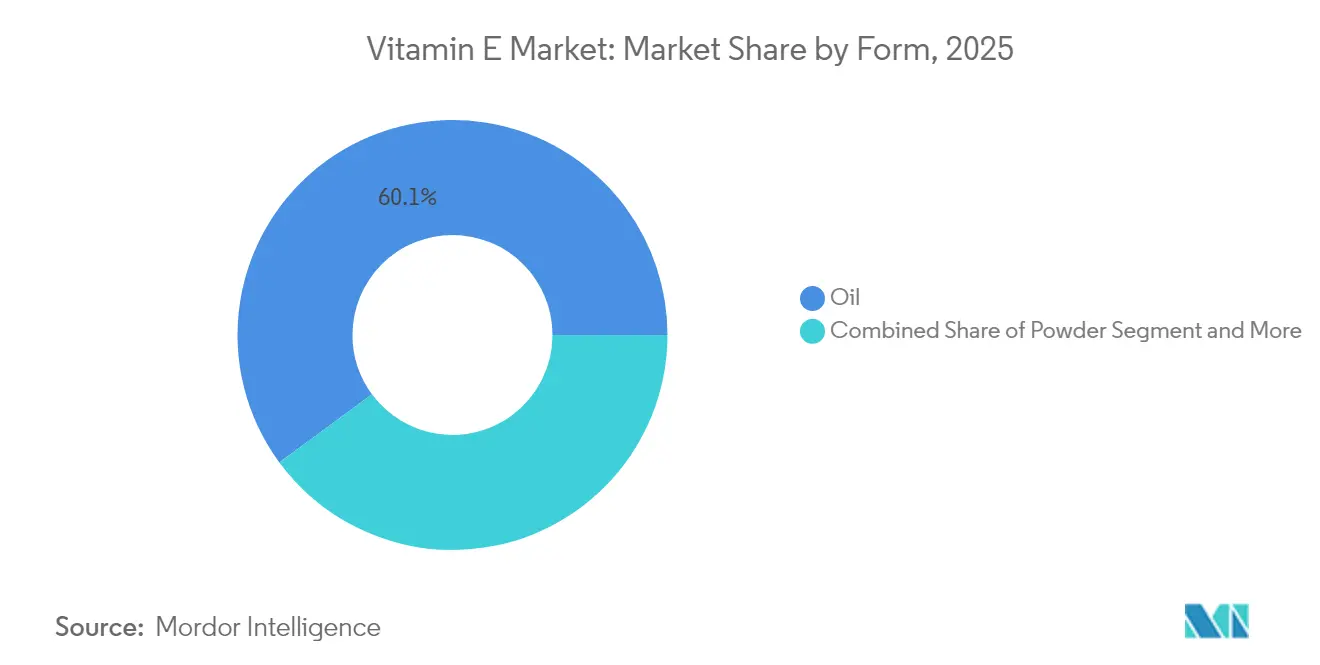
- By form, oil captured 60.10% of the vitamin E market size in 2025 and remains the fastest-growing form at a 6.01% CAGR over the outlook period.
- By geography, Asia-Pacific commanded 41.40% share of the vitamin E market in 2025; Europe records the highest projected CAGR at 7.79% between 2026 and 2031.
Note: Market size and forecast figures in this report are generated using Mordor Intelligence’s proprietary estimation framework, updated with the latest available data and insights as of 2026.
Global Vitamin E Market Trends and Insights
Drivers Impact Analysis*
| Driver | (~) % Impact on CAGR Forecast | Geographic Relevance | Impact Timeline |
|---|---|---|---|
| Growing aging population driving demand for dietary supplements | +1.2% | Global, with concentration in North America and Europe | Long term (≥ 4 years) |
| Increasing consumer awareness about preventive healthcare and nutritional supplements | +0.9% | Global, strongest in developed markets | Medium term (2-4 years) |
| Expanding demand from pharmaceutical industry for vitamin E-based medications | +0.7% | North America and Europe, expanding to Asia-Pacific | Medium term (2-4 years) |
| Shift toward clean label products accelerates demand for natural-sourced vitamin E | +1.1% | Europe and North America, spreading globally | Long term (≥ 4 years) |
| Widening use of vitamin E in animal feed for livestock health and productivity | +0.8% | Global, with strongest growth in Asia-Pacific and South America | Medium term (2-4 years) |
| Surging private label manufacturing boosts ingredient-level demand | +0.6% | North America and Europe, expanding to emerging markets | Short term (≤ 2 years) |
| Source: Mordor Intelligence | |||
Growing Aging Population Driving Demand for Dietary Supplements
The global demographic shift toward an aging population influences the consumption patterns of vitamin E (tocopherols and tocotrienols), as adults over 65 require increased antioxidant supplementation to combat age-related oxidative stress. The Food and Drug Administration (FDA)'s classification of tocopherols as generally safe substances under 21 CFR 182.3890 establishes regulatory compliance parameters for supplement manufacturers. This regulatory framework facilitates the development of vitamin E formulations specifically designed for the aging demographic. The demographic transition generates consistent market demand that persists beyond economic cycles, positioning vitamin E supplementation as a stable growth category in the nutraceuticals market. According to World Bank data, the United States population aged 65 and over increased from 16.92% in 2022 to 17.43% in 2023, strengthening the demand for vitamin E supplementation products [1]Source: World Bank, "Age distribution in the United States", databank.worldbank.org.
Increasing Consumer Awareness about Preventive Healthcare and Nutritional Supplements
Growing awareness of micronutrient deficiencies through consumer education and digital health platforms has increased recognition of vitamin E deficiency symptoms, including skin problems, vision issues, and immune system impairment. The Philippines' implementation of vitamin classification guidelines, which set vitamin E limits at 536 mg per day, demonstrates regulatory adaptation to increased consumer demand for fortified foods and supplements. These regulations provide opportunities for manufacturers to develop formulations that optimize dosages while maintaining safety standards. The increased focus on preventive healthcare, driven by pandemic-related health awareness, has established vitamin E as an essential ingredient in wellness products.
Expanding Demand from Pharmaceutical Industry for Vitamin E-Based Medications
The pharmaceutical industry's growing demand is driving the global Vitamin E market growth. Vitamin E's antioxidant, anti-inflammatory, and immune-enhancing properties make it essential in pharmaceutical formulations. The pharmaceutical industry uses Vitamin E in medications for cardiovascular diseases, neurodegenerative disorders, immune system deficiencies, skin disorders, and cancer treatments. In dermatological applications, particularly for acne treatment, Vitamin E has gained significant importance. According to the American Academy of Dermatology Association, acne affects up to 50 million Americans annually, making it the most common skin condition in the United States[2]Source: American Academy of Dermatology Association, "Skin Conditions by the Numbers", www.aad.org. The pharmaceutical industry incorporates Vitamin E based on clinical evidence demonstrating its effectiveness in reducing oxidative stress, which is crucial in treating acne and chronic inflammatory diseases. Additionally, consumer preferences for medications with therapeutic and skin-nourishing properties have encouraged pharmaceutical manufacturers to include Vitamin E in their dermatological products.
Shift Toward Clean Label Products Accelerates Demand for Natural-Sourced Vitamin E
Natural vitamin E, specifically d-alpha tocopherol, demonstrates superior bioavailability and enhanced tissue retention characteristics compared to synthetic alternatives, which significantly influences market sourcing preferences in the clean label segment. The compound's molecular structure and biological efficacy contribute to its increased market demand across nutritional applications. BASF introduced natural-based products for personal care, including biodegradable styling polymers and sustainable ingredients, aligning with environmental goals. In Indonesia, palm oil supply chain developments focus on integrating smallholder farmers and implementing sustainable production methods. While natural vitamin E maintains premium pricing in the market, it creates substantial opportunities for producers with integrated sustainable sourcing capabilities.
Restraints Impact Analysis*
| Restraint | (~) % Impact on CAGR Forecast | Geographic Relevance | Impact Timeline |
|---|---|---|---|
| High production costs and raw material price volatility affect market profitability | -0.8% | Global, particularly affecting smaller producers | Short term (≤ 2 years) |
| Stringent regulatory norms slow down global product approvals | -0.5% | Europe and North America, expanding globally | Medium term (2-4 years) |
| High quality and certification standards limit market access for small and new Entrants | -0.4% | Global, most restrictive in developed markets | Long term (≥ 4 years) |
| Limited availability of raw materials | -0.6% | Global, acute in regions dependent on palm oil imports | Medium term (2-4 years) |
| Source: Mordor Intelligence | |||
High Production Costs and Raw Material Price Volatility Affect Market Profitability
The high production costs associated with extracting and processing Vitamin E, particularly from natural sources, significantly constrain the global Vitamin E market's growth and profitability. The extraction of natural Vitamin E from vegetable oils (soybean, sunflower, wheat germ, and safflower) requires complex processes of extraction, purification, and stabilization, which increase operational and manufacturing expenses. Raw material price volatility further compounds these costs, influenced by climatic changes, geopolitical instability, supply chain disruptions, and varying agricultural yields. For example, droughts in major soybean-producing regions like Brazil or the United States can reduce supply substantially, increasing prices of tocopherol-rich oils. Additionally, China's carbon reduction targets (aiming for carbon neutrality by 2060) have resulted in temporary shutdowns of energy-intensive industries, including chemical and pharmaceutical manufacturing, affecting the supply of intermediates needed for Vitamin E production.
Stringent Regulatory Norms slow down Global Product Approvals
The Food and Drug Administration (FDA)'s revised draft guidance for dietary supplements mandates comprehensive safety notifications for new dietary ingredients, increasing regulatory complexity across major markets. The European regulatory framework adds further requirements through clean label standards and sustainability mandates, requiring detailed documentation of ingredient sourcing and production processes. In infant formula manufacturing, specific regulations under 21 CFR Part 107 require vitamin E content of 0.7 International Units per gram of linoleic acid, creating strict formulation requirements [3]Source: Food and Drug Administration (FDA), "Audit Standards Comparison to the Infant Formula Regulation", www.fda.gov. These regulatory requirements benefit established companies with robust regulatory compliance departments while creating entry barriers for smaller innovative firms, especially in pharmaceutical and infant nutrition markets.
*Our forecasts treat driver/restraint impacts as directional, not additive. The impact forecasts reflect baseline growth, mix effects, and variable interactions.
Segment Analysis
By Ingredient Type: Natural Premium Drives Market Evolution
Natural vitamin E holds 57.80% of the market share in 2025, as consumers increasingly choose bioavailable d-alpha tocopherol over synthetic alternatives. The natural segment is projected to grow at 6.02% CAGR during 2026-2031, supported by clean label trends and regulatory support for natural ingredients. The higher tissue retention and bioactivity of natural vitamin E support its premium pricing, especially in dietary supplements and cosmetics, where efficacy influences purchasing decisions. While synthetic vitamin E retains cost advantages in feed applications, it faces challenges from sustainability requirements and increased consumer awareness about bioavailability differences.
Natural vitamin E manufacturers are strengthening supply chain transparency and implementing sustainable sourcing practices to serve premium market segments. The development of improved extraction technologies and biofortification methods is increasing natural vitamin E yields from oilseed crops, which may reduce production costs while preserving quality benefits. Synthetic vitamin E manufacturers are implementing process improvements and cost reduction measures, but encounter difficulties in markets where natural origin is a key consumer requirement. This creates distinct market segments for natural and synthetic forms, each with unique growth patterns and profit potential.


By Application: Dietary Supplements Lead While Cosmetics Accelerate
Dietary supplements dominate the global vitamin E market, holding 47.10% of the market share in 2025. The aging global population and increased focus on preventive healthcare drive the demand for antioxidant supplementation. Consumer awareness of vitamin E's health benefits, including free radical neutralization, immune system support, and chronic disease risk reduction, contributes to sustained market growth. The segment's expansion is supported by the increased prevalence of lifestyle diseases and greater accessibility to dietary supplements across developed and developing markets.
The cosmetics and personal care segment is expected to grow at a compound annual growth rate (CAGR) of 6.18% through 2031. This growth stems from vitamin E's demonstrated benefits in protecting skin lipids from oxidation and enhancing skin barrier function. The segment's expansion is further supported by vitamin E's role in improving cosmetic product stability. The rise of clean beauty trends and increased demand for natural antioxidant ingredients drive vitamin E's integration into skincare, haircare, and anti-aging formulations.
By Form: Oil Dominance Reflects Versatility Advantages
Oil-based vitamin E formulations maintain market dominance with a 60.10% share in 2025 and a projected CAGR of 6.01% through 2031, attributed to their superior stability and versatility across food and cosmetic applications. The oil form's inherent compatibility with lipid-based delivery systems enhances its effectiveness in premium supplement formulations and cosmetic products, where skin penetration and stability are essential performance requirements, while powder formulations address specific market requirements for water solubility and distinct processing characteristics, particularly in functional foods and beverage fortification.
The market segmentation reflects the evolution of application requirements, with oil forms maintaining advantages in traditional uses due to simpler manufacturing processes, while powder innovations target emerging applications in water-based systems and specialized delivery formats through advanced encapsulation technologies, including electrohydrodynamic techniques that enable controlled release and enhanced stability. Manufacturing efficiency considerations favor oil production, while powder forms command premium pricing in specialized applications requiring enhanced functionality or processing convenience, demonstrating the complementary nature of both formulations in meeting diverse market needs.
Geography Analysis
Asia-Pacific holds 41.40% of the global vitamin E market in 2025, primarily due to its position as the world's largest palm oil producer and manufacturing hub for natural and synthetic vitamin E. The region's advantages in raw material access and production capacity strengthen its position in both domestic and export markets. China's 14th Five-Year Plan (2021-2025) promotes national nutrition and functional food industries, supporting vitamin E supplementation to address aging-related diseases and oxidative stress. Indonesia's palm oil supply chain developments, including corporate farming models for smallholder integration, improve the sustainability of natural vitamin E feedstock supply. The region maintains manufacturing capabilities across the value chain, from raw material processing to finished product formulation.
Europe exhibits the highest growth rate at 7.79% CAGR during 2026-2031, supported by strict regulations that favor natural ingredients and premium products. The region's clean label requirements and sustainability standards create opportunities for vitamin E suppliers who meet traceability and environmental criteria. BASF's production facilities in Germany and Denmark support the region's premium markets, while their transition to 100% renewable electricity demonstrates environmental commitment. The European market's preference for natural and sustainable ingredients enables suppliers to maintain higher margins despite increased regulatory compliance costs.
North America maintains a significant market position through established dietary supplement and functional food distribution channels. The Food and Drug Administration (FDA)'s regulatory framework for dietary supplements and food fortification provides market stability while enabling product differentiation through health claims. The region's informed consumer base creates demand for premium formulations and innovative delivery systems, expanding vitamin E applications beyond basic commodities.


Competitive Landscape
The vitamin E market demonstrates moderate fragmentation. Major global companies such as BASF SE, DSM-Firmenich NV, Archer-Daniels-Midland Company, Wilmar International Limited, and Merck KGaA operate alongside regional players and natural ingredient suppliers. The market's fragmentation stems from diverse application requirements and geographic distribution, with varying competitive advantages across segments.
Companies establish market differentiation through technological advancement and sustainable practices. This includes implementing advanced production methods, developing sophisticated formulation capabilities, and ensuring supply chain transparency. BASF's development of its Eco Balanced portfolio and implementation of renewable electricity in United States facilities exemplifies the industry's shift toward environmentally conscious operations. Additionally, vertical integration strategies in natural vitamin E production enable companies to maintain control over raw material costs and quality assurance processes.
The vitamin E market's cyclical nature and potential supply chain vulnerabilities necessitate robust operational strategies. Companies with diversified production capacity and established risk management systems maintain competitive advantages over those dependent on single-source supply chains. This operational resilience becomes particularly significant during production disruptions, enabling companies to maintain a consistent market supply and meet customer demands effectively.
Vitamin E Industry Leaders
-
BASF SE
-
DSM-Firmenich NV
-
Archer-Daniels-Midland Company
-
Wilmar International Limited
-
Merck KGaA
- *Disclaimer: Major Players sorted in no particular order

Recent Industry Developments
- April 2025: DSM-Firmenich has recommenced operations at its Vitamin E manufacturing facility, marking a significant development in the company's production capabilities.
- March 2025: Louis Dreyfus Company (LDC) introduced a new range of plant-based Vitamin E products at the 2025 Food Ingredients China exhibition, including mixed tocopherols, acetate products, and succinate products.
- January 2025: BASF announced plans to expand its annual vitamin E acetate production capacity by 10% by 2027 at its Ludwigshafen manufacturing site in Germany. The company initiated this investment to strengthen its position in the vitamin E market.
- May 2023: Ildong Bioscience, a South Korean company, secured patents for three probiotic strains that produce B-vitamins and vitamin C through the enzymatic conversion of vitamin precursors.


Research Methodology Framework and Report Scope
Market Definitions and Key Coverage
Our study defines the vitamin E market as the value generated from natural and synthetic tocopherols and tocotrienols that are purposely formulated and sold for dietary supplements, functional foods and beverages, cosmetics and personal care, infant nutrition, and compound animal feed.
Sales of unprocessed oilseeds, crude deodorizer distillate, and blended multivitamin finished goods are not included.
Segmentation Overview
-
By Ingredient Type
- Natural
- Synthetic
-
By Application
- Functional Foods and Beverages
- Dietary Supplements
- Cosmetics and Personal Care
- Infant Nutrition
- Animal Feed
- Others
-
By Form
- Oil
- Powder
- Others
-
By Geography
-
North America
- United States
- Canada
- Mexico
- Rest of North America
-
Europe
- Germany
- United Kingdom
- Italy
- France
- Spain
- Netherlands
- Poland
- Belgium
- Sweden
- Rest of Europe
-
Asia-Pacific
- China
- India
- Japan
- Australia
- Indonesia
- South Korea
- Thailand
- Singapore
- Rest of Asia-Pacific
-
South America
- Brazil
- Argentina
- Colombia
- Chile
- Peru
- Rest of South America
-
Middle East and Africa
- South Africa
- Saudi Arabia
- United Arab Emirates
- Nigeria
- Egypt
- Morocco
- Turkey
- Rest of Middle East and Africa
-
North America
Detailed Research Methodology and Data Validation
Primary Research
Mordor analysts conducted interviews with ingredient blenders, premix formulators, and nutritionists in North America, Europe, China, and Brazil, along with procurement leads at global personal care brands. Dialogs tested supply assumptions, verified inclusion rates in layer poultry diets, and gathered average selling prices that desktop work alone could not secure.
Desk Research
We compiled trade, production, and pricing clues from open datasets such as FAOSTAT crop output, UN Comtrade tocopherol tariff lines, the NIH Office of Dietary Supplements fact sheets, EFSA additive registers, and feed ingredient usage notes from the International Feed Industry Federation. Company 10-K filings and D&B Hoovers snapshots clarified capacity additions and contract prices. Subscriber tools like Dow Jones Factiva helped us flag new regulations and product launches in real time. These sources illustrate, rather than exhaust, the reference pool we mined.
Market-Sizing and Forecasting
We first reconstructed global demand through a top-down "tocopherol availability" model using deodorizer distillate supply, synthetic capacity utilizations, and regional enrichment norms. We then cross-checked it with sampled ASP × volume roll-ups from primary contacts. Key levers, average feed inclusion (IU/ton), penetration of vitamin-fortified RTD beverages, crude palm oil price shifts, and natural source yield recoveries drive the multivariate regression that projects values to 2030. Gap pockets in bottom-up evidence are bridged by weighted regional proxies before final reconciliation.
Data Validation and Update Cycle
Outputs pass a three-layer review: automated variance scans, peer analyst sign-off, and a senior re-read before publication. Models refresh annually, with mid-cycle tweaks when material events, such as a Chinese plant shutdown, alter supply or price trajectories.
Why Mordor's Vitamin E Baseline Commands Reliance
Published market estimates vary because firms pick dissimilar scopes, pricing bases, and refresh cadences. Our disciplined variable set and annual rebuild curb those drifts.
Principal gap drivers elsewhere include counting multivitamin retail sales, using list rather than contract prices, or not normalizing volumes lost to feed grade potency slippage.
Benchmark comparison
| Market Size | Anonymized source | Primary gap driver |
|---|---|---|
| USD 3.04 B | Mordor Intelligence | - |
| USD 4.75 B | Global Consultancy A | Includes combined multivitamin tablets and retail mark-ups |
| USD 2.70 B | Research Provider B | Excludes cosmetics channel and applies conservative Asia feed penetration rates |
The comparison shows that, by anchoring on clearly bounded use cases and corroborated contract prices, Mordor delivers a balanced, transparent baseline that decision makers can replicate with publicly traceable inputs.


Key Questions Answered in the Report
What is the current size of the vitamin E market and how fast is it growing?
The vitamin E market is valued at USD 3.22 billion in 2026 and is projected to reach USD 4.26 billion by 2031, registering a 5.78% CAGR over the 2026-2031 forecast period.
Which ingredient type holds the largest share in the vitamin E market?
Natural d-alpha-tocopherol leads with 57.80% revenue share in 2025 and is expanding at a 6.02% CAGR as clean-label preferences rise.
Why is Europe the fastest-growing region for vitamin E?
Strict clean-label rules and consumer willingness to pay premiums for sustainably sourced ingredients drive Europe’s 7.79% CAGR outlook.
Which application segment is advancing the fastest?
Cosmetics and personal care, supported by vitamin E’s antioxidant benefits, is forecast to grow at a 6.18% CAGR through 2031.
Page last updated on:


