Health Ingredients Market Size and Share
Market Overview
| Study Period | 2021 - 2031 |
|---|---|
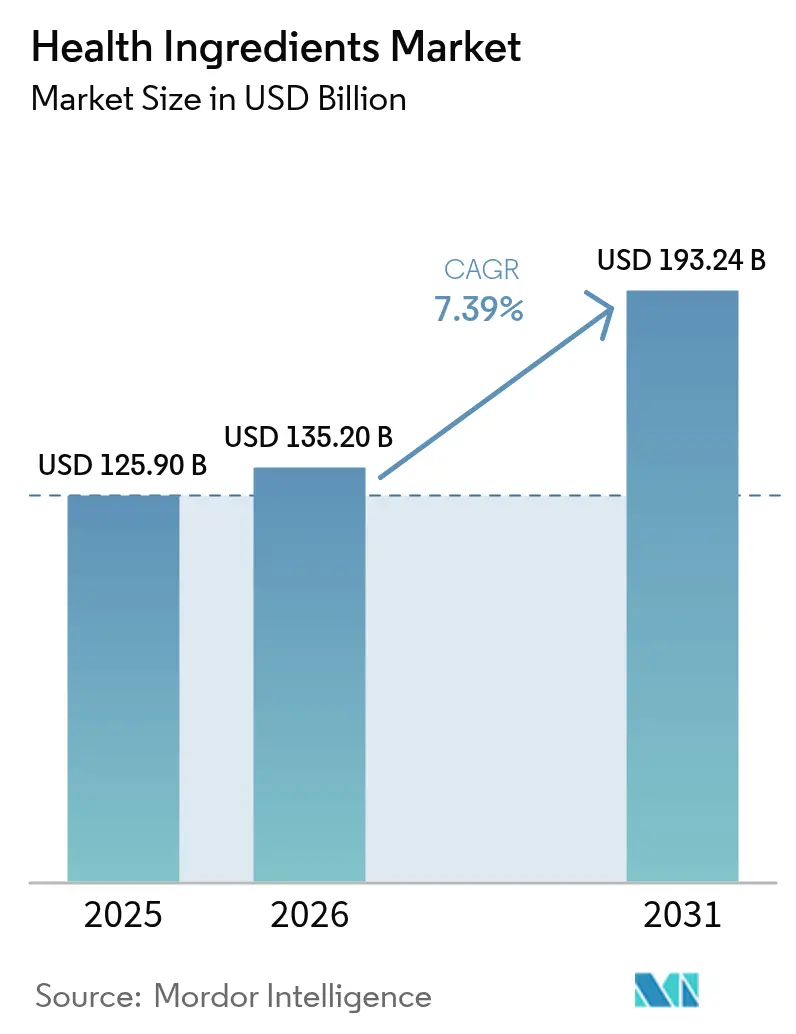
| Market Size (2026) | USD 135.2 Billion |
| Market Size (2031) | USD 193.24 Billion |
| Growth Rate (2026 - 2031) | 7.39% CAGR |
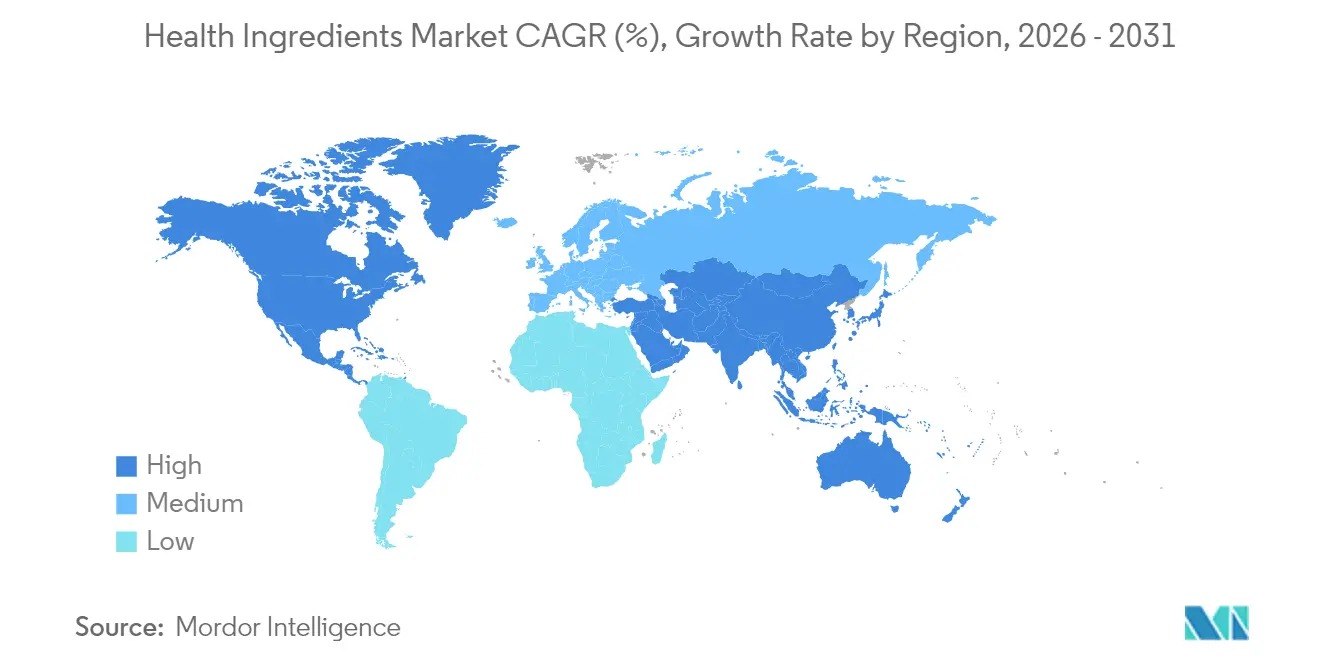
| Fastest Growing Market | Asia Pacific |
| Largest Market | North America |
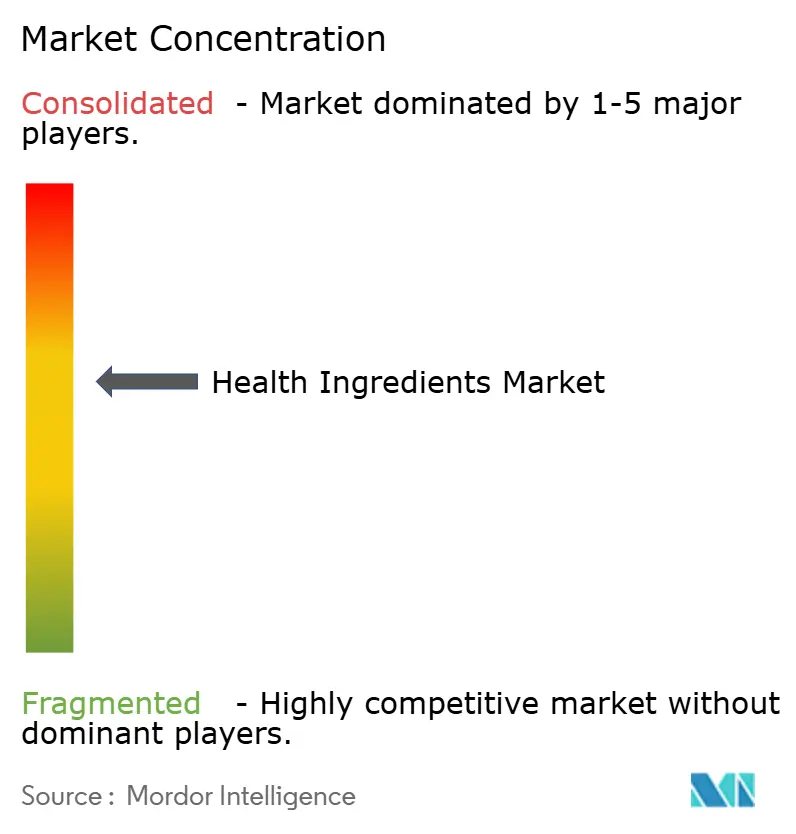
| Market Concentration | Medium |
Major Players
*Disclaimer: Major Players sorted in no particular order Image © Mordor Intelligence. Reuse requires attribution under CC BY 4.0. |
|
Health Ingredients Market Analysis by Mordor Intelligence
The health ingredients market size in 2026 is estimated at USD 135.2 billion, growing from 2025 value of USD 125.90 billion with 2031 projections showing USD 193.24 billion, growing at 7.39% CAGR over 2026-2031. The market's robust expansion is largely attributed to the escalating prevalence of lifestyle-related diseases, surging healthcare costs, and a marked pivot towards preventive care and nutritional wellness. A pivotal moment looms in February 2025, when the FDA's updated definition of "healthy" foods comes into play, opening new avenues for ingredient suppliers who resonate with these elevated nutritional and formulation benchmarks. Within product segmentation, proteins dominate, highlighting their widespread acceptance in wellness and functional offerings. Vitamins, meanwhile, are poised for a notable upswing, driven by a growing awareness of micronutrient deficiencies. The market's sourcing landscape is led by plant-based ingredients, echoing a consumer preference for sustainable and vegan options. Dry formats continue to be favored across diverse applications, yet liquid forms are making a pronounced entrance, praised for their adaptability and superior bioavailability. In terms of application, the food and beverage sector takes the lead, propelled by the rising trend of fortified and functional products. Notably, the pharmaceutical industry is outpacing its counterparts, underscoring a growing inclination to integrate health ingredients into both therapeutic and preventive strategies. Geographically, North America emerges as the dominant player, supported by a discerning, health-focused consumer base and transparent regulatory frameworks. Meanwhile, the Asia-Pacific region is swiftly ascending, driven by increasing incomes, a heightened health consciousness, and rapid urbanization.
Key Report Takeaways
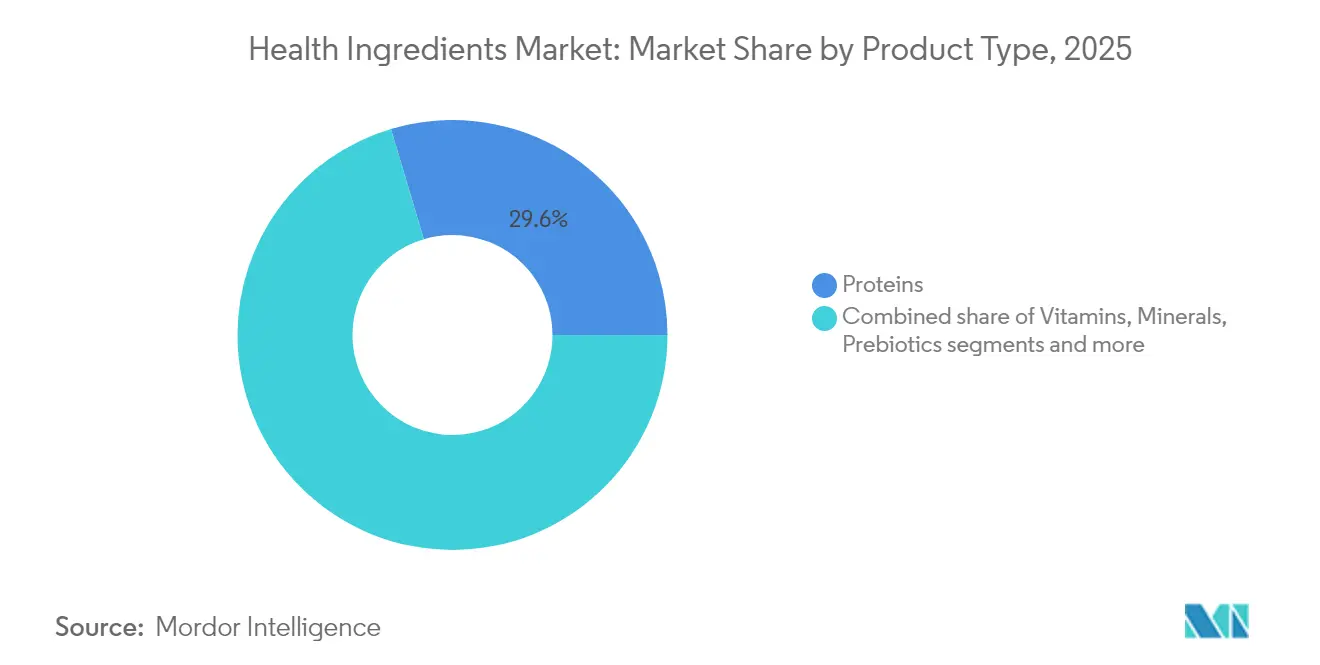
- By product type, proteins held 29.62% of the health ingredients market share in 2025, while vitamins are projected to post the fastest 8.82% CAGR through 2031.
- By source, plant-based ingredients led with 62.12% of the health ingredients market size in 2025, whereas microbial-based inputs top growth at 8.98% CAGR.
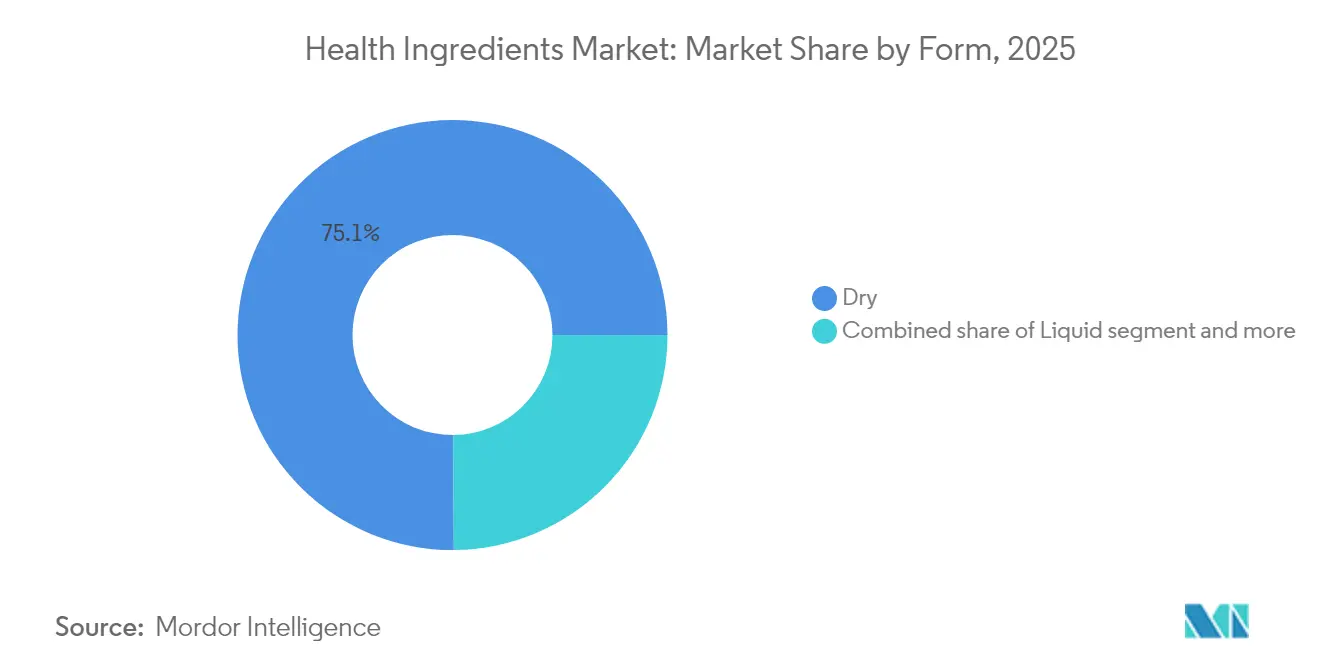
- By form, dry formats commanded 75.10% of the health ingredients market size in 2025; liquid formats recorded the highest 10.39% CAGR toward 2031.
- By application, food and beverages contributed 39.84% of the health ingredients market size in 2025, while pharmaceutical demand rises at an 11.78% CAGR.
- By geography, North America captured 35.22% of the health ingredients market share in 2025; Asia-Pacific expands the quickest at 10.32% CAGR to 2031.
Note: Market size and forecast figures in this report are generated using Mordor Intelligence’s proprietary estimation framework, updated with the latest available data and insights as of 2026.
Global Health Ingredients Market Trends and Insights
Drivers Impact Analysis*
| Driver | (~) % Impact on CAGR Forecast | Geographic Relevance | Impact Timeline |
|---|---|---|---|
| Growing consumer focus on wellness and disease prevention through nutrition | +1.2% | Global, with higher intensity in North America and Europe | Medium term (2-4 years) |
| Increasing prevalence of chronic diseases and lifestyle disorders | +1.8% | Global, particularly acute in Asia-Pacific urban centers | Long term (≥ 4 years) |
| Growing demand for natural and clean-label ingredients | +1.5% | North America and the European Union are leading, expanding into the Asia-Pacific | Medium term (2-4 years) |
| Aging global population seeking functional foods | +1.1% | Global, concentrated in developed markets | Long term (≥ 4 years) |
| Heightened demand for fortified food products | +0.9% | Asia-Pacific core, spill-over to Middle East amd Africa and Latin America | Short term (≤ 2 years) |
| Increasing adoption of plant-based ingredients | +1.3% | Global, with early gains in North America, Europe, and urban Asia | Medium term (2-4 years) |
| Source: Mordor Intelligence | |||
Growing Consumer Focus on Wellness and Disease Prevention Through Nutrition
According to the American Heart Association’s 2024 report, 29.3 million adults globally have been diagnosed with diabetes, 9.7 million remain undiagnosed, and 115.9 million are estimated to have pre-diabetes [1]Source: American Heart Association, "2024 Heart Disease and Stroke Statistics: A Report of US and Global Data From the American Heart Association," researchgate.net. This revelation is driving the growth of the global health ingredients market. As consumers become more proactive about their health, they're gravitating towards preventive, nutrition-centric solutions. This trend has heightened the demand for ingredients that boast clinically validated health benefits, transcending mere nutrition. For example, Kerry Group's Wellmune is known for bolstering immune health, while Nestlé Health Science's LactoSpore is recognized for its digestive benefits. With healthcare costs on the rise globally, many consumers are opting for dietary preventive measures instead of turning to costly treatments. In response to this trend, DSM-Firmenich has unveiled its Healthy Longevity platform, focusing on brain, digestive, and immune health. At the same time, wearable health technologies, such as Fitbit and Apple Watch, are enabling users to monitor their vitals and adjust their diets in real-time. This blend of health-centric lifestyles, scientifically backed formulations, and personalized monitoring is not just fueling market growth but also indicating a significant shift towards proactive health management through functional nutrition.
Increasing Prevalence of Chronic Diseases and Lifestyle Disorders
The increasing prevalence of chronic diseases is driving growth in the global health ingredients market. Factors such as sedentary lifestyles, poor dietary habits, and stress have increased the demand for preventive health solutions, including functional foods and dietary supplements containing bioactive ingredients. Consumers are taking a more active role in managing their health through nutrition, resulting in higher consumption of vitamins, minerals, and omega-3 fatty acids. These ingredients support immune function, reduce inflammation, and maintain cardiovascular, metabolic, and cognitive health. The transition from reactive to preventive healthcare approaches has expanded beyond consumer preferences to become a medical necessity. The rising number of chronic disease diagnoses has prompted individuals to seek natural and functional solutions for symptom management and disease prevention, sustaining the demand for health ingredients in food, beverage, and supplement products. According to the Italian National Institute of Statistics (ISTAT), in 2023, over 23.6 million individuals in Italy were living with at least one chronic disease, highlighting the need for dietary and lifestyle interventions [2]Source: Italian National Institute of Statistics, "Number of people affected by at least one chronic disease in Italy," istat.it.
Growing Demand for Natural and Clean-Label Ingredients
The Food and Drug Administration (FDA) is tightening its grip on Generally Recognized as Safe (GRAS) regulations, pushing for more stringent safety documentation and potentially sidelining self-affirmed safety claims. This shift in the regulatory landscape is a boon for companies like Givaudan and Naturex, which boast comprehensive safety dossiers and a portfolio of natural ingredients. In contrast, suppliers of synthetic ingredients are finding themselves under heightened scrutiny. As consumers increasingly gravitate towards clean-label and organic products, premium pricing has become the norm. This trend has particularly favored compliant companies like Ingredion, known for its plant-based, non-GMO offerings. Moreover, the clean-label movement is reshaping production methods. For instance, solvent-free technologies, such as hydrodynamic cavitation, are now being employed to extract valuable bioactives like curcumin and polyphenols. To align with consumer demands, companies such as IFF and FrieslandCampina are integrating blockchain traceability, ensuring both ingredient integrity and ethical sourcing. Natural health ingredients are finding their way into dietary supplements, herbal medicines, and functional foods, resonating with consumer preferences. Highlighting the market's potential, a 2023 report from the Center for the Promotion of Imports revealed that 52% of European consumers turned to supplements for preventive health, emphasizing the demand for safe, traceable, and naturally sourced ingredients.
Aging Global Population Seeking Functional Foods
As the global population ages, the demand for health ingredients surges, driven by seniors' quest for vitality, management of age-related conditions, and an enhanced quality of life. With older adults facing increased risks like osteoporosis, cardiovascular issues, and cognitive decline, there's a noticeable pivot towards functional foods and supplements. Products such as Nestlé Health Science’s Meritene and Swisse’s Ultivite are now in the spotlight, designed to bolster joint health, memory, heart function, and digestion. This wellness-centric approach among seniors is amplifying the demand for nutrient-dense, bioavailable, and easily digestible formulations. In response, manufacturers are rolling out age-specific innovations, including collagen peptides, omega-3s, and plant-based proteins. These innovations aim to address the specific nutritional needs of seniors, ensuring they receive targeted support for their health challenges and improving their overall quality of life. This trend is particularly evident in aging regions; for instance, the U.S. Census Bureau highlighted in 2025 that 59% of U.S. metro areas boasted a median age of 40 or older [3]Source: U.S. Census Bureau, “An Aging Nation: U.S. Median Age Surpassed 39 in 2024 – Census.gov," census.gov . Such demographic shifts spotlight a burgeoning market opportunity for health ingredients tailored to longevity and senior wellness, resonating across diverse global populations.
Restraints Impact Analysis*
| Restraint | (~) % Impact on CAGR Forecast | Geographic Relevance | Impact Timeline |
|---|---|---|---|
| Limited availability of raw materials | -0.8% | Global, with acute impact in regions dependent on specific botanical sources | Short term (≤ 2 years) |
| Price volatility of natural and organic ingredients | -1.1% | Global, particularly affecting premium ingredient segments | Short term (≤ 2 years) |
| Technical challenges in maintaining ingredient stability and shelf life | -0.6% | Global, with higher impact on liquid formulations and sensitive compounds | Medium term (2-4 years) |
| Complex regulatory requirements and approval processes across different regions | -0.9% | Global, with varying intensity based on regulatory maturity | Long term (≥ 4 years) |
| Source: Mordor Intelligence | |||
Limited Availability of Raw Materials
As climate change disrupts traditional botanical cultivation zones and intensifies cross-industry demand, supply chain constraints significantly restrain the Global Health Ingredients Market. The geographic concentration of specialty ingredients, such as ashwagandha from India and ginseng from Korea, renders the supply chain vulnerable to extreme weather, geopolitical instability, and trade barriers. This vulnerability drives volatility in both the availability and pricing of these ingredients. In response, companies like ADM and Evonik are diversifying their sourcing and adopting alternative production methods, such as cellular agriculture and synthetic biology, to lessen their dependence on conventional farming. Yet, the industry's pivot towards sustainable sourcing, evidenced by certifications like Rainforest Alliance and FairWild, temporarily tightens supply as producers adapt to these environmental and social benchmarks. To bolster long-term stability, industry leaders are forging grower partnerships and investing in regional production hubs. A prime example is DSM-Firmenich's foray into localized fermentation facilities. Such strategies are pivotal for ensuring ingredient continuity and fostering global market growth, even in the face of escalating supply chain challenges.
Price Volatility of Natural and Organic Ingredients
Weather variability, seasonal harvest cycles, and shifting supply-demand dynamics drive significant price volatility for natural ingredients in the Global Health Ingredients Market. This unpredictability poses challenges for food and supplement manufacturers trying to forecast costs. The U.S. Department of Agriculture (USDA) reports that food prices have closely followed these global commodity market fluctuations, exacerbating pricing instability. The costs of organic-certified ingredients rise due to limited certifier availability, inspection fees, and varying regional regulatory standards, which add complexity to the certification process. Moreover, currency fluctuations in international trade heighten price unpredictability for imported ingredients like maca, turmeric, and spirulina, making cost management more difficult. To navigate these challenges, larger companies utilize forward contracts and financial hedging, backed by sophisticated procurement systems. In contrast, smaller firms often find themselves without such tools, making them more vulnerable to market shocks. This disparity has led to increased industry consolidation, with larger, financially robust players gaining a competitive edge through enhanced cost resilience and tighter supply chain control.
*Our forecasts treat driver/restraint impacts as directional, not additive. The impact forecasts reflect baseline growth, mix effects, and variable interactions.
Segment Analysis
By Product Type: Proteins Lead Market Share Despite Vitamin Growth Surge
In 2025, proteins commanded a dominant 29.62% share of the Global Health Ingredients Market, buoyed by a consistent consumer shift towards alternative protein sources. These proteins play pivotal roles in muscle health, weight management, and sports nutrition. The protein segment encompasses a diverse range: from plant-based options like pea and soy, to animal-derived choices such as whey and collagen, and even microbial sources like mycoprotein. Industry leaders, including DSM-Firmenich and Roquette, are pioneering specialized protein formulations tailored for various life stages and health conditions, notably targeting sarcopenia prevention in aging adults. Additionally, a rising demand for clean-label and allergen-free protein options is propelling segment growth in both developed and emerging markets.
Vitamins are on a rapid ascent, projected to grow at a CAGR of 8.82% through 2031. This surge is largely attributed to heightened awareness of micronutrient deficiencies and proactive fortification efforts, especially in Southeast Asia and Sub-Saharan Africa. While minerals enjoy steady traction in fortified foods and supplements, prebiotics and probiotics are witnessing a notable boom. This surge is driven by an intensified focus on gut health, immunity, and mental well-being, with brands like FrieslandCampina's Biotis and Chr. Hansen’s probiotic strains are leading the charge. Nutritional lipids, with a spotlight on algal omega-3s, are emerging as the go-to sustainable alternative to traditional fish oil. Meanwhile, niche segments like functional carbohydrates and enzymes are finding their footing, catering specifically to sports and digestive health. The “Others” category, which includes postbiotics and human milk oligosaccharides (HMOs), is also carving out a niche, showcasing promising growth despite its limited market share.


By Source: Plant-Based Dominance Challenged by Microbial Innovation
In 2025, plant-based ingredients commanded a leading share of 62.12%, fueled by a surging demand for natural, sustainable, and allergen-free substitutes to animal-derived components. This upward trajectory is bolstered by technological strides in extraction and purification, amplifying ingredient potency while upholding a clean-label image. Widely embraced in supplements and functional foods, ingredients like turmeric extract, pea protein, and green tea polyphenols are at the forefront. Industry giants, Kerry Group and Ingredion, have broadened their portfolios with plant-based offerings, aligning with both health and environmental standards, further cementing the segment's dominance.
Microbial-based ingredients are the fastest-growing segment, boasting a robust 8.98% CAGR (2026-2031). This surge is propelled by innovations in precision fermentation and synthetic biology, which either replicate or enhance compounds once exclusively sourced from plants or animals. Cargill's strategic forays into life sciences VC funds highlight a pronounced commitment to microbiome health and fermentation-derived actives. While animal-based ingredients still hold sway in niches requiring distinct bioactive profiles, they grapple with intensifying scrutiny over sustainability and ethical considerations. Meanwhile, the "Others" category, encompassing synthetic and hybrid formats, is making strides. Leveraging microencapsulation techniques like spray drying and coacervation, these formats safeguard bioactives and facilitate controlled release. The melding of biotechnology with traditional production methods unveils fresh avenues for nimble companies navigating a diverse ingredient landscape.
By Form: Dry Formulations Dominate While Liquid Processing Advances
In 2025, dry formulations dominated the market, capturing a substantial 75.10% share. Their logistical efficiency, extended shelf life, and compatibility with popular delivery forms like powders, capsules, and tablets underscore their appeal. Manufacturers favor these formats for their storage convenience, reduced transportation costs, and the widespread availability of production infrastructure. Consumers, particularly in the dietary supplements realm, readily embrace these dry formats. Furthermore, dry ingredients ensure enhanced stability for sensitive compounds, including vitamins, minerals, and botanical extracts, making them ideal for functional foods, nutraceuticals, and pharmaceuticals.
On the other hand, liquid formulations are on a rapid ascent, boasting a CAGR of 10.39% projected through 2031, with the functional beverage segment leading the charge. Innovations such as nanoemulsion technology are pivotal, boosting the solubility and bioavailability of oil-based ingredients like omega-3s and curcumin in water-based beverages. Companies are harnessing techniques like hydrodynamic cavitation and advanced homogenization to optimize the extraction and delivery of bioactives, ensuring better absorption and stability. Meanwhile, gels and pastes, though niche, cater to foodservice and institutional markets with their concentrated, ready-to-use formulations.
By Application: Food and Beverages Lead While Pharmaceuticals Accelerate
In 2025, the food and beverages segment dominated the market, seizing a 39.84% share. This segment's broad applications span bakery, confectionery, snacks, dairy, and, notably, functional beverages. Strong distribution networks and a rising consumer appetite for health-enhancing foods have bolstered this dominance. Functional beverages, in particular, are witnessing rapid growth as consumers gravitate towards convenient formats infused with ingredients like electrolytes, collagen, and antioxidants. In response to shifting wellness trends, manufacturers are rolling out innovative clean-label and plant-based options, catering to global market demands.
Meanwhile, the pharmaceutical segment is emerging as the fastest-growing, with projections estimating a CAGR of 11.78% through 2031. This surge is attributed to the increasing adoption of nutraceuticals as complementary therapies, coupled with innovations in drug delivery systems and excipients. A testament to this trend was Roquette’s strategic acquisition of IFF’s Pharma Solutions division in March 2024, a deal valued at up to USD 2.85 billion, highlighting the industry's pivot towards pharmaceutical-grade health ingredients. Dietary supplements are gaining traction, fueled by a heightened awareness of preventive health. Concurrently, feed applications are expanding, driven by a renewed emphasis on livestock health and productivity. Additionally, the “Others” category, encompassing personal care and cosmetics, is leveraging bioactives like hyaluronic acid and biotin, seamlessly merging nutrition with beauty and wellness.
Geography Analysis
In 2025, North America commanded the market, clinching a 35.22% share. This dominance is bolstered by robust regulatory frameworks, heightened consumer awareness of functional nutrition, and well-established distribution channels spanning the food, supplement, and pharmaceutical sectors. The region's vibrant research and development ecosystem, coupled with substantial venture capital influx, empowers biotechnology firms to spearhead innovations in ingredient synthesis and delivery technologies. These factors collectively position North America as a leader in driving advancements and meeting consumer demands in the health ingredients market.
On the other hand, the Asia-Pacific region is on a rapid ascent, boasting a projected CAGR of 10.32% through 2031. This surge is driven by urbanization, increasing disposable incomes, and a burgeoning middle class gravitating towards health-centric diets. While Japan stands out with its sophisticated functional food regulations, other emerging markets navigate through more streamlined approval processes. The region's dynamic growth is further supported by increasing investments in infrastructure and the rising influence of local manufacturers in the global market. Europe, with its stringent regulatory landscape, showcases a robust appetite for natural and organic products, underscoring a regional commitment to sustainability and ethical sourcing. European consumers are increasingly inclined to invest in ingredients that boast clinically validated benefits and transparent sourcing.
South America, the Middle East, and Africa are emerging as hotspots, spurred by urban expansion and a growing affinity for Western dietary trends. Yet, these regions grapple with regulatory hurdles and pricing dilemmas. Nonetheless, as their economies burgeon, so does the demand for health ingredients. These regions are also witnessing increased collaborations with global players, which are helping to address supply chain inefficiencies and improve market accessibility. Given the global interconnectivity of ingredient supply chains, the Asia-Pacific's upward trajectory is poised to sway global pricing and material accessibility, thereby redefining sourcing and distribution strategies worldwide.

Competitive Landscape
The health ingredients market demonstrates moderate consolidation, with established multinational companies maintaining competitive positions through vertical integration, Research and Development capabilities, and global distribution networks. Market leaders, including Archer-Daniels-Midland Company, Cargill, Incorporated, BASF SE, and DSM-Firmenich AG, maintain strong positions through diversified portfolios across multiple ingredient categories and end-use applications. This diversification provides resilience against segment-specific volatility. The market sees increased competition from specialized biotechnology firms developing new production methods and smaller companies targeting niche applications with high-margin potential.
Technology adoption serves as a key differentiator, as companies invest in precision fermentation, microencapsulation, and advanced extraction methods to enhance ingredient functionality while reducing production costs. The global increase in patent filings for functional food innovation indicates higher Research and Development investment and strategic positioning around proprietary technologies.
New opportunities exist in personalized nutrition, where companies can use consumer health data to develop targeted ingredient formulations. Sustainable production methods that address environmental concerns while maintaining cost competitiveness present additional growth potential. Market disruption comes from cellular agriculture companies developing animal-free proteins and biotechnology firms using synthetic biology to produce complex molecules traditionally sourced naturally, potentially transforming conventional supply chains and value propositions.
Health Ingredients Industry Leaders
-
Archer-Daniels-Midland Company
-
Cargill, Incorporated
-
BASF SE
-
Kerry Group
-
DSM-Firmenich AG
- *Disclaimer: Major Players sorted in no particular order

Recent Industry Developments
- May 2025: OmniActive Health Technologies introduced Sleeproot and Zenroot ingredients in select European markets to address sleep, stress, and mood management needs.
- May 2025: Natac Group (NAT) introduced its new branded ingredient, Oligut, at Vitafoods Europe, a nutraceutical industry exhibition in Barcelona. The patented product combines olive tree polyphenols and triterpenes to enhance gastrointestinal health.
- May 2025: Darling Ingredients Inc. signed a non-binding term sheet with Tessenderlo Group to merge their collagen and gelatin segments into a new company, Nextida. The merger aims to establish a leading manufacturer of collagen-based health, wellness, and nutrition products.
- March 2025: Friesland Campina Ingredients launched Nutri Whey ProHeat, a heat-stable, microparticulated whey protein that enables enhanced formulation flexibility in ready-to-drink (RTD) beverages.


Research Methodology Framework and Report Scope
Market Definitions and Key Coverage
Our study defines the health ingredients market as the total value of bio-active compounds, such as proteins, vitamins, minerals, probiotics, prebiotics, nutritional lipids, functional carbohydrates, enzymes, and plant or fruit extracts, sold in bulk or formulated form to food, beverage, supplement, feed, and pharmaceutical manufacturers worldwide.
Scope Exclusions: colors, high-intensity sweeteners, and purely synthetic preservatives are kept outside this assessment to avoid inflating segment revenues.
Segmentation Overview
-
By Product Type
- Proteins
- Vitamins
- Minerals
- Prebiotics
- Nutritional Lipids
- Probiotics
- Functional Carbohydrates
- Enzymes
- Others
-
By Source
- Plant-based
- Animal -based
- Microbial-based
- Others
-
By Form
- Dry
- Liquid
- Others
-
By Application
-
Foods and Beverages
- Bakery and Confectionary
- Snacks
- Dairy Products
- Beverages
- Others
- Dietary Supplements
- Feed
- Pharmaceuticals
- Others
-
Foods and Beverages
-
By Geography
-
North America
- United States
- Canada
- Mexico
- Rest of North America
-
Europe
- Germany
- United Kingdom
- Italy
- France
- Spain
- Netherlands
- Poland
- Belgium
- Sweden
- Rest of Europe
-
Asia-Pacific
- China
- India
- Japan
- Australia
- Indonesia
- South Korea
- Thailand
- Singapore
- Rest of Asia-Pacific
-
South America
- Brazil
- Argentina
- Colombia
- Chile
- Peru
- Rest of South America
-
Middle East and Africa
- South Africa
- Saudi Arabia
- United Arab Emirates
- Nigeria
- Egypt
- Morocco
- Turkey
- Rest of Middle East and Africa
-
North America
Detailed Research Methodology and Data Validation
Primary Research
Mordor analysts interview ingredient processors, formulation scientists, contract manufacturers, regulatory consultants, and large brand R&D managers across North America, Europe, Asia-Pacific, and Latin America. These conversations validate typical inclusion rates, current average selling prices, and pipeline volumes, filling data gaps that secondary material alone cannot address.
Desk Research
We first map supply, demand, price, and trade indicators from reputable public sources such as FAO trade stats, USDA GATS, Eurostat's PRODCOM, EFSA novel food dossiers, and WHO nutrition databases. Company 10-K filings, patent libraries on Questel, and news archives on Dow Jones Factiva complement the foundation. Ingredient usage ratios are cross-checked with trade association white papers from entities like the International Probiotics Association. The sources cited here are illustrative; many more publications inform the dataset.
Market-Sizing & Forecasting
A top-down reconstruction starts with global functional food, beverage, supplement, and fortified feed revenues and applies ingredient penetration ratios derived from production and trade data. Results are then balanced against bottom-up checkpoints, sampled supplier revenues, channel checks, and average price-times-volume calculations to adjust outliers. Key variables include: - New product launches tracked on Mintel GNPD, - Average ingredient price indices from UN Comtrade, - Per-capita supplement spend, - Regulatory approvals (GRAS, EFSA), and - Consumer survey data on fortified food frequency. Multivariate regression combined with scenario analysis projects each driver forward to 2030, while sensitivity tests flag any assumption with disproportionate impact.
Data Validation & Update Cycle
Outputs pass an anomaly screen, peer review, and management sign-off. We refresh the model every twelve months or sooner if a material regulatory or supply shock occurs. A final data sweep is completed just before publication.
Why Mordor's Health Ingredients Baseline Earns Trust
Published estimates often vary because firms choose different ingredient lists, end-use pools, and update cadences.
Key gap drivers include whether botanical actives are grouped with pharmaceuticals, how average selling prices are escalated, and the frequency of field interviews that temper spreadsheet assumptions before forecasts are locked.
Benchmark comparison
| Market Size | Anonymized source | Primary gap driver |
|---|---|---|
| USD 125.9 B | Mordor Intelligence | - |
| USD 126.4 B | Global Consultancy A | Includes bulk botanicals and active pharmaceutical intermediates; minimal primary validation |
| USD 108.9 B | Trade Journal B | Relies on customs shipment weight with static 2021 prices and updates every three years |
The comparison shows that when scope creep or dated pricing skews numbers, totals swing widely. Mordor's disciplined variable selection, annual refresh, and dual-track validation give decision-makers a balanced baseline they can trace, question, and reuse with confidence.


Key Questions Answered in the Report
What is the current size of the health ingredients market in 2026?
The health ingredients market size is USD 135.2 billion in 2026.
Which region is growing the fastest in the health ingredients market?
Asia-Pacific posts the strongest 10.32% CAGR toward 2031, driven by urbanization and rising disposable income.
Which product category leads the health ingredients market share?
Proteins lead with 29.62% of market share in 2025, reflecting sustained demand for alternative and functional proteins.
Why are microbial-based ingredients gaining momentum?
Microbial ingredients grow at 8.98% CAGR because precision fermentation offers consistent quality, reduced land use, and scalable output.
Page last updated on:


