Visual Cloud Market Size and Share
Market Overview
| Study Period | 2019 - 2030 |
|---|---|
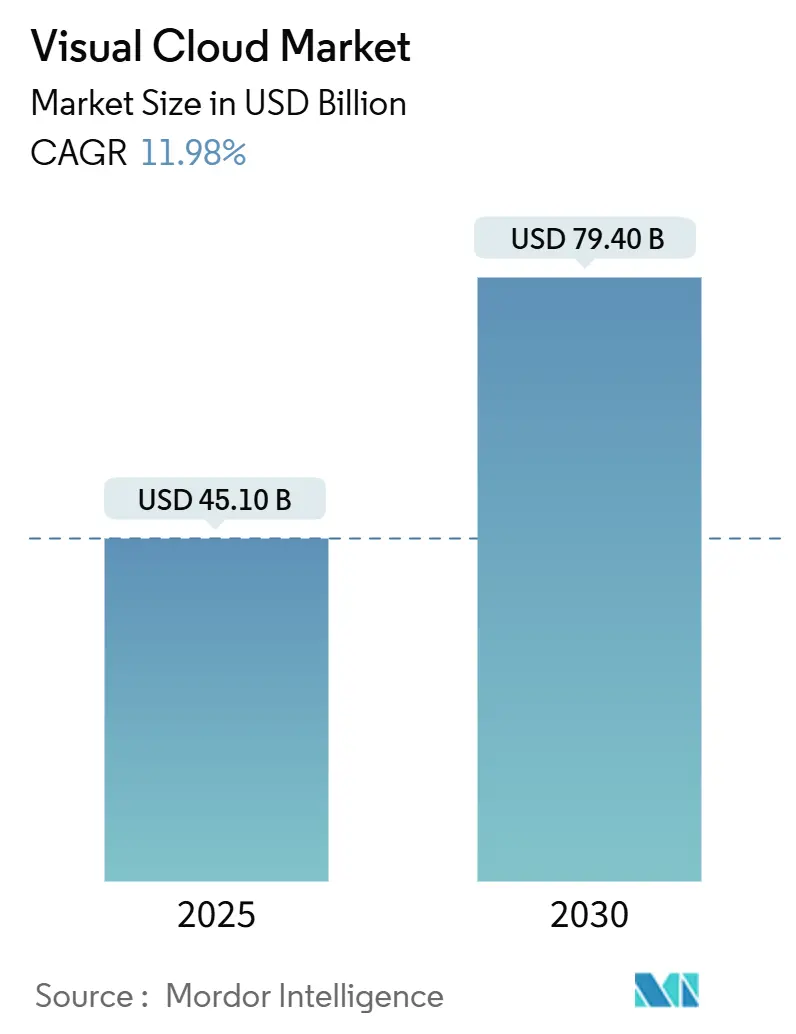
| Market Size (2025) | USD 45.10 Billion |
| Market Size (2030) | USD 79.40 Billion |
| Growth Rate (2025 - 2030) | 11.98% CAGR |
| Fastest Growing Market | Asia Pacific |
| Largest Market | North America |
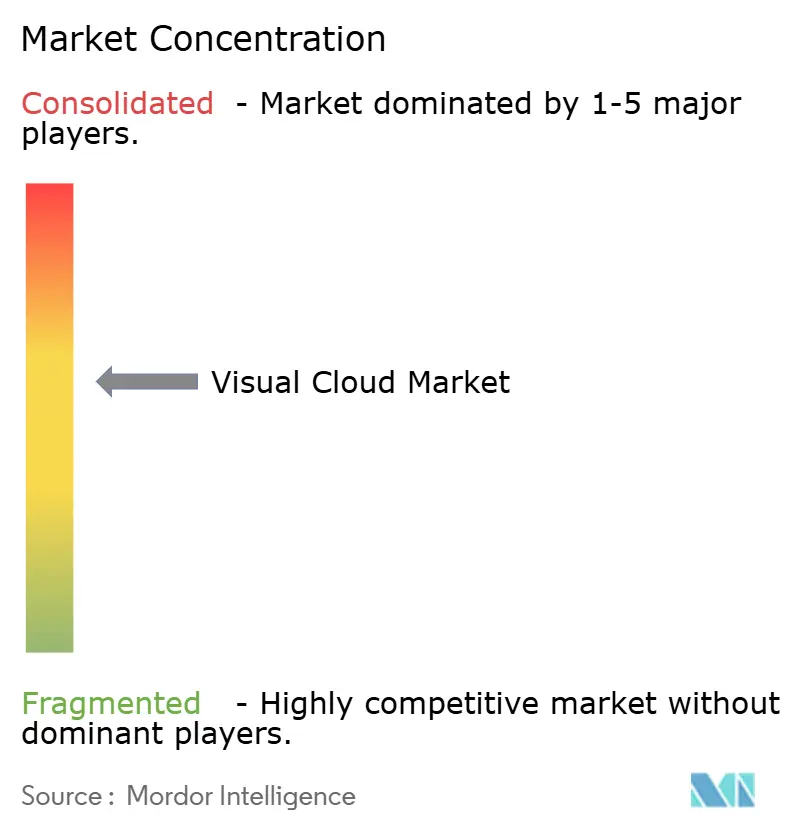
| Market Concentration | Medium |
Major Players *Disclaimer: Major Players sorted in no particular order Image © Mordor Intelligence. Reuse requires attribution under CC BY 4.0. | |
Visual Cloud Market Analysis by Mordor Intelligence
The Visual Cloud Market size is estimated at USD 45.10 billion in 2025, and is expected to reach USD 79.40 billion by 2030, at a CAGR of 11.98% during the forecast period (2025-2030).
Commercial roll-outs of 5G edge nodes shrink round-trip latency below 10 milliseconds, allowing real-time streaming, rendering and analytics. Enterprise demand for GPU-rich infrastructure escalates as AI models move from pilot to production, reinforcing the current dominance of Infrastructure as a Service. Cloud gaming subscriptions rise swiftly, creating a predictable revenue engine for providers while easing hardware costs for players. Meanwhile, video-centric social platforms, low-code orchestration tools and sustainability mandates all converge to pull GPU workloads into specialized clouds that process visual data closer to users. The visual cloud market now balances mature public cloud scale with nascent edge architectures that unlock new monetization routes for telecom operators and hyperscalers alike.
Key Report Takeaways
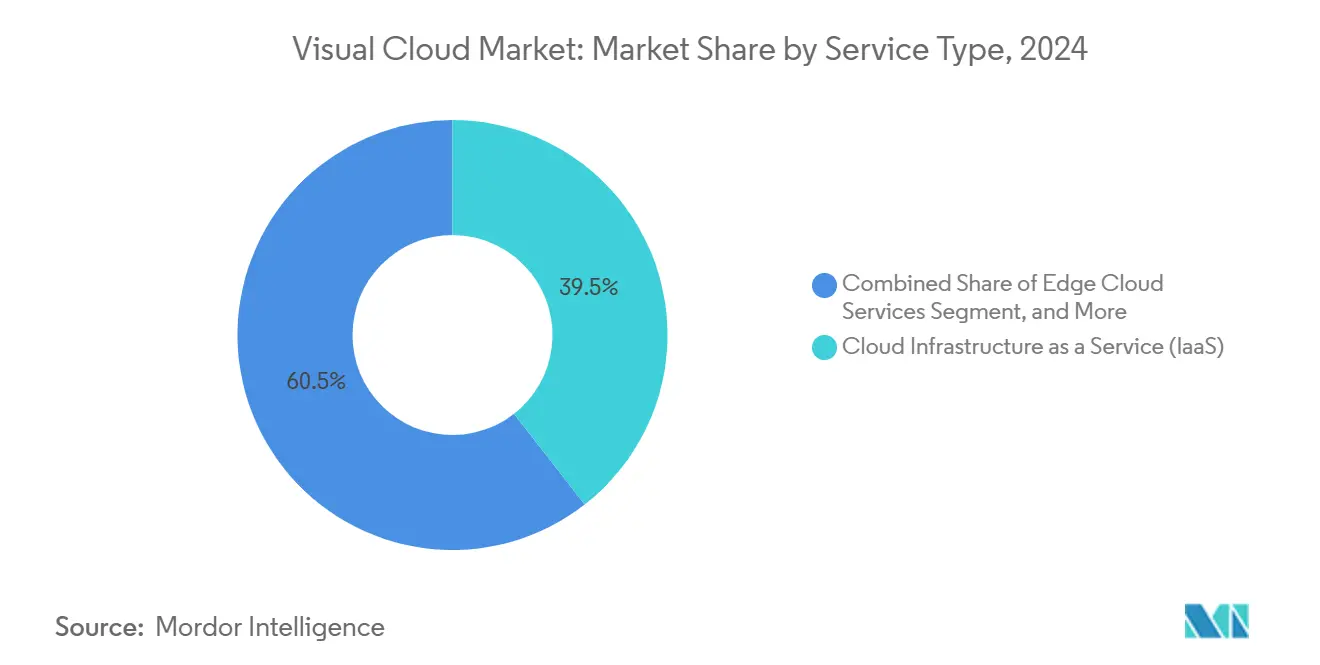
- By service type, IaaS led with a 39.45% revenue share in the Visual Cloud Market in 2024; Edge Cloud Services is projected to grow at a 12.22% CAGR through 2030.
- By workload, Media Streaming accounted for a 44.44% share of the Visual Cloud Market in 2024, while Cloud Gaming is projected to advance at a 13.65% CAGR through 2030.
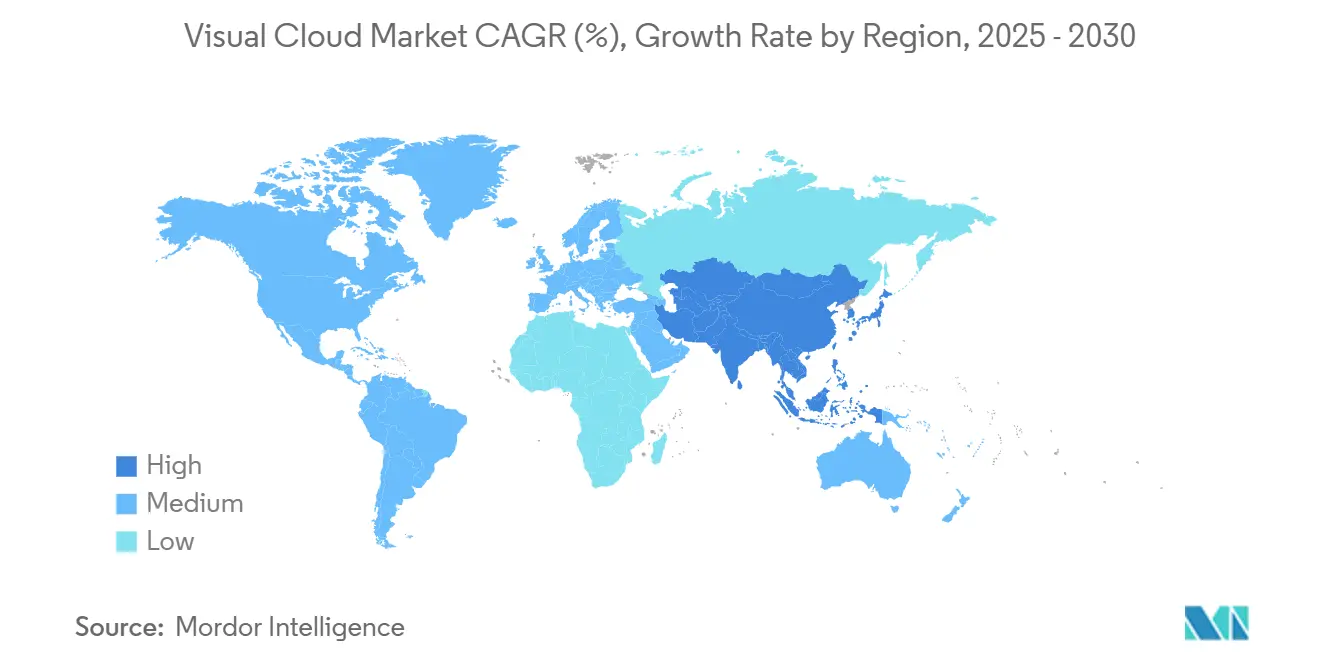
- By region, North America held 40.22% of the revenue in the Visual Cloud Market in 2024, but the Asia Pacific is poised for the fastest growth at a 12.72% CAGR through 2030.
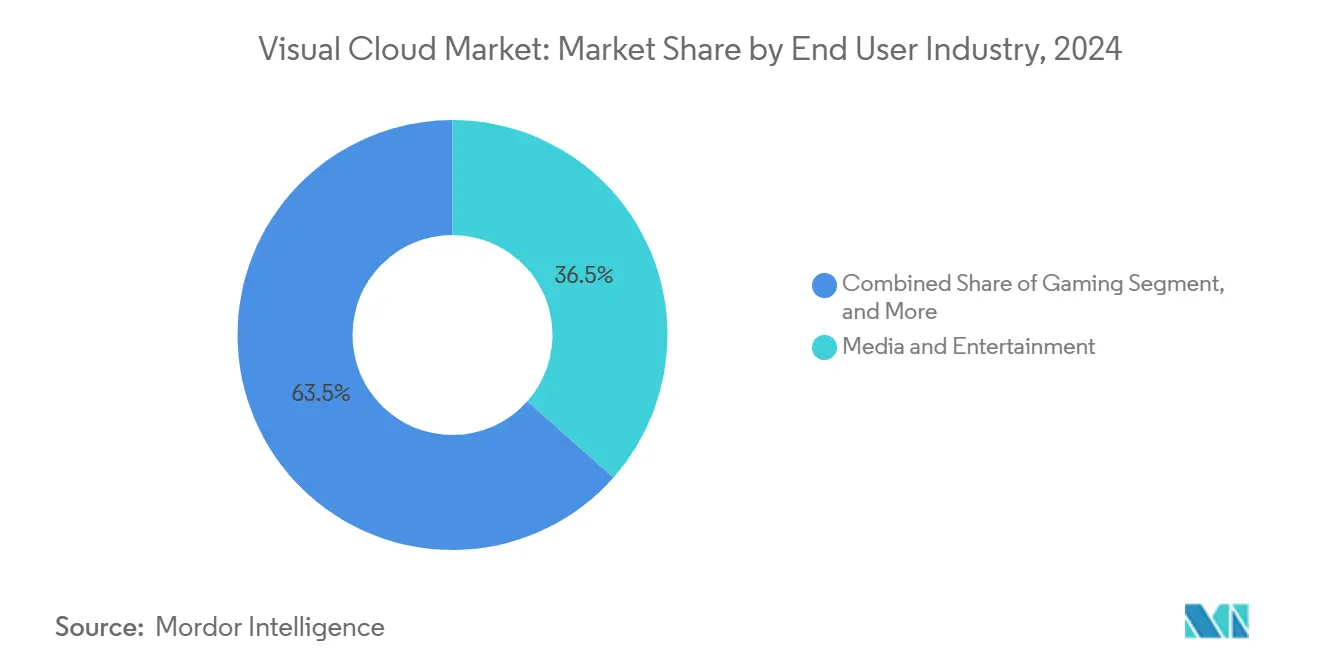
- By end-user industry, the Media and Entertainment sector captured a 36.54% share of the Visual Cloud Market in 2024; Gaming recorded the fastest expansion at a 14.22% CAGR over the same horizon, 2030.
- By deployment model, Public Cloud commanded a 66.11% share of the Visual Cloud Market in 2024; however, Hybrid Cloud is forecast to expand at a 13.88% CAGR through 2030.
Global Visual Cloud Market Trends and Insights
Drivers Impact Analysis*
| Driver | (~) % Impact on CAGR Forecast | Geographic Relevance | Impact Timeline |
|---|---|---|---|
| Accelerated Roll-Out of 5G Edge Nodes | +2.1% | Global, with early gains in North America, South Korea, China | Medium term (2-4 years) |
| Explosion of Video-Centric Social Media Platforms | +1.8% | Global, concentrated in North America, Europe, Asia Pacific | Short term (≤ 2 years) |
| Proliferation of AI-Enhanced Video Analytics for Retail | +1.5% | North America and EU, spill-over to APAC core markets | Medium term (2-4 years) |
| Rapid Adoption of Cloud Gaming Subscriptions | +2.3% | APAC core, North America, expanding to Europe and MEA | Long term (≥ 4 years) |
| Emergence of Low-Code Visual Workload Orchestration Tools | +1.2% | Global, with enterprise concentration in developed markets | Medium term (2-4 years) |
| Sustainable Data Center Initiatives Driving GPU Cloud Demand | +1.4% | Global, regulatory-driven in EU, voluntary adoption in North America | Long term (≥ 4 years) |
| Source: Mordor Intelligence | |||
Accelerated Roll-Out of 5G Edge Nodes
5G micro-edge locations position GPU resources within radio access networks, cutting transport latency to single-digit milliseconds. Verizon’s integration of NVIDIA EGX servers across 15 U.S. metros shows telecom operators evolving into fully-fledged visual cloud enablers[1]Verizon Communications, “5G Edge Computing Solutions,” verizon.com. Reduced backhaul costs further improve unit economics because high-resolution frames are pre-processed at the edge rather than traversing core networks. This architecture underpins latency-critical use cases from real-time AR overlays to cloud-rendered gaming, triggering higher GPU utilization and service upsell potential for carriers and hyperscalers.
Explosion of Video-Centric Social Media Platforms
Short-form and live-streaming formats dominate user engagement metrics, forcing platforms to scale real-time transcoding and AI-driven enhancement. AWS Elemental Media Services allow automatic bitrate, aspect-ratio and caption adjustments for billions of daily views. Creator economies thrive as low-barrier APIs let developers embed streaming features without owning encoders. As brands pivot marketing budgets toward video, advertisers demand instant analytics on view-through and sentiment, deepening dependence on specialized visual cloud pipelines.
Proliferation of AI-Enhanced Video Analytics for Retail
Retailers deploy computer-vision models to convert foot-traffic footage into actionable merchandising insights. Microsoft’s Azure Cognitive Services suite abstracts complex model development, letting store operators detect dwell times, shelf gaps and queue lengths through cloud-connected cameras. [2]Microsoft Corporation, “Azure Cognitive Services,” microsoft.comHybrid edge-plus-cloud topologies satisfy privacy statutes by keeping raw faces local while feeding metadata to regional clusters for aggregate modeling. Investment payback arises from shrinkage reduction and optimized labor scheduling, amplifying demand for dedicated inference GPUs.
Rapid Adoption of Cloud Gaming Subscriptions
China’s cloud gaming spend reached CNY 14.58 billion (USD 2.05 billion) in 2024 and monthly active users surpassed 50.9 million. Commercial bundles pairing 5G data with game passes lower acquisition friction and extend lifetime value. Console manufacturers now expose back catalogs through browser-based clients, broadening reach beyond proprietary hardware. The model’s success accelerates the visual cloud market because each 1080p stream consumes a dedicated GPU instance for the session duration, doubling revenue density versus video-on-demand traffic.
Restraints Impact Analysis*
| Restraint | (~) % Impact on CAGR Forecast | Geographic Relevance | Impact Timeline |
|---|---|---|---|
| Bandwidth Cost Sensitivity in Emerging Nations | -1.6% | Africa, Latin America, Southeast Asia, rural areas globally | Long term (≥ 4 years) |
| Fragmented Content Delivery Regulatory Environment | -1.2% | Global, with highest impact in EU, China, and cross-border operations | Medium term (2-4 years) |
| Limited AR/VR Consumer Hardware Penetration | -2.1% | Global, with higher impact in price-sensitive markets | Medium term (2-4 years) |
| Rising GPU Leasing Prices Due to AI Demand | -1.8% | Global, concentrated in North America, Europe, and developed APAC markets | Short term (≤ 2 years) |
| Source: Mordor Intelligence | |||
Bandwidth Cost Sensitivity in Emerging Nations
ITU surveys show fixed broadband prices still exceed 5% of monthly income across many African and Latin American states.[3]International Telecommunication Union, “Measuring Digital Development: Facts and Figures 2024,” itu.int High data tariffs deter long-form video and cloud gaming consumption, capping user volumes despite smartphone growth. For providers, average revenue per megabit falls below sustainable thresholds, slowing node deployments and under-cutting the visual cloud market’s total addressable audience.
Limited AR/VR Consumer Hardware Penetration
Premium headset pricing above USD 500 confines immersive content to early adopters. Meta’s continued Reality Labs losses and Apple Vision Pro’s USD 3,499 tag illustrate stubborn entry-level barriers. Without broader install bases, content studios hesitate to fund rich VR titles, which in turn tempers uptake of cloud-based rendering designed for those experiences. The result is a slower funnel for high-margin 8K stereoscopic workloads that would elevate GPU utilization rates.
*Our forecasts treat driver/restraint impacts as directional, not additive. The impact forecasts reflect baseline growth, mix effects, and variable interactions.
Segment Analysis
By Service Type: IaaS Dominates Amid GPU Demand
IaaS captured 39.45% of visual cloud market share in 2024, reflecting enterprises’ preference for direct control over GPU allocation and driver stacks. The segment benefits from usage-based billing that aligns with cyclical rendering jobs and bursty AI training cycles. Public catalogs such as AWS P5 or Google A3 instances offer H100-class accelerators in minutes, accelerating time-to-model and reinforcing IaaS primacy. Platform as a Service options gain momentum as DevOps teams offload container orchestration, yet many clients still start on raw IaaS to tune memory, encoder and network parameters.
Edge Cloud Services posts the fastest 12.22% CAGR through 2030 as video analytics, autonomous mobility and industrial inspection demand sub-20 millisecond response. Micro-data centers placed under cell towers or in retail back rooms offer GPU tiers sized for nearby population density, trimming opex tied to haulage and core switching. Smaller vendors like Vapor IO position neutral-host edge footprints that interconnect multiple networks, improving addressable scale. As compliance mandates push sensitive visual workloads toward sovereign zones, localized IaaS nodes will further expand visual cloud market penetration.


By Workload/Application: Cloud Gaming Gains Momentum
Media Streaming held 44.44% of revenue in 2024, underpinned by over-the-top video libraries and social live feeds. Transcoding pipelines ingest multi-codec inputs then fan out adaptive streams that track device and bandwidth conditions. Nevertheless, Cloud Gaming demonstrates a 13.65% CAGR to 2030, redirecting GPU cycles from passive decoding toward real-time frame synthesis. Each active player session triggers concurrent game instance rendering, scene compositing and video encoding at 60 frames per second, generating higher compute hours per user than streaming entertainment.
AR/VR delivery remains niche on the consumer side but shows steady uptake in B2B training, digital twin visualization and immersive collaboration. AI-based video analytics broadens beyond retail into smart cities and healthcare triage, leveraging scalable inference-as-a-service. Meanwhile, 3D rendering workloads migrate to pay-per-frame marketplaces, letting indie studios render cinematic sequences without buying workstations. These diverse use cases collectively push the visual cloud market toward multi-tenant platforms optimized for spectrum-aware streaming, hardware-level isolation and software-defined GPUs.
By End User Industry: Gaming Expansion Recasts Demand
Media and Entertainment retained a 36.54% revenue share in 2024 thanks to global subscription video, sports streaming and post-production pipelines. Yet Gaming posts the highest 14.22% CAGR out to 2030, reflecting the pivot from packaged console sales to services-as-a-subscription. Tencent’s cross-border cloud gaming roll-out offers console-grade performance on mid-range smartphones, proving service viability in bandwidth-dense Asia Pacific corridors. As game publishers sunset physical discs, they migrate dated titles to long-tail streaming packages, unlocking incremental royalties and consistent GPU bookings within the visual cloud market size for back-catalog content.
Healthcare adopts cloud-imaged diagnostics, surgical tele-mentoring and AI-aided pathology that leverages lossless video feeds. Regulatory parity between telemedicine and in-clinic consults normalizes reimbursement, accelerating volume. Education relies on scalable lecture capture, virtual labs and interactive whiteboards, consuming moderate yet sustained encoding capacity across the academic calendar. Industrial sectors deploy computer vision for predictive maintenance and safety compliance, diversifying the customer base and derisking demand cycles for visual cloud providers.
By Deployment Model: Hybrid Cloud Rises for Compliance
Public Cloud represented 66.11% of revenue in 2024, supported by unmatched global regions, multi-codec toolchains and integrated AI services. Many startups and media houses prefer public endpoints to avoid capex and staff specialization. However, Hybrid Cloud’s 13.88% CAGR through 2030 reflects rising data residency legislation and low-latency goals. Enterprises partition sensitive vision models to on-prem clusters while bursting heavy rendering to regional zones, meeting audit trails without sacrificing elasticity.
Private Cloud persists in capital-intensive verticals such as broadcast houses that demand guaranteed throughput and predictable egress pricing. Some governments mandate sovereign graphic processing for defense imagery, fostering domestic cloud build-outs. Over time, abstraction layers that unify container registries, IAM and telemetry across sites will make hybrid routing transparent, further embedding edge nodes into the broader visual cloud market fabric.
Geography Analysis
North America generated the largest visual cloud market size contribution with 40.22% revenue in 2024, driven by high 5G coverage, enterprise AI adoption and the presence of all three hyperscalers. Competitive leasing rates for H100 servers spur rapid experimentation among media studios and autonomous-vehicle developers. Regulatory clarity on data transfers sets a predictable environment that attracts venture funding into computer-vision startups.
Asia Pacific is the fastest-growing geography at a 12.72% CAGR to 2030. China’s cloud gaming revenues, at CNY 14.58 billion (USD 2.05 billion), prove payment willingness even amid hardware tariffs. India’s Digital India initiative incentivizes rural fiber build-outs, creating fresh audiences for regional language streaming and ed-tech videos. Japan, South Korea and Singapore lead ultra-dense 5G deployments that anchor edge data centers in metro cores, trimming round-trip latencies below 15 milliseconds.
Europe experiences measured growth as GDPR compliance steers multinational clouds toward local-zone builds and tailored consent management. The EU’s Climate Neutral Data Centre Pact pushes providers to adopt liquid cooling and low-carbon power, stimulating interest in GPU efficiency benchmarks. Middle East and Africa trail in adoption due to bandwidth affordability gaps but register pockets of momentum where civic smart-city projects demand city-wide camera analytics. Latin America follows a similar pattern, with Brazil and Mexico piloting cloud-rendered gaming packs bundled into mobile-operator data plans.

Competitive Landscape
Competition remains moderately concentrated. Amazon Web Services, Microsoft Azure and Google Cloud collectively control a significant share by pairing planet-scale regions with proprietary accelerators like Trn-x and XPU. They differentiate through integrated AI services, turnkey DRM pipelines and cross-layer billing. NVIDIA’s RTX Cloud, Cloudflare’s edge GPU network and DigitalOcean’s SME-focused droplets challenge incumbents by optimizing specifically for visual workloads and developer simplicity.
Edge partnerships intensify. Verizon and NVIDIA deliver metropolitan inference hubs for telco-grade SLAs, while Orange teams with Capgemini to release sovereign European GPU zones. Patent activity in scheduler algorithms, remote-direct-memory-access and adaptive bitrate telemetry reflects an IP race to squeeze more concurrent streams per GPU instance. Providers also bundle carbon reporting dashboards to win sustainability-minded customers in Europe and North America.
Price wars moderate as operators layer value-added managed services rather than cut raw compute rates. Migration toolkits, no-code media pipelines and turnkey content-delivery meshes lock customers into ecosystems. Growth adjacencies include licensing orchestration engines to broadcasters and offering managed pipelines for secure medical imaging under HIPAA and MDR frameworks. Emerging vendors that can balance regional compliance with low-latency edge performance stand to siphon workloads from monolithic hyperscalers, keeping the visual cloud market dynamic.
Visual Cloud Industry Leaders
Amazon Web Services, Inc.
Microsoft Corporation
Google LLC
Alibaba Group Holding Limited
NVIDIA Corporation
- *Disclaimer: Major Players sorted in no particular order

Recent Industry Developments
- October 2025: NVIDIA expanded Grace Hopper Superchip availability across major clouds, boosting AI-powered visual processing performance.
- September 2025: Microsoft partnered with Amazon to host Xbox Cloud Gaming on AWS edge locations, lowering gameplay latency worldwide.
- August 2025: Tencent Cloud launched its international gaming cloud in Southeast Asia, integrating local telco peering to cut data costs.
- July 2025: Verizon completed deployment of NVIDIA AI edge platforms in 15 U.S. metros for real-time autonomous vehicle processing.


Global Visual Cloud Market Report Scope
| Cloud Infrastructure as a Service (IaaS) |
| Platform as a Service (PaaS) |
| Software as a Service (SaaS) |
| Edge Cloud Services |
| Media Streaming |
| Cloud Gaming |
| AR/VR Content Delivery |
| AI-Based Video Analytics |
| 3D Rendering and Visualization |
| Media and Entertainment |
| Gaming |
| Retail and E-Commerce |
| Healthcare |
| Education |
| Manufacturing |
| Other End User Industry Industries |
| Public Cloud |
| Private Cloud |
| Hybrid Cloud |
| North America | United States |
| Canada | |
| Mexico | |
| South America | Brazil |
| Argentina | |
| Rest of South America | |
| Europe | United Kingdom |
| Germany | |
| France | |
| Italy | |
| Spain | |
| Russia | |
| Rest of Europe | |
| Asia Pacific | China |
| Japan | |
| India | |
| South Korea | |
| Australia and New Zealand | |
| Southeast Asia | |
| Rest of Asia Pacific | |
| Middle East | Saudi Arabia |
| United Arab Emirates | |
| Turkey | |
| Rest of Middle East | |
| Africa | South Africa |
| Nigeria | |
| Kenya | |
| Rest of Africa |
| By Service Type | Cloud Infrastructure as a Service (IaaS) | |
| Platform as a Service (PaaS) | ||
| Software as a Service (SaaS) | ||
| Edge Cloud Services | ||
| By Workload/Application | Media Streaming | |
| Cloud Gaming | ||
| AR/VR Content Delivery | ||
| AI-Based Video Analytics | ||
| 3D Rendering and Visualization | ||
| By End User Industry | Media and Entertainment | |
| Gaming | ||
| Retail and E-Commerce | ||
| Healthcare | ||
| Education | ||
| Manufacturing | ||
| Other End User Industry Industries | ||
| By Deployment Model | Public Cloud | |
| Private Cloud | ||
| Hybrid Cloud | ||
| By Geography | North America | United States |
| Canada | ||
| Mexico | ||
| South America | Brazil | |
| Argentina | ||
| Rest of South America | ||
| Europe | United Kingdom | |
| Germany | ||
| France | ||
| Italy | ||
| Spain | ||
| Russia | ||
| Rest of Europe | ||
| Asia Pacific | China | |
| Japan | ||
| India | ||
| South Korea | ||
| Australia and New Zealand | ||
| Southeast Asia | ||
| Rest of Asia Pacific | ||
| Middle East | Saudi Arabia | |
| United Arab Emirates | ||
| Turkey | ||
| Rest of Middle East | ||
| Africa | South Africa | |
| Nigeria | ||
| Kenya | ||
| Rest of Africa | ||


Key Questions Answered in the Report
How big is the visual cloud market in 2025 and what is its growth outlook?
The visual cloud market size is USD 45.1 billion in 2025 and is forecast to reach USD 79.4 billion by 2030 on an 11.98% CAGR.
Which service type currently leads spending on visual cloud solutions?
Infrastructure as a Service leads, holding 39.45% share in 2024 because enterprises value direct GPU control.
What workload is expanding fastest for cloud providers?
Cloud gaming streams are advancing at a 13.65% CAGR through 2030 due to 5G coverage and subscription models.
Which region is growing fastest for visual cloud adoption?
Asia Pacific shows a 12.72% CAGR to 2030, propelled by China’s cloud gaming boom and India’s fiber investments.
What factors restrain broader uptake of immersive visual services?
High bandwidth costs in emerging regions and limited consumer penetration of affordable AR/VR headsets slow growth.
Page last updated on:


