Hyperscale Computing Market Size and Share
Market Overview
| Study Period | 2019 - 2030 |
|---|---|
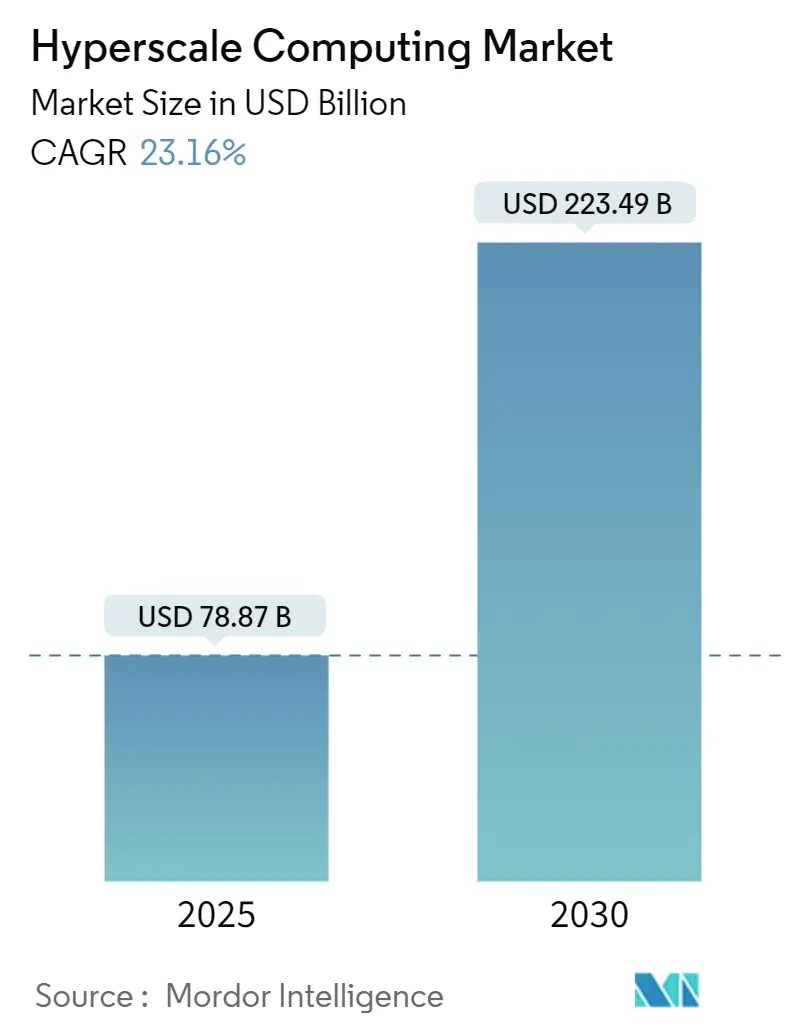
| Market Size (2025) | USD 78.87 Billion |
| Market Size (2030) | USD 223.49 Billion |
| Growth Rate (2025 - 2030) | 23.16% CAGR |
| Fastest Growing Market | Asia Pacific |
| Largest Market | North America |
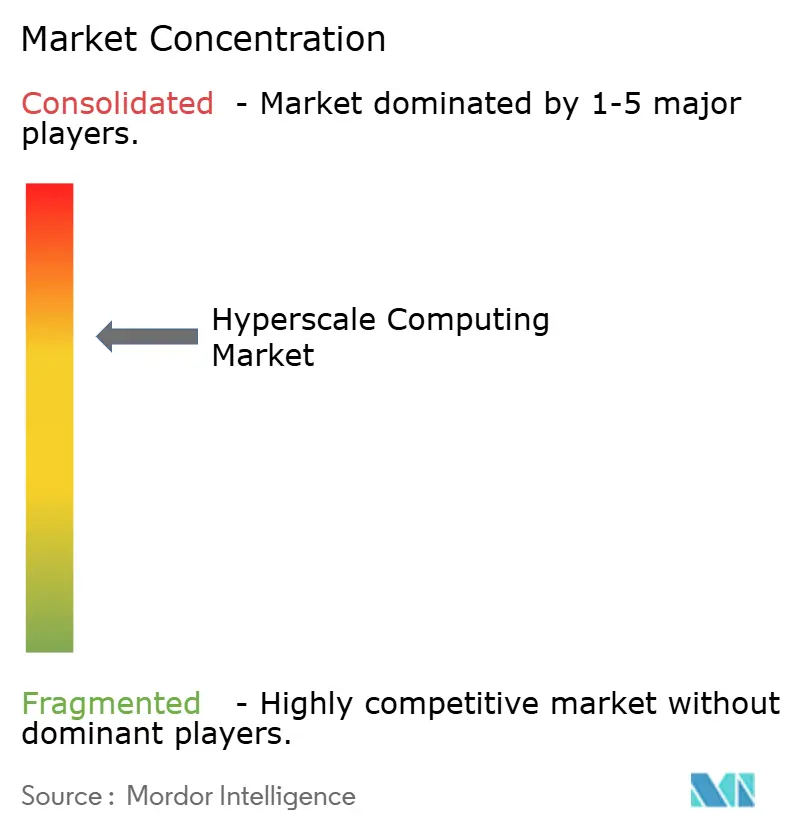
| Market Concentration | Medium |
Major Players *Disclaimer: Major Players sorted in no particular order Image © Mordor Intelligence. Reuse requires attribution under CC BY 4.0. | |
Hyperscale Computing Market Analysis by Mordor Intelligence
The hyperscale computing market size stood at USD 78.87 billion in 2025 and will climb to USD 223.49 billion by 2030, reflecting a 23.16% CAGR. Tight alignment between generative-AI workloads, sovereign-cloud regulations, and enterprise cloud-first mandates accelerates the shift from legacy server rooms to liquid-cooled, GPU-dense campuses capable of multi-gigawatt loads. Operators respond with vertically integrated build-outs that shorten supply chains, improve performance per watt, and lower total cost of ownership. Innovations such as chiplet-based processors, on-site renewables, and heat-reuse systems improve return on invested capital while strengthening sustainability credentials. At the same time, power-grid bottlenecks in Tier-1 metros and tightening water-use rules spur expansion into secondary markets and promote adoption of immersion and direct-to-chip cooling architectures.
Key Report Takeaways
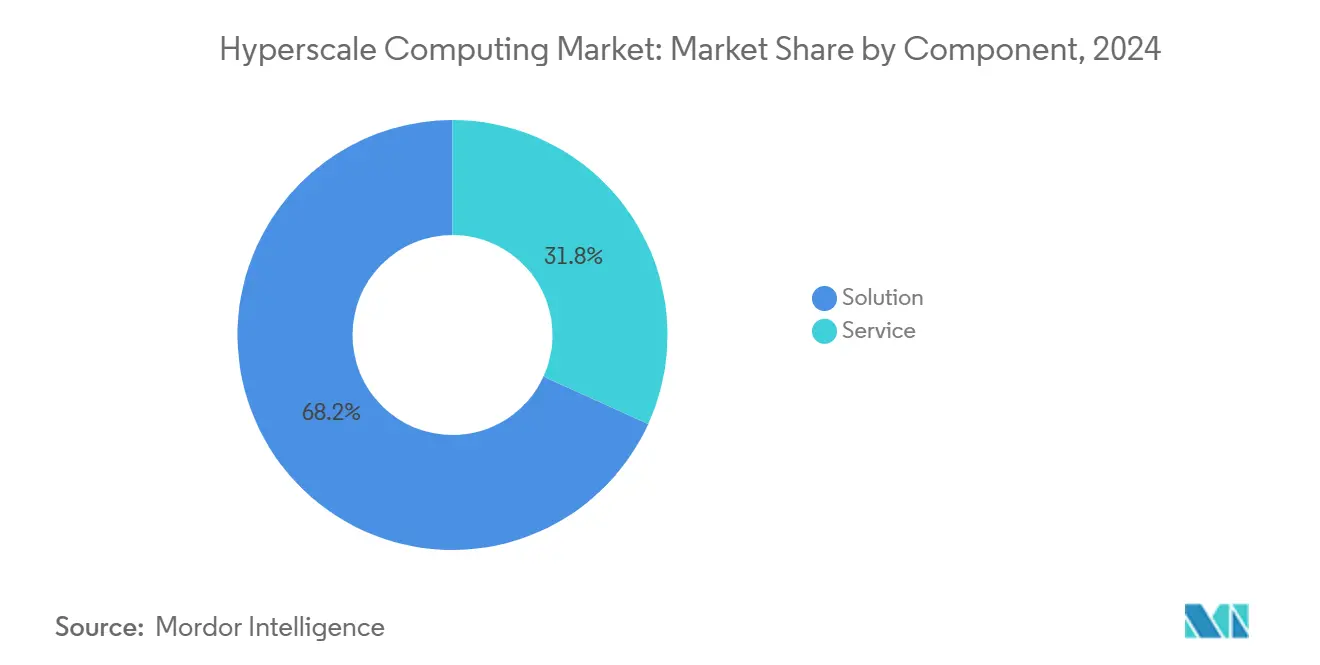
- By component, solutions commanded 68.21% of hyperscale computing market share in 2024, while services are advancing at a 24.11% CAGR through 2030.
- By enterprise size, large enterprises held 72.59% revenue share in 2024; SMEs are projected to surge at a 25.26% CAGR to 2030.
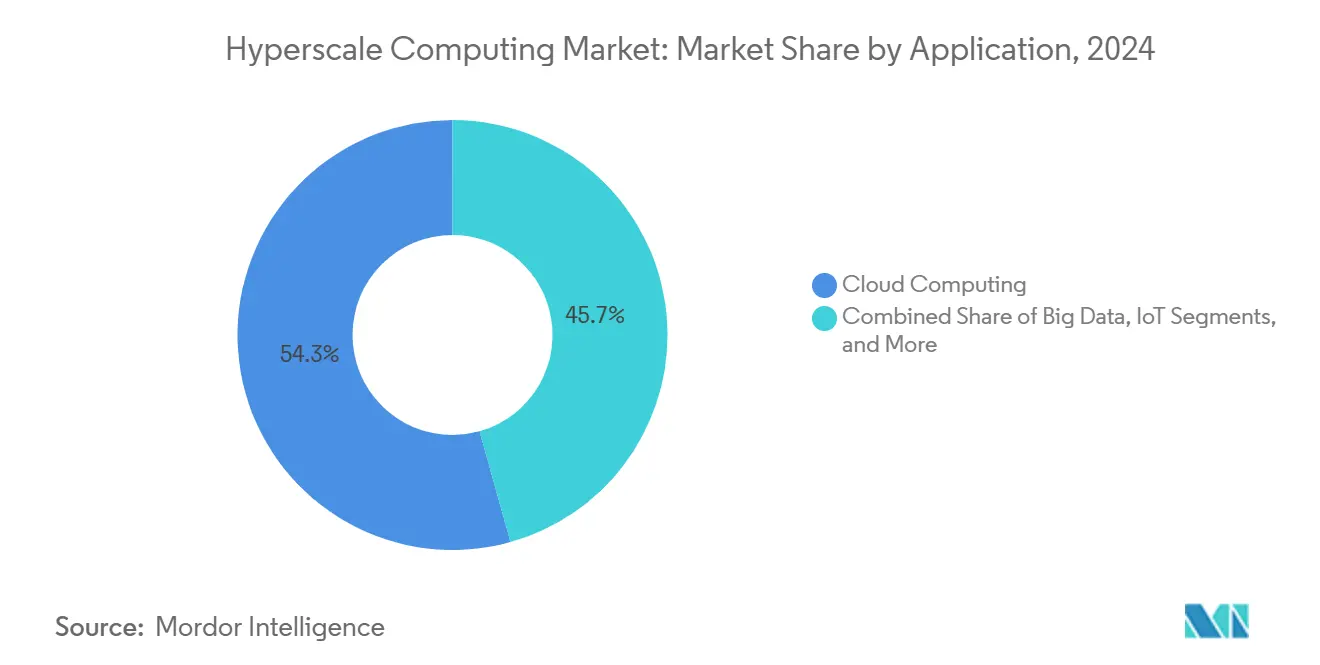
- By application, cloud computing accounted for 54.34% of deployments in 2024, whereas IoT infrastructure is set to expand at a 24.19% CAGR between 2025-2030.
- By end-user, IT and telecommunications led with 28.63% share in 2024; healthcare is forecast to progress at a 23.64% CAGR through 2030.
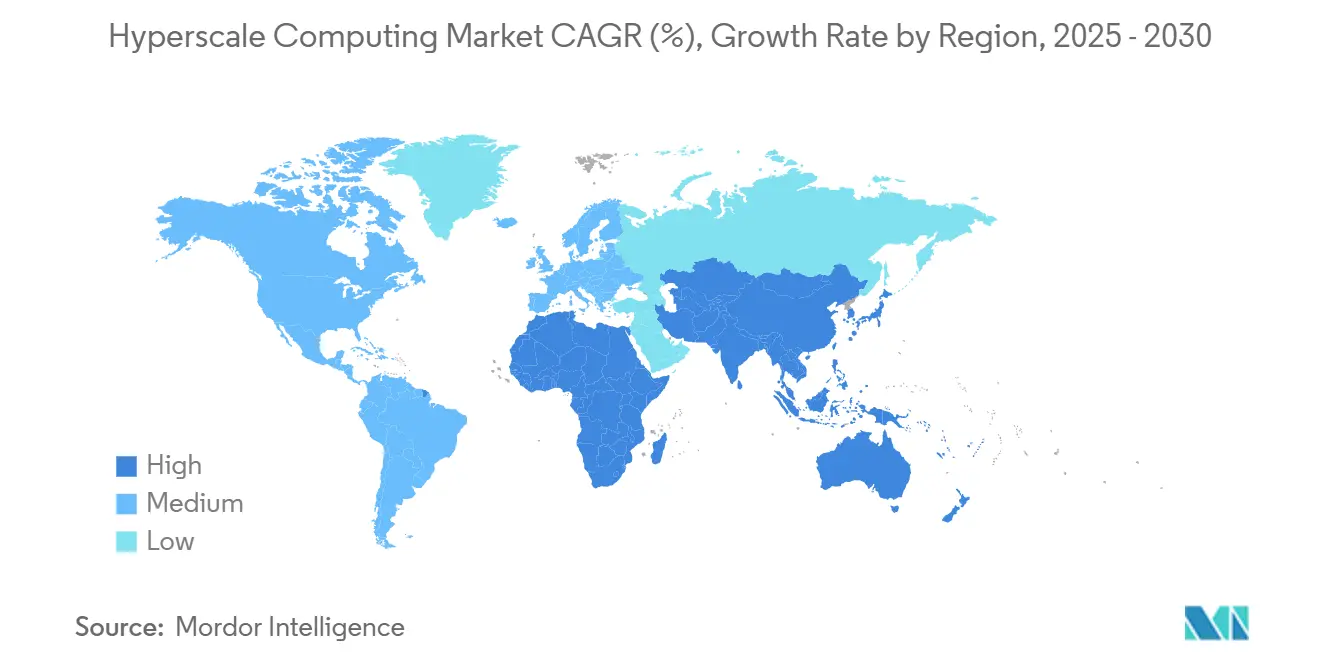
- By geography, North America retained 41.59% share in 2024, but Asia-Pacific is anticipated to post the fastest 23.86% CAGR through 2030.
Global Hyperscale Computing Market Trends and Insights
Drivers Impact Analysis*
| Driver | (~) % Impact on CAGR Forecast | Geographic Relevance | Impact Timeline |
|---|---|---|---|
| Cloud-first digital transformation | +4.2% | Global; highest in Asia-Pacific emerging markets | Medium term (2-4 years) |
| Explosive GPU demand for generative-AI workloads | +5.8% | North America and EU core; spreading to Asia-Pacific | Short term (≤2 years) |
| Shift to HPC-as-a-Service | +3.1% | Worldwide; SME focus in developed markets | Medium term (2-4 years) |
| Sovereign-cloud mandates | +2.9% | Asia-Pacific core; Middle East; Africa spillover | Long term (≥4 years) |
| On-site renewables and heat reuse | +1.8% | Nordic lead; North America secondary metros | Long term (≥4 years) |
| Chiplet-based server architectures | +2.2% | Global; anchored in advanced manufacturing hubs | Medium term (2-4 years) |
| Source: Mordor Intelligence | |||
Explosive GPU Demand for Generative-AI Workloads
The sudden scale-out of model training infrastructure exemplified by xAI’s leap from 100,000 to more than 1 million GPUs in months forces operators to redesign campuses around high-density racks, optical interconnects, and liquid cooling loops. Purpose-built AI clusters such as Meta’s Cerebras deployment deliver 18-fold faster inference, underscoring the performance upside of specialization. [1]Cerebras Systems, “Meta Collaborates with Cerebras for Accelerated Inference,” cerebras.aiFunding velocity is equally striking: Oracle’s 4.5-gigawatt leasing pact with OpenAI anchors the largest single compute reservation on record. These dynamics compress project timelines and elevate the hyperscale computing market as enterprises rush to secure hard-to-find GPU capacity.
Cloud-First Digital Transformation
Post-pandemic operating models push even risk-averse industries toward cloud-native stacks, replacing step-function capital outlays with elastic, OPEX-friendly consumption. Corporate boards treat hyperscale availability zones as the backbone for zero-downtime customer experiences, data-driven decision making, and rapid software iteration. Vertical integration by leading providers reduces deployment complexity, encouraging late adopters to migrate mission-critical workloads. This secular momentum sustains double-digit growth well into the forecast period.
Shift to HPC-as-a-Service
Enterprises historically constrained by capital expenditure now consume supercomputing capacity on demand, aided by simplified interfaces and workload-specific service catalogs. Programs such as the European SHAPE initiative lower technical barriers for SMEs, while edge platforms place Teraflop compute next to sensors and assembly lines. The result is a widening addressable base for the hyperscale computing market, with subscription contracts creating durable, multi-year revenue streams for providers.
Sovereign-Cloud Mandates
Regulators enshrine domestic data localization, spurring national champions and joint ventures. Saudi Arabia’s Vision 2030 partnership linking Aramco, Microsoft, and Armada inaugurates the first industrial distributed cloud, delivering sub-five-millisecond latency across energy facilities. [2]Armada, “Aramco, Microsoft, Armada Announce Industrial Distributed Cloud,” armada.aiSupermicro’s USD 20 billion alliance with DataVolt illustrates how hardware suppliers capture upside from enforced regional build-outs.
Restraints Impact Analysis*
| Restraint | (~) % Impact on CAGR Forecast | Geographic Relevance | Impact Timeline |
|---|---|---|---|
| Multi-gigawatt power-grid bottlenecks | -2.1% | North America metros; European financial centers | Short term (≤2 years) |
| Escalating water-consumption regulations | -1.4% | Water-stressed regions; Western United States | Medium term (2-4 years) |
| Rising land costs in secondary metros | -0.8% | Secondary markets in developed economies | Medium term (2-4 years) |
| Scope-3 supply-chain CO₂ disclosure pressure | -0.9% | EU entities; global multinationals | Long term (≥4 years) |
| Source: Mordor Intelligence | |||
Multi-Gigawatt Power-Grid Bottlenecks
Local utilities struggle to dedicate sustained 200-300 MW feeds for single campuses, delaying permits and inflating interconnection fees. Minnesota’s “mega-center” proposal would draw power equal to all statewide households, spotlighting the scale gap between digital demand and grid readiness. Operators reply by choosing energy-rich regions such as the Dakotas and by piloting small-modular nuclear reactors through alliances like TerraPower-Sabey, expected online by 2030. [3]TerraPower, “Natrium Reactor Collaboration with Sabey Data Centers,” terrapower.com
Escalating Water-Consumption Regulations
AI-class liquid cooling can consume 3–5 times more water than legacy air systems. Regions such as the American Southwest impose stringent usage caps, compelling providers to adopt closed-loop or refrigerant-based alternatives. Microsoft has pledged “zero-water” data centers by 2026, signaling an industry pivot toward recycling and heat-recovery designs.
*Our forecasts treat driver/restraint impacts as directional, not additive. The impact forecasts reflect baseline growth, mix effects, and variable interactions.
Segment Analysis
By Component: Solutions Lead Infrastructure Buildout
The solutions segment captured 68.21% of overall 2024 revenue as operators channeled bulk capital into servers, high-bandwidth networking, and solid-state storage optimized for AI training clusters. Such dominance reflects the up-front equipment intensity of hyperscale campuses, where a single building can house USD 2-3 billion in hardware. Providers increasingly specify GPU trays with integrated cold-plate loops and optical transceivers to shrink latency and boost rack density. Meanwhile, services revenue accelerates because enterprises require managed DevOps, observability, and regulatory-compliance overlays to unlock the full value of raw compute capacity.
Momentum shifts as professional services teams design application-specific pipelines for federated learning, real-time fraud analytics, and genomic workflows. These engagements sustain a 24.11% CAGR for services, outpacing hardware growth even though the absolute dollar base remains smaller. The combination of turnkey racks and lifecycle management creates stickiness, raising switching costs and underpinning multi-year consumption commitments. CoreWeave’s USD 10 billion absorption of Core Scientific exemplifies why vertical integration can remove leasing overhead and harvest USD 500 million in annual savings by 2027.


By Enterprise Size: SMEs Drive Service Adoption
Large enterprises accounted for 72.59% of 2024 outlays thanks to entrenched IT budgets, global footprints, and complex hybrid-cloud estates that demand petascale throughput. They deploy dedicated zones for latency-sensitive workloads such as algorithmic trading and immersive media streaming. Yet SMEs, lifted by pay-as-you-go HPC services, represent the hyperscale computing market’s fastest-rising cohort at a 25.26% CAGR. The OECD cites cloud democratization as essential for industrial competitiveness, with manufacturers adopting edge-based vision AI to catch defects in real time.
Service providers package industry-specific blueprints that hide orchestration complexity behind graphical portals, letting a biotech startup run 10,000-node molecular simulations without an in-house cluster. As a result, SME contracts may start small but exhibit steep annual expansion rates once proof-of-concept results validate ROI. Large enterprises, by contrast, fine-tune workload placement among on-prem, colocation, and hyperscale venues to balance data gravity, governance, and latency.
By Application: IoT Infrastructure Accelerates Edge Deployment
Cloud computing retained 54.34% share in 2024 as web services, SaaS back-ends, and data-lake analytics continued to anchor demand. Still, IoT infrastructure registers the highest 24.19% CAGR because 41.6 billion connected devices oblige operators to site compute closer to endpoints. Smart-factory rollouts place micro-data-centers at line-side to support machine-vision QA loops under 5 milliseconds, while 5G network slicing enables low-latency vehicular communication.
Hyperscale architects respond with modular, 800 kW edge nodes equipped with GPU-enabled inference cards and ruggedized liquid cooling. Hierarchical control planes federate these nodes with regional hubs, allowing policy-driven workload migration based on cost, carbon intensity, or demand spikes. The interplay between centralized analytics and distributed inference unlocks new revenue for hyperscale operators and compresses innovation cycles for industrial, retail, and public-safety users.

By End-User: Healthcare Leads AI-Driven Growth
IT and telecommunications generated the largest demand slice at 28.63% in 2024, reflecting hyperscale services’ critical role in streaming, gaming, and mobile-app back-ends. However, healthcare presents the steepest 23.64% CAGR as AI-based diagnostic imaging, multimodal electronic records, and population genomics push compute requirements skyward. NYU Langone already funnels terabytes of genomic data daily into cloud-based accelerators to support precision oncology, while Corti deploys sovereign clinician-assistant models across European hospital networks.
Financial-services firms adopt inferencing clusters to accelerate credit-risk scoring and anti-money-laundering analytics, whereas retailers combine computer-vision shelf tracking with real-time promotions delivered via edge servers. Each vertical’s nuanced compliance envelope-HIPAA, PCI-DSS, GDPR-creates consulting and managed-security adjacencies for service providers, reinforcing multi-layer revenue capture within the hyperscale computing market.
Geography Analysis
North America maintained 41.59% share in 2024, supported by deep capital markets, robust fiber backbones, and state-level incentives that offset escalating utility constraints. AWS’s USD 11 billion Georgia build, Microsoft’s USD 80 billion global data-center allocation more than half earmarked for U.S. campuses and Meta’s USD 65 billion Prometheus megaproject illustrate the investment cadence. Yet transmission-line congestion in Northern Virginia and Silicon Valley pushes new capacity toward renewable-rich locales like North and South Dakota, aided by federal initiatives opening public land for clean-energy data centers.
Asia-Pacific shows the fastest 23.86% CAGR, propelled by sovereign-cloud edicts, manufacturing digitization, and rising AI adoption across Japan, South Korea, and Southeast Asia. AWS pledged USD 15 billion for Japanese facilities, while Oracle confirmed an USD 8 billion Tokyo region expansion to serve regulated workloads. In China, Alibaba earmarked USD 53 billion for domestic infrastructure despite export-control headwinds, reinforcing intraregional competition. Emerging economies capitalize on green-field build-outs to leapfrog legacy IT and foster local talent ecosystems.
Europe, the Middle East, and Africa (EMEA) present mixed dynamics. Western European states tighten environmental rules Germany now requires heat-reuse feasibility studies for new data centers moderating capacity additions but stimulating innovation in waste-heat district heating. Gulf Cooperation Council members deploy sovereign-wealth capital to create AI-first campuses, as exemplified by Supermicro-DataVolt’s direct-liquid-cooled facility pipeline in Saudi Arabia. Sub-Saharan Africa remains nascent yet poised for rapid uptake once subsea cable landings and stable power supplies converge.

Competitive Landscape
Market concentration edges higher as the top four U.S. cloud providers are poised to command 50% of global data-center capital spending by 2026, leveraging proprietary silicon, custom interconnects, and massive purchasing power. Strategic deals highlight an AI-centric arms race: AMD’s USD 4.9 billion takeover of ZT Systems secures a direct lane into rack-level design for GPU-heavy nodes. IBM’s HashiCorp purchase folds multicloud automation into its portfolio, while SoftBank’s USD 6.5 billion Ampere Computing acquisition bets on ARM-based efficiency.
Disruptors concentrate on niche performance or geographic gaps. CoreWeave’s post-merger 1.3 GW footprint gives it bargaining clout in GPU procurement and power contracts, positioning the firm as a specialized alternative for AI-native workloads. Nscale raises blended debt-equity rounds to fund campus builds in Asia, courting ByteDance-scale tenants. Patent filings surge around chiplet packaging, liquid-to-air heat exchangers, and near-memory compute, indicating where engineering talent and capital coalesce.
Sustainability credentials emerge as a competitive lever. Operators publish hourly carbon-intensity dashboards and sign 24×7 renewable power purchase agreements. Some, like Google, experiment with geothermal pilots, while Microsoft targets water-positive operations by 2030. Edge micro-grid integration and district heating of adjacent real-estate projects further differentiate providers and mitigate regulatory risk.
Hyperscale Computing Industry Leaders
Amazon Web Services, Inc.
Microsoft Corporation
Alphabet Inc. (Google Cloud)
Alibaba Group Holding Limited (Alibaba Cloud)
International Business Machines Corporation
- *Disclaimer: Major Players sorted in no particular order

Recent Industry Developments
- July 2025: Acumera bought Scale Computing to deepen edge-computing capabilities across distributed enterprise sites.
- May 2025: Nutanix and Pure Storage formed a strategic alliance to deliver integrated stack solutions for mission-critical deployments.
- January 2025: STACK Infrastructure launched a 1 GW campus in Northern Virginia, expanding presence in the world’s largest cloud corridor.
- January 2025: Compass Datacenters pledged USD 10 billion for a Mississippi campus, underscoring momentum in secondary markets.


Global Hyperscale Computing Market Report Scope
| Solution |
| Service |
| Large Enterprises |
| Small and Medium Enterprises (SMEs) |
| Cloud Computing |
| Big Data |
| IoT |
| Other Application |
| Banking, Financial Services and Insurance (BFSI) |
| Information Technology and Telecommunications |
| Media and Entertainment |
| Retail and E-commerce |
| Healthcare |
| Other End-User |
| North America | United States | |
| Canada | ||
| Mexico | ||
| South America | Brazil | |
| Argentina | ||
| Rest of South America | ||
| Europe | Germany | |
| United Kingdom | ||
| France | ||
| Russia | ||
| Rest of Europe | ||
| Asia-Pacific | China | |
| Japan | ||
| India | ||
| South Korea | ||
| Australia | ||
| Rest of Asia-Pacific | ||
| Middle East and Africa | Middle East | Saudi Arabia |
| United Arab Emirates | ||
| Rest of Middle East | ||
| Africa | South Africa | |
| Egypt | ||
| Rest of Africa | ||
| By Component | Solution | ||
| Service | |||
| By Enterprise Size | Large Enterprises | ||
| Small and Medium Enterprises (SMEs) | |||
| By Application | Cloud Computing | ||
| Big Data | |||
| IoT | |||
| Other Application | |||
| By End-User | Banking, Financial Services and Insurance (BFSI) | ||
| Information Technology and Telecommunications | |||
| Media and Entertainment | |||
| Retail and E-commerce | |||
| Healthcare | |||
| Other End-User | |||
| By Geography | North America | United States | |
| Canada | |||
| Mexico | |||
| South America | Brazil | ||
| Argentina | |||
| Rest of South America | |||
| Europe | Germany | ||
| United Kingdom | |||
| France | |||
| Russia | |||
| Rest of Europe | |||
| Asia-Pacific | China | ||
| Japan | |||
| India | |||
| South Korea | |||
| Australia | |||
| Rest of Asia-Pacific | |||
| Middle East and Africa | Middle East | Saudi Arabia | |
| United Arab Emirates | |||
| Rest of Middle East | |||
| Africa | South Africa | ||
| Egypt | |||
| Rest of Africa | |||


Key Questions Answered in the Report
What is the projected revenue value for hyperscale computing in 2030?
The hyperscale computing market is expected to reach USD 223.49 billion by 2030.
Which component category is expanding fastest?
Services are growing at a 24.11% CAGR as enterprises seek managed solutions and cloud-native development support.
Why are SMEs adopting hyperscale resources quickly?
Pay-as-you-go HPC eliminates large capital outlays, letting smaller firms access supercomputing for AI, simulation, and analytics.
Which geographic region exhibits the highest growth rate through 2030?
Asia-Pacific leads with a forecast 23.86% CAGR, driven by sovereign-cloud mandates and manufacturing digitization.
What major constraint limits new campuses in Tier-1 metros?
Power-grid bottlenecks make it difficult to secure multi-hundred-megawatt connections, pushing projects to secondary markets.
How are operators mitigating water-use concerns?
Providers adopt closed-loop and immersion cooling and commit to “zero-water” or water-positive design targets.
Page last updated on:


