Virtual Machine Market Size and Share
Market Overview
| Study Period | 2019 - 2030 |
|---|---|
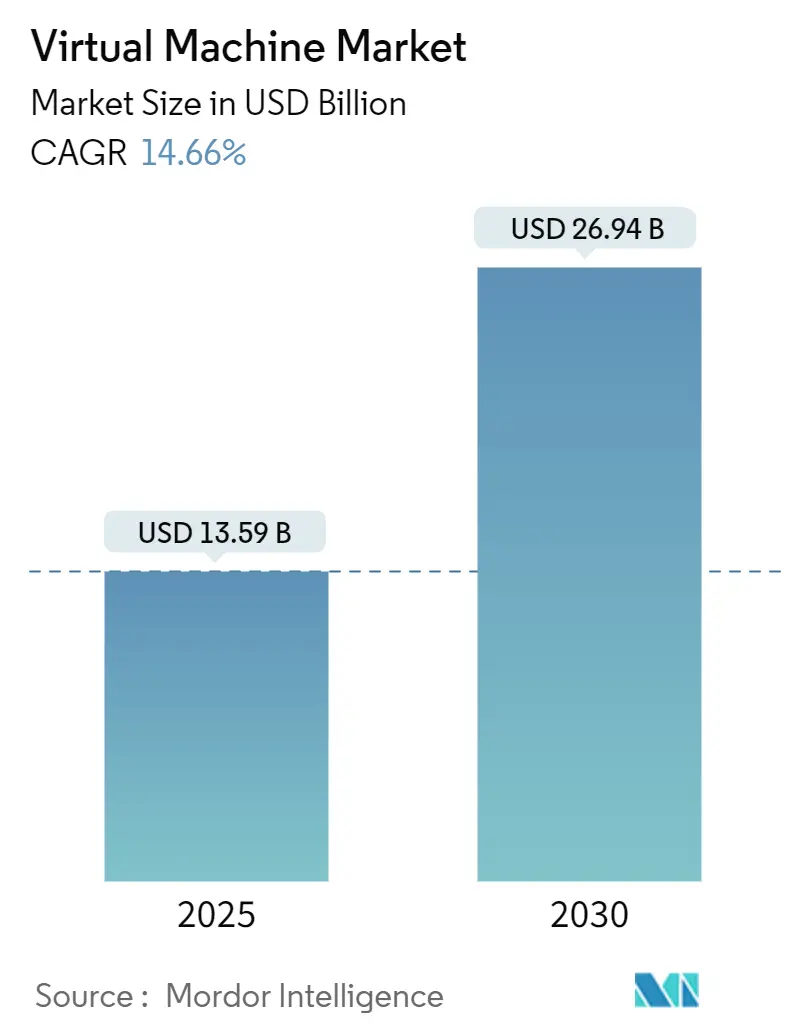
| Market Size (2025) | USD 13.59 Billion |
| Market Size (2030) | USD 26.94 Billion |
| Growth Rate (2025 - 2030) | 14.66% CAGR |
| Fastest Growing Market | Asia Pacific |
| Largest Market | North America |
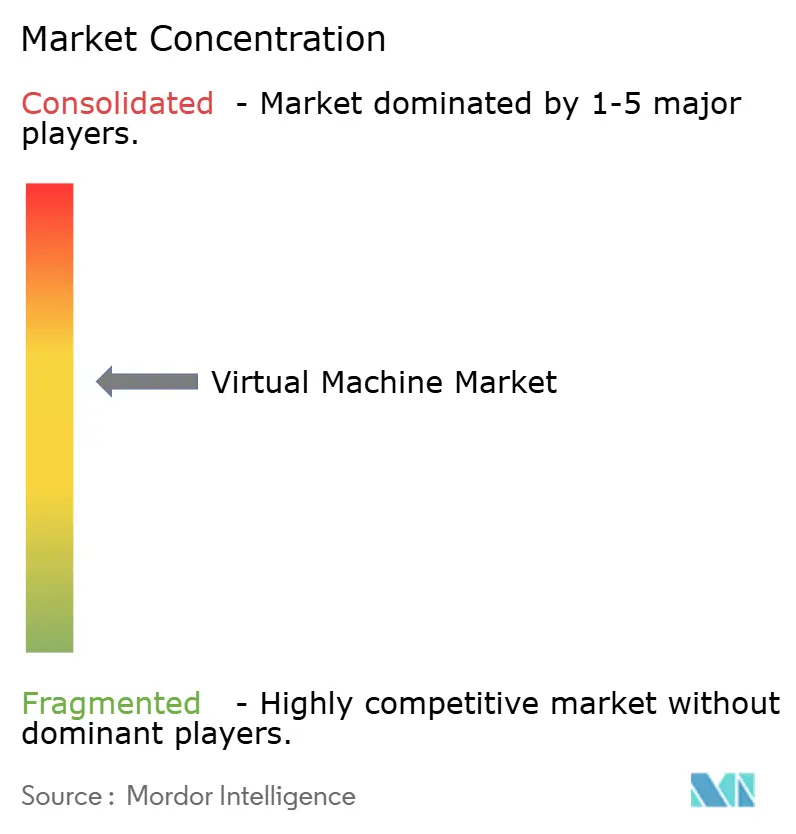
| Market Concentration | Medium |
Major Players *Disclaimer: Major Players sorted in no particular order Image © Mordor Intelligence. Reuse requires attribution under CC BY 4.0. | |
Virtual Machine Market Analysis by Mordor Intelligence
The virtual machine market size stands at USD 13.59 billion in 2025 and is projected to reach USD 26.94 billion by 2030, advancing at a 14.66% CAGR. Persistent digital-transformation programs, workload‐specific artificial-intelligence (AI) optimization, and widespread adoption of hybrid-cloud blueprints continue to propel the virtual machine market. Enterprises focus on boosting infrastructure efficiency while sustaining operational flexibility, which reinforces demand for AI-ready hypervisors, cloud-integrated virtualization stacks, and edge-capable lightweight virtual machines. Broadcom’s integration of VMware has intensified cost-control scrutiny, prompting many organizations to consolidate host footprints, increase VM density, and evaluate open-source hypervisors. Simultaneously, container-VM convergence reduces operational complexity, encouraging financial-services, healthcare, and manufacturing firms to adopt multi-runtime hybrid platforms that combine legacy virtual machines with cloud-native microservices. Heightened sustainability targets inside North American and European data centers also increase appetite for density-optimized VM images that reduce power draw and cooling requirements.
Key Report Takeaways
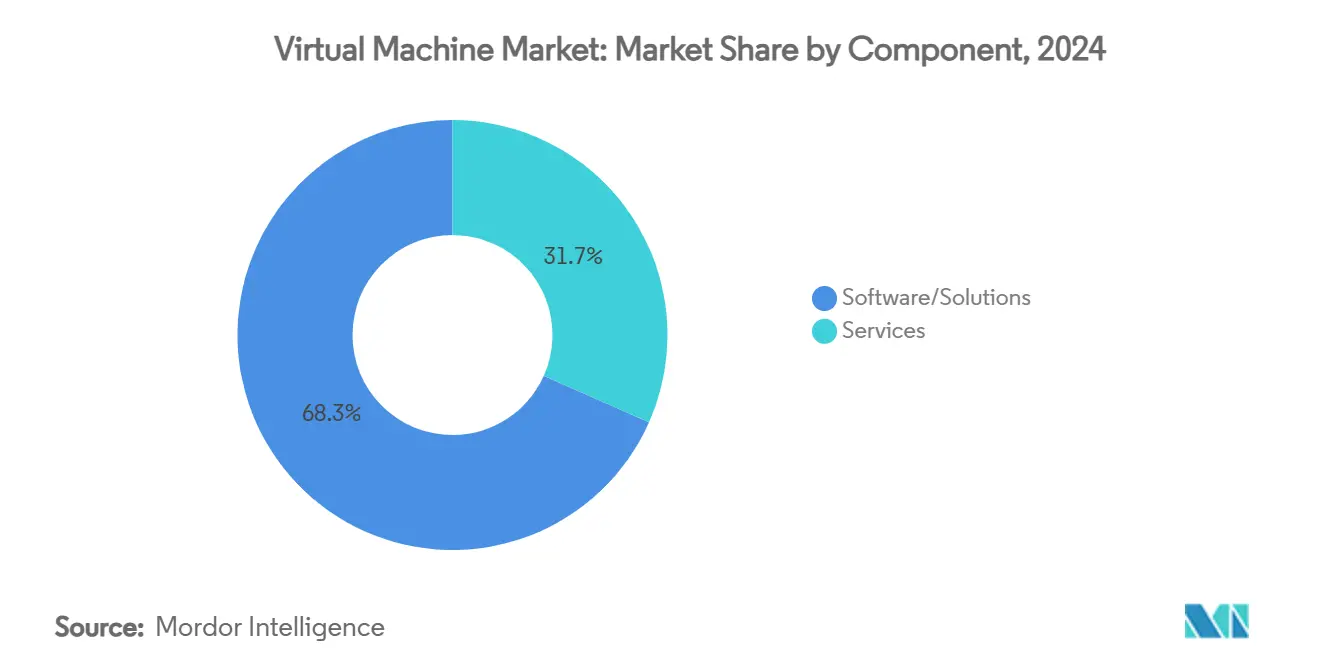
- By component, Software/Solutions led with 68.34% of virtual machine market share in 2024, whereas Services advance at a 14.68% CAGR through 2030.
- By deployment type, on-premise retained 55.41% revenue share in 2024, while cloud deployment models expand at a 14.86% CAGR to 2030.
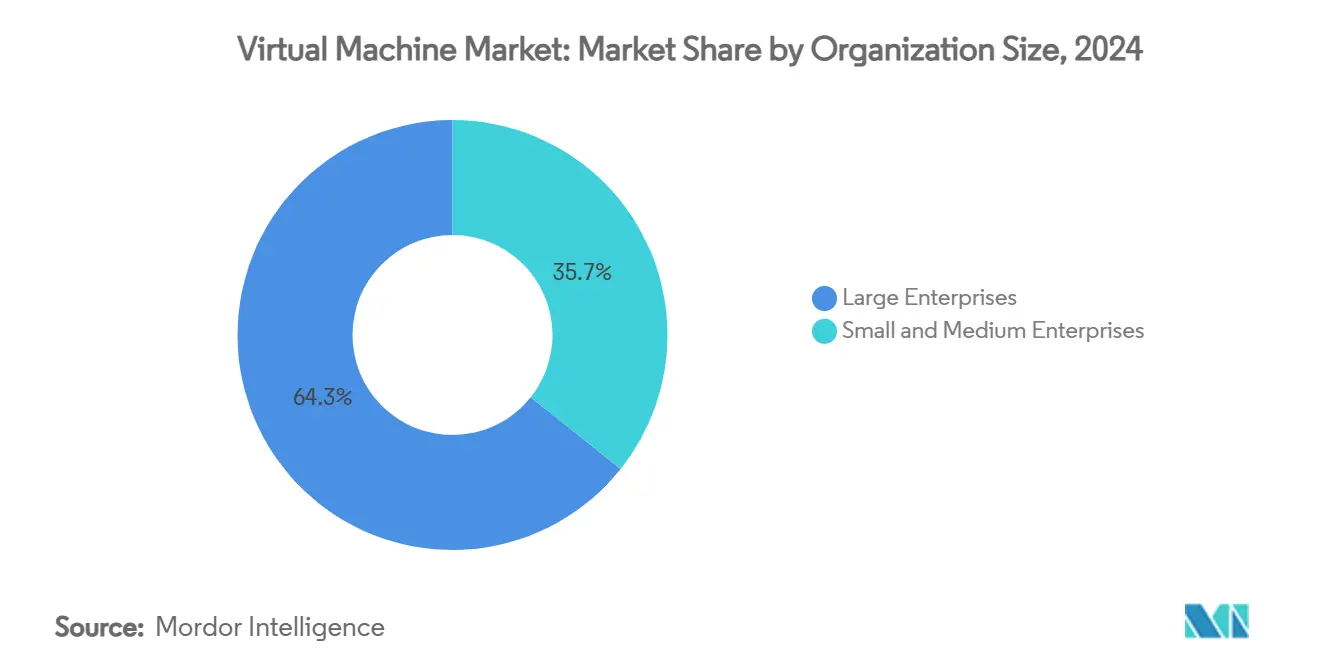
- By organization size, large enterprises controlled 64.29% of the virtual machine market in 2024; small and medium enterprises record the fastest 14.89% CAGR over the forecast period.
- By end-user industry, IT and Telecommunications captured 38.73% share in 2024; healthcare and life sciences accelerate at a 14.93% CAGR to 2030.
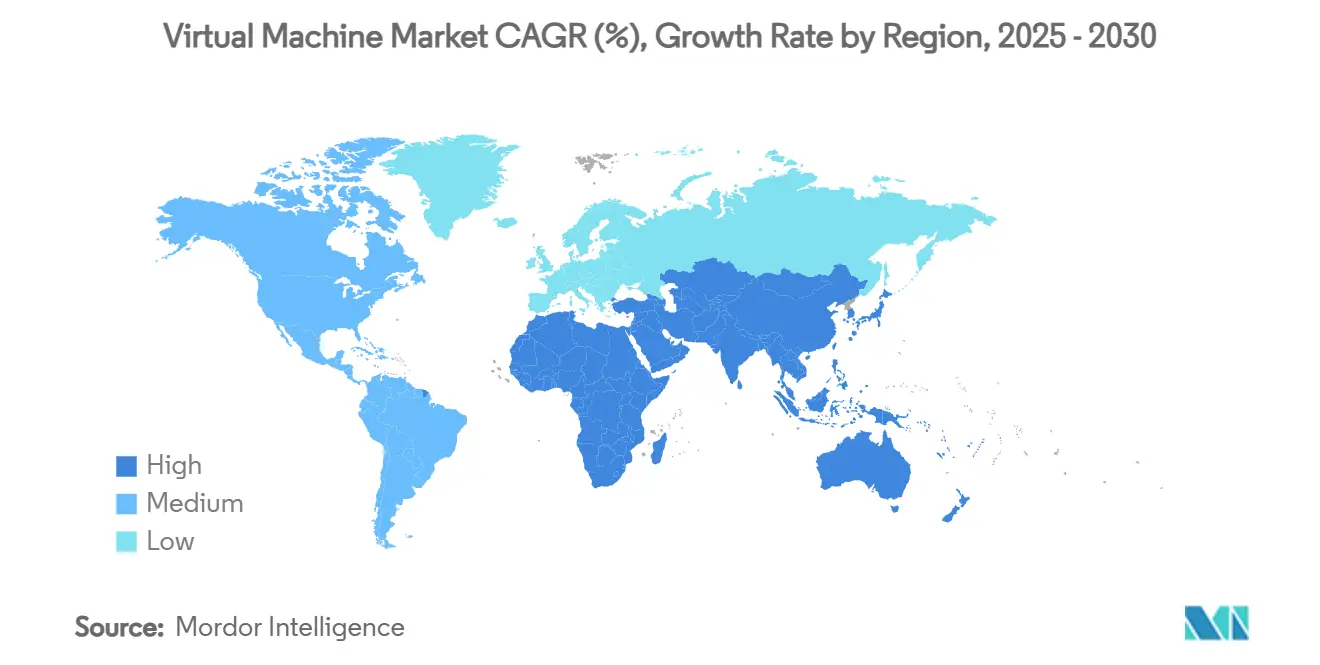
- By geography, North America accounted for 41.68% of 2024 revenue, whereas Asia-Pacific posts the quickest 14.79% CAGR to 2030.
Global Virtual Machine Market Trends and Insights
Drivers Impact Analysis*
| Driver | ( ~ ) % Impact on CAGR Forecast | Geographic Relevance | Impact Timeline |
|---|---|---|---|
| AI-optimised VM images for self-hosted models | +2.8% | Global, led by North America and Asia-Pacific | Medium term (2-4 years) |
| Rising hypervisor licensing costs prompting consolidation | +2.1% | North America and Europe | Short term (≤ 2 years) |
| Container-VM convergence in hybrid-cloud stacks | +1.9% | Global | Medium term (2-4 years) |
| Mainstream adoption of edge-ready lightweight hypervisors | +1.7% | Asia-Pacific and North America | Long term (≥ 4 years) |
| Surge in remote-work VDI and DaaS roll-outs | +1.5% | Developed markets | Short term (≤ 2 years) |
| Sustainable data-center initiatives driving VM density | +1.3% | Europe and North America | Long term (≥ 4 years) |
| Source: Mordor Intelligence | |||
AI-optimised VM Images for Self-Hosted Models
Demand for AI-tuned virtual machine templates has intensified as enterprises deploy large-language-model workloads that must remain inside corporate networks for sovereignty, cost, and latency reasons. VMware’s Private AI Foundation with NVIDIA pre-packages GPU passthrough, CUDA libraries, and security hardening, enabling data-science teams to train and infer at scale without re-architecting existing clusters. [1]VMware, “VMware Private AI Foundation,” vmware.com Healthcare organizations apply these specialized images to diagnostic-imaging pipelines, while banks use them for anti-fraud model training. Premium price points and tight integration with AI accelerators turn optimized images into a retention tool for incumbent hypervisor vendors, directly boosting the virtual machine market.
Rising Hypervisor Licensing Costs Prompting Consolidation
Broadcom’s post-acquisition pricing realignment forces many enterprises to digest three- to six-fold license hikes. CIOs respond by shrinking host counts, raising VM-per-socket density, and migrating non-critical workloads to KVM-based clouds or managed-virtualization services. Broadcom’s own filings confirm that infrastructure-software revenue surged to USD 5.82 billion after the VMware deal, underlining the pressure customers feel to rethink virtualization economics. [2]Broadcom, “Broadcom Reports Q4 2024 Financial Results,” news.broadcom.com The scramble to offset cost spikes accelerates the virtual machine market’s pivot toward lower-license-cost alternatives and consolidated hybrid platforms that maximize core utilization.
Container-VM Convergence in Hybrid-Cloud Stacks
Red Hat’s OpenShift Virtualization embeds KVM inside Kubernetes, allowing operators to orchestrate pods and virtual machines with one control plane. [3]ServeTheHome, “Cloud-Native Efficient Computing,” servethehome.com Financial-services firms benefit by keeping legacy treasury systems in VMs while releasing new microservices as containers under the same compliance envelope. This convergence lowers operational friction, encourages phased modernization, and reinforces hybrid-cloud strategies that underpin the virtual machine market growth trajectory.
Mainstream Adoption of Edge-Ready Lightweight Hypervisors
Lightweight hypervisors such as AWS Firecracker and KubeVirt consume fewer resources, enabling telcos and manufacturers to deploy secure virtual machines at far-edge locations with constrained power budgets. ServeTheHome benchmarks show that stripped-down VMs boot in milliseconds and run efficiently on ARM and low-core x86 nodes. Edge deployments support predictive-maintenance analytics and near-real-time autonomous-system decision loops, adding an incremental growth layer to the virtual machine market over the long term.
Restraints Impact Analysis*
| Restraint | ( ~ ) % Impact on CAGR Forecast | Geographic Relevance | Impact Timeline |
|---|---|---|---|
| Escalating VM sprawl and management complexity | –1.8% | Global, large enterprises | Medium term (2-4 years) |
| Chip-level vulnerabilities (Spectre, Meltdown) | –1.2% | Regulated industries worldwide | Short term (≤ 2 years) |
| Rising cloud egress fees limiting workload mobility | –0.9% | Multi-cloud environments | Short term (≤ 2 years) |
| Skills gap in KVM / open-source hypervisor operations | –0.7% | Emerging markets | Long term (≥ 4 years) |
| Source: Mordor Intelligence | |||
Escalating VM Sprawl and Management Complexity
Internal audits at Global 2000 firms regularly uncover hundreds of idle or orphaned virtual machines that continue to pull storage, memory, and license-metric resources. MDPI research estimates that unmanaged sprawl consumes up to 40% of virtualization-budget line items in large estates. Hybrid-cloud footprints aggravate the challenge, because visibility tools differ across vendors, and tagging discipline remains uneven. Although AI-powered lifecycle-management software promises automated reclamation, implementation delays and change-management hurdles keep complexity high, curbing the virtual machine market’s potential CAGR.
Chip-Level Vulnerabilities (Spectre, Meltdown)
Side-channel exploits such as Spectre and Meltdown undermined confidence in hypervisor isolation by demonstrating cross-VM data leakage via speculative execution. ArXiv findings show that microcode patches introduce measurable performance overhead, prompting some banks to re-platform tier-1 transaction engines onto bare metal for risk mitigation. Persistent discoveries of new variants heighten scrutiny and may restrain virtual machine market adoption for highly sensitive workloads until confidential-computing extensions become mainstream.
*Our forecasts treat driver/restraint impacts as directional, not additive. The impact forecasts reflect baseline growth, mix effects, and variable interactions.
Segment Analysis
By Component: Services Accelerate Despite Software Dominance
Software/Solutions held a 68.34% share of the virtual machine market in 2024, underscoring the entrenched role of hypervisors, management consoles, and monitoring suites in enterprise IT budgets. Nevertheless, the Services segment records a 14.68% CAGR, signaling a decisive swing toward managed-virtualization contracts and professional services engagements that shoulder configuration, patching, and compliance tasks. In 2024 BMW relied on external consultants to blend legacy production-line controllers with GPU-enabled hypervisors, proving that deep domain knowledge is critical when virtualizing operational-technology stacks. As cloud environments grow more heterogeneous, organizations prefer outcome-based service-level agreements that guarantee performance rather than purchasing perpetual software alone.
Heightened complexity is also prompting mid-sized companies to outsource life-cycle management. Managed-service providers package policy-driven automation with tiered pricing, a model that resonates with CFOs seeking predictable OpEx. Consequently, Services are expected to contribute a rising proportion of overall virtual machine market size revenue by 2030. Vendors that pair subscription licensing with advisory and managed-operations add-ons stand to deepen customer stickiness and offset commoditization pressure on core hypervisor binaries.


By Deployment Type: Cloud Gains Momentum Against On-Premise Leadership
On-premise deployments maintained 55.41% of virtual machine market share in 2024 because heavily regulated verticals still require local data custody and deterministic latency. Yet cloud deployments are scaling quickly, showing a 14.86% CAGR on the back of sovereign-cloud programs and rising reliability of confidential-computing services. VMware Cloud Foundation, for instance, reported more than 4,500 new enterprise adopters after the Broadcom acquisition, reflecting heightened interest in subscription-based private-cloud stacks that abstract underlying hardware. Eliminating data-transfer egress fees, as announced by several hyperscalers, further lowers migration barriers and amplifies cloud traction.
Hybrid blueprints act as an intermediary step for organizations dealing with latency-sensitive or data-sovereignty workloads. Financial institutions such as Sagicor Bank Jamaica run KVM clusters on-premise for core-banking functions while bursting stress-testing simulations into a secured cloud partition. This pragmatic placement strategy ensures that each workload resides in the optimal environment for compliance, performance, and cost. The dual-platform need intensifies demand for unified resource management and cross-domain teleportation of VMs, reinforcing growth of the virtual machine market.
By Organization Size: SME Growth Outpaces Enterprise Adoption
Large enterprises continued to account for 64.29% of virtual machine market revenue in 2024. Their footprint includes mission-critical enterprise resource-planning systems, customer-data platforms, and large virtual desktop infrastructure (VDI) estates that rely on mature hypervisor stacks. However, small and medium enterprises are the fastest movers, expanding at a 14.89% CAGR as simplified deployment models lower entry barriers. Cloud marketplaces now offer turnkey virtual machine bundles that can be provisioned without deep IT expertise, effectively democratizing access to high-availability clusters.
Lightweight control panels, pay-as-you-go billing, and templated security baselines resonate with SMEs striving for operational efficiency. Training providers report higher enrollment in beginner-level Hyper-V and KVM courses, indicating that the skills gap is narrowing. As licensing models shift from perpetual to subscription, SMEs can align cash flow with usage, making virtualization adoption financially viable. The trend supports robust expansion of the virtual machine market size across the long tail of small-business customers.
By End-User Industry: Healthcare Leads Growth Across Diverse Sectors
IT and Telecommunications commanded 38.73% of the virtual machine market share in 2024, a reflection of its role as both provider and heavy consumer of virtualized compute. Yet healthcare and life sciences record the strongest 14.93% CAGR, driven by telehealth platforms, clinical-decision-support systems, and AI-enhanced medical imaging that require GPU-rich, privacy-preserving virtual machines. VMware’s Private AI blueprints allow hospital systems to keep sensitive radiological data on-premise while harnessing model-training acceleration, a balance that satisfies regulatory mandates.
Manufacturing plants deploy edge hypervisors to host computer-vision quality-control loops close to assembly lines, minimizing latency penalties. Government and defense agencies adopt air-gapped virtual clusters to process classified workloads in accordance with zero-trust doctrine. Banking, financial services, and insurance institutions build resilient active-active VM pairs across dual regions to meet operational-resilience rules, further broadening the virtual machine market addressable scope.
Geography Analysis
North America held 41.68% of virtual machine market revenue in 2024 as Fortune 500 enterprises continue large-scale data-center expansions to facilitate AI model training. Broadcom’s customer base alone consumed an additional 10 GW of power capacity for AI-optimized clusters in 2025. Stringent cybersecurity frameworks such as the U.S. Executive Order on Improving the Nation’s Cybersecurity encourage adoption of hardened hypervisor builds and confidential-computing services. Federal and defense agencies favor air-gapped VMware or KVM installations, ensuring domestic data sovereignty and compliance with FedRAMP High baselines. The maturity of partner ecosystems strengthens after-sales support, making North America a stronghold for premium virtualization offerings inside the virtual machine market.
Asia-Pacific, projected to compound at 14.79% CAGR, benefits from explosive data-center projects in China, India, Japan, and South Korea. National digital-economy roadmaps prioritize cloud-first procurement that, in turn, drives virtual machine migrations. Vietnam’s sovereign-cloud initiative is catalyzing investment in edge nodes for low-latency IoT analytics across industrial parks. Manufacturing conglomerates such as Foxconn anchor virtual desktop rollouts to secure factory floor AI systems, while regional telcos deploy lightweight hypervisors to enable 5G-edge MEC applications. The diversity of regulatory frameworks compels vendors to deliver flexible licensing and localized compliance tooling, reinforcing momentum in the virtual machine market.
Europe shows steady, regulation-driven adoption as the Digital Operational Resilience Act (DORA) compels financial institutions to build fault-tolerant, multi-region VM architectures. Sustainability directives push operators to prioritize energy-efficient hypervisors capable of dynamic right-sizing and memory-overcommit controls. Meanwhile, Latin America moves from emergent to growth stage, forecast to inject USD 10 billion into data-center infrastructure by 2029. New colocation facilities across Brazil and Chile will require virtualization as the abstraction layer of choice, adding an additional leg to global virtual machine market expansion.

Competitive Landscape
Competition in the virtual machine market is moderate, with a core cluster of incumbent hypervisor vendors facing disruptive pressure from open-source and cloud-native challengers. Broadcom’s 2024 VMware acquisition reshaped pricing and licensing standards, propelling Microsoft Hyper-V, Red Hat OpenShift Virtualization, and KVM derivatives into renewed relevance. IBM, Dell Technologies, and Hewlett Packard Enterprise differentiate through integrated stacks that bundle servers, storage, and hypervisor control software. Citrix, Oracle, and Nutanix focus on workload mobility and multi-cloud governance to mitigate vendor lock-in concerns.
Product roadmaps emphasize AI-centric enhancements such as GPU passthrough automation, confidential-VM encryption, and micro-segmentation firewalls. Red Hat’s 2025 OpenShift Virtualization release for U.S. defense agencies demonstrates how compliance-ready variants can unlock niche segments. Patent filings reveal heightened activity around edge-oriented orchestration; IBM’s distributed service-delivery method underscores the move toward federated hypervisor clusters spanning data centers and cell-tower edge hubs. Smaller innovators exploit white-space in lightweight hypervisors, particularly for ARM-based servers and resource-tight appliances.
Strategic alliances also intensify. Broadcom partners with more than 50 sovereign-cloud providers to ensure compliance localization. Google Cloud extends its air-gapped Distributed Cloud blueprint to sensitive public-sector workloads, challenging VMware’s hold on classified environments. As licensing transitions to subscription models, vendors increasingly guarantee service-level outcomes-performance, uptime, and patch cadence-rather than transferring software bits alone. These trends collectively sustain brisk revenue prospects while compressing pure-play hypervisor margins inside the virtual machine market.
Virtual Machine Industry Leaders
VMware, Inc.
Microsoft Corporation
Citrix Systems, Inc.
Red Hat, Inc.
Oracle Corporation
- *Disclaimer: Major Players sorted in no particular order

Recent Industry Developments
- June 2025: Broadcom posted USD 15 billion in quarterly revenue, including USD 4.4 billion from AI chips and 25% software growth, underscoring post-VMware integration momentum.
- March 2025: Red Hat unveiled hardened OpenShift Virtualization for U.S. Department of Defense operations, supplying a secure alternative to proprietary hypervisors.
- February 2025: Google Cloud extended its Distributed Cloud air-gapped option to classified data workloads, offering a zero-connectivity virtual machine enclave.
- December 2024: Broadcom finalized VMware integration and confirmed 4,500 VMware Cloud Foundation customers within the first year.


Global Virtual Machine Market Report Scope
| Software/Solutions |
| Services |
| On-premise |
| Cloud |
| Hybrid |
| Large Enterprises |
| Small and Medium Enterprises (SMEs) |
| IT and Telecommunications |
| Banking, Financial Services and Insurance |
| Healthcare and Life Sciences |
| Government and Defense |
| Manufacturing |
| Retail and E-commerce |
| North America | United States | |
| Canada | ||
| Mexico | ||
| South America | Brazil | |
| Argentina | ||
| Rest of South America | ||
| Europe | Germany | |
| United Kingdom | ||
| France | ||
| Russia | ||
| Rest of Europe | ||
| Asia-Pacific | China | |
| Japan | ||
| India | ||
| South Korea | ||
| Australia | ||
| Rest of Asia-Pacific | ||
| Middle East and Africa | Middle East | Saudi Arabia |
| United Arab Emirates | ||
| Rest of Middle East | ||
| Africa | South Africa | |
| Egypt | ||
| Rest of Africa | ||
| By Component | Software/Solutions | ||
| Services | |||
| By Deployment Type | On-premise | ||
| Cloud | |||
| Hybrid | |||
| By Organization Size | Large Enterprises | ||
| Small and Medium Enterprises (SMEs) | |||
| By End-user Industry | IT and Telecommunications | ||
| Banking, Financial Services and Insurance | |||
| Healthcare and Life Sciences | |||
| Government and Defense | |||
| Manufacturing | |||
| Retail and E-commerce | |||
| By Geography | North America | United States | |
| Canada | |||
| Mexico | |||
| South America | Brazil | ||
| Argentina | |||
| Rest of South America | |||
| Europe | Germany | ||
| United Kingdom | |||
| France | |||
| Russia | |||
| Rest of Europe | |||
| Asia-Pacific | China | ||
| Japan | |||
| India | |||
| South Korea | |||
| Australia | |||
| Rest of Asia-Pacific | |||
| Middle East and Africa | Middle East | Saudi Arabia | |
| United Arab Emirates | |||
| Rest of Middle East | |||
| Africa | South Africa | ||
| Egypt | |||
| Rest of Africa | |||


Key Questions Answered in the Report
How large is the virtual machine market in 2025?
The virtual machine market size is valued at USD 13.59 billion in 2025 and is forecast to grow at a 14.66% CAGR to 2030.
Which component segment is growing fastest?
Services post the quickest expansion, advancing at a 14.68% CAGR as enterprises seek managed virtualization and professional support.
Why are licensing-cost changes influencing virtualization strategies?
Broadcom’s VMware pricing adjustments increased costs by several multiples, prompting many firms to consolidate host footprints and evaluate open-source hypervisors.
Which region shows the highest growth momentum?
Asia-Pacific leads with a 14.79% CAGR through 2030, fueled by new data-center builds and government cloud-first policies.
What drives healthcare adoption of virtual machines?
Telemedicine expansion, AI-enabled medical imaging, and stringent data-privacy mandates push healthcare providers toward GPU-ready, compliant virtual machines.
How do confidential-computing technologies impact virtualization?
Confidential-VM encryption mitigates chip-level side-channel threats, restoring trust in multi-tenant isolation and enabling sensitive workloads to remain virtualized.
Page last updated on:


