Cloud Managed Services Market Size and Share
Market Overview
| Study Period | 2020 - 2031 |
|---|---|
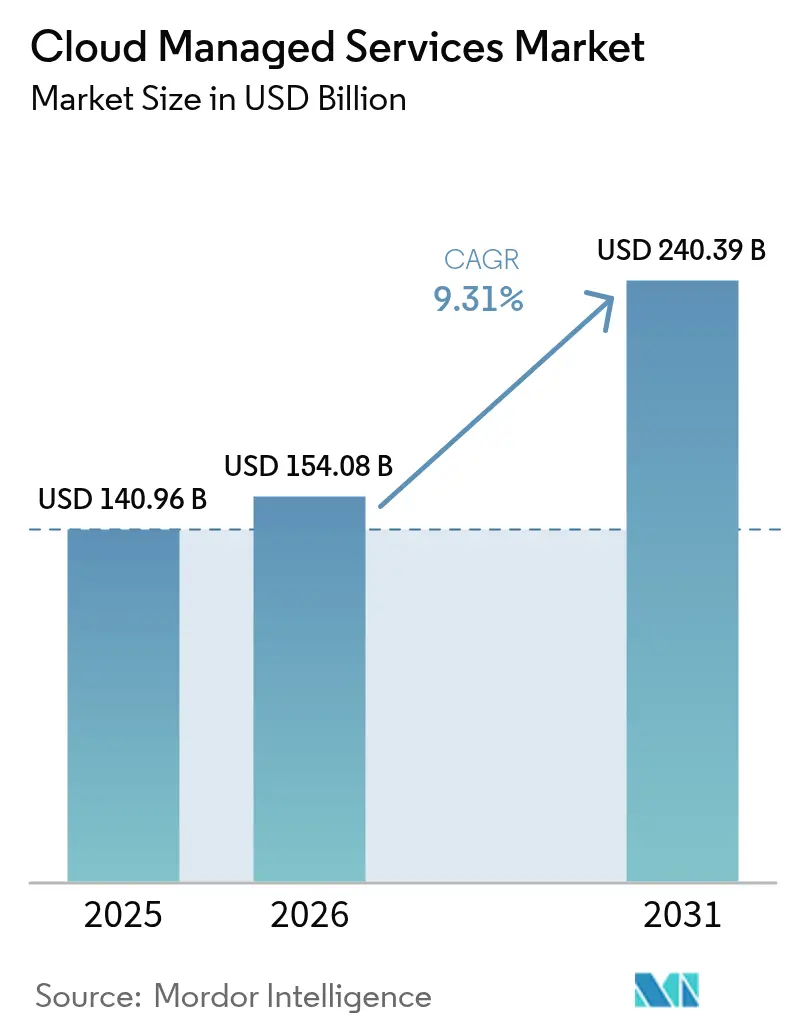
| Market Size (2026) | USD 154.08 Billion |
| Market Size (2031) | USD 240.39 Billion |
| Growth Rate (2026 - 2031) | 9.31% CAGR |
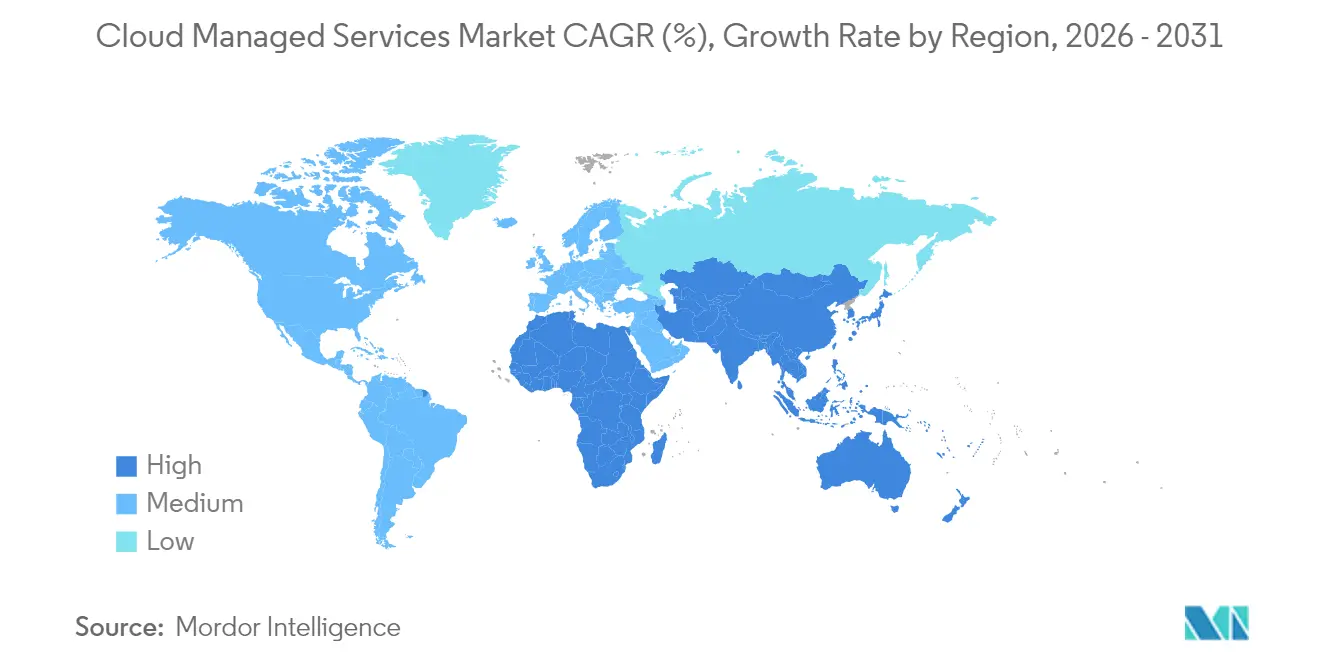
| Fastest Growing Market | Asia Pacific |
| Largest Market | North America |
| Market Concentration | Medium |
Major Players *Disclaimer: Major Players sorted in no particular order Image © Mordor Intelligence. Reuse requires attribution under CC BY 4.0. | |
Cloud Managed Services Market Analysis by Mordor Intelligence
The Cloud Managed Services Market size was valued at USD 140.96 billion in 2025 and estimated to grow from USD 154.08 billion in 2026 to reach USD 240.39 billion by 2031, at a CAGR of 9.31% during the forecast period (2026-2031).
Enterprises continue moving from asset-heavy infrastructure ownership to pay-as-you-go operating models that improve agility, free cash and shorten innovation cycles. Demand rises sharply as multi-cloud sprawl and cybersecurity threats strain in-house IT teams. Financial-services digital mandates, AI-driven workloads and sustainability targets intensify the need for expert external management. North America holds the lion’s share of spending, yet Asia Pacific’s large untapped base and pro-cloud policy environment make it the fastest-expanding region. Competition increasingly revolves around automation, compliance depth and vertical expertise rather than simple cost arbitrage.
Key Report Takeaways
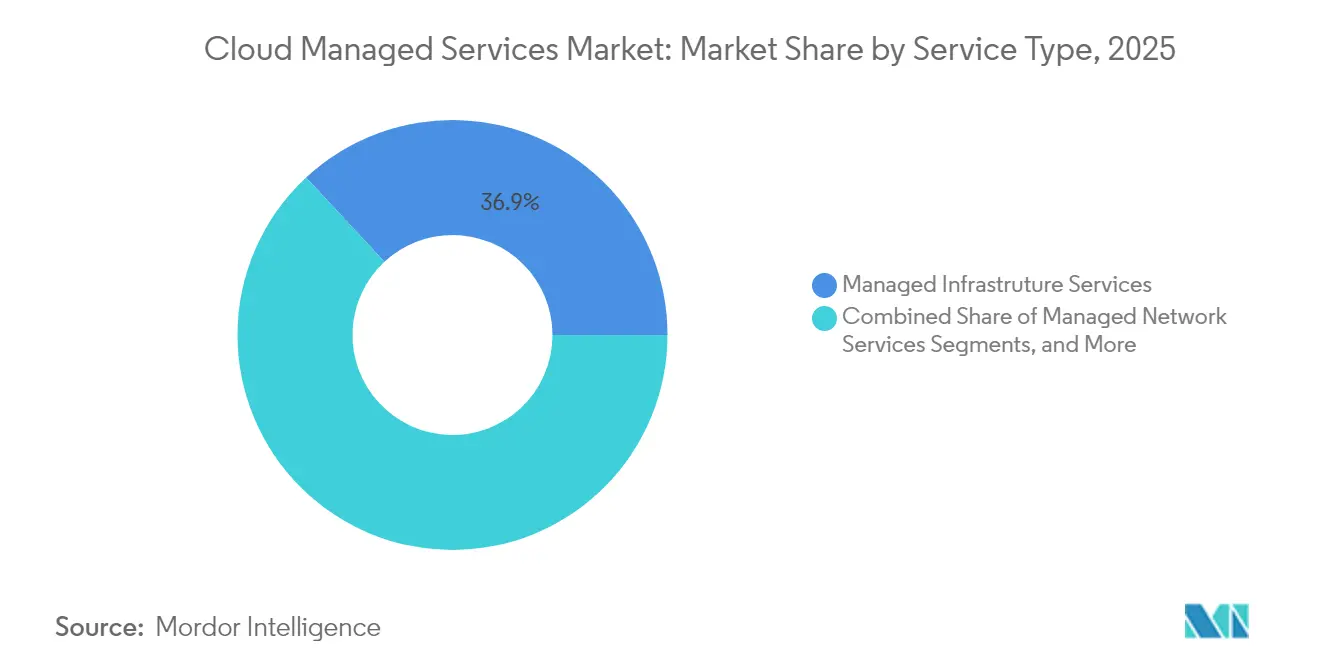
- By service type, managed infrastructure services led with 36.92% revenue share in 2025; managed security services are projected to expand at a 10.52% CAGR through 2031.
- By deployment model, the public-cloud option captured 51.42% of the cloud managed services market share in 2025, while hybrid-cloud services are slated to grow at 11.23% CAGR to 2031.
- By enterprise size, large enterprises accounted for 64.78% share of the cloud managed services market size in 2025; small and medium enterprises will advance at 9.61% CAGR through 2031.
- By end-user industry, the BFSI segment held 31.62% revenue share in 2025; retail and e-commerce workloads will expand at a 9.97% CAGR to 2031.
- By geography, North America commanded 36.85% of 2025 spending, whereas Asia Pacific is on track for a 9.41% CAGR during the forecast period.
Note: Market size and forecast figures in this report are generated using Mordor Intelligence’s proprietary estimation framework, updated with the latest available data and insights as of 2026.
Global Cloud Managed Services Market Trends and Insights
Drivers Impact Analysis*
| Driver | (~) % Impact on CAGR Forecast | Geographic Relevance | Impact Timeline |
|---|---|---|---|
| BFSI digital-first initiatives accelerate managed-cloud outsourcing | +1.80% | Global, with concentration in North America and Europe | Medium term (2-4 years) |
| Surge in multi-cloud and hybrid complexity among enterprises | +1.50% | Global, particularly APAC and North America | Short term (≤ 2 years) |
| Heightened cyber-risk and compliance push 24/7 managed security | +1.20% | Global, with emphasis on regulated industries | Short term (≤ 2 years) |
| Cost-optimization pressure on CIO budgets (Op-Ex vs Cap-Ex) | +1.00% | Global, with stronger impact in cost-sensitive markets | Medium term (2-4 years) |
| FinOps adoption creates new demand for continuous cloud cost governance | +0.80% | North America and Europe, expanding to APAC | Medium term (2-4 years) |
| Sustainability and green-cloud mandates reshape provider selection | +0.60% | Europe leading, followed by North America | Long term (≥ 4 years) |
| Source: Mordor Intelligence | |||
BFSI Digital-First Mandates Intensify Outsourcing
Banks and insurers now place managed cloud services at the core of their modernization roadmaps, driving growth in the cloud managed services Market. In April 2024 Tata Consultancy Services expanded its AWS alliance, pledging to train 25,000 engineers on bank-grade cloud modernization patterns.[1]Tata Consultancy Services, “TCS and AWS Deepen Partnership to Accelerate Cloud Transformation,” tcs.com Institutions view external partners as the only realistic route to embed generative-AI, automate compliance checks and shorten product release cycles. Hybrid set-ups allow next-generation core systems to coexist with legacy platforms, lowering operational risk. Asia-Pacific banks stand out: budget allocations for cloud modernization now outweigh cost-cutting targets as customer-experience gains become paramount.
Surge in Multi-Cloud and Hybrid Complexity Among Enterprises
Hybrid and multi-cloud adoption has become mainstream, yet few firms can master cross-platform orchestration internally. VMware reports that 93% of its customers intend to keep hybrid architectures long term.[2]VMware, “Hybrid Cloud Customer Stories,” vmware.comNutanix finds that 95% of enterprises shifted applications between clouds in 2024 to improve security or speed innovation. The result is a booming need for partners who deliver unified visibility, automated workload placement, and cost governance across cloud estatess, driving further growth in the Cloud Managed Services Market.
Heightened Cyber-Risk and Compliance Push 24/7 Managed Security
Ransomware recovery often stretches into days, eroding trust in purely in-house defenses. Canon IT Solutions launched a cloud-native application protection platform (CNAPP) in December 2024 priced at JPY 350,000 (USD 2,625) per month, giving clients continuous monitoring across AWS, Azure, and Google Cloud. BFSI institutions rely on real-time threat feeds from Akamai’s edge platform to satisfy DORA and PCI DSS obligations.[3]Akamai Technologies, “Financial Services Security Overview,” akamai.comZero-trust postures and 24/7 response windows now define baseline expectations for managed security contracts, reinforcing the demand for comprehensive services in the Cloud Managed Services Market.
Cost-Optimization Pressure on CIO Budgets (Op-Ex vs Cap-Ex)
Economic headwinds elevate FinOps to board-level priority. CloudKeeper’s State of FinOps 2024 shows that organizations with high monthly spend concentrate on commitment-discount optimization while smaller spenders pursue accurate forecasting. Dell’s APEX Flex on Demand claims up to 60% opex savings versus fixed-capacity models by matching billing to real usage.[4]Dell Technologies, “APEX Flex on Demand,” dell.com Predictable pay-as-you-go billing makes managed services attractive during uncertain economic cycles.
Restraints Impact Analysis*
| Restraint | (~) % Impact on CAGR Forecast | Geographic Relevance | Impact Timeline |
|---|---|---|---|
| Persistent data-breach anxiety and evolving threat landscape | -0.8% | Global, with higher impact in regulated industries | Short term (≤ 2 years) |
| Vendor lock-in risks slow large-scale workload migration | -0.6% | Global, particularly affecting large enterprises | Medium term (2-4 years) |
| Global shortage of certified cloud-architect talent | -0.5% | Global, most acute in North America and Europe | Long term (≥ 4 years) |
| Fragmented data-sovereignty laws inflate compliance cost | -0.4% | Europe leading, expanding globally | Medium term (2-4 years) |
| Source: Mordor Intelligence | |||
Persistent Data-Breach Anxiety and Evolving Threat Landscape
UK research shows many SMEs still delay cloud migration because of perceived security gaps, even though they acknowledge benefits in flexibility and cost. Compliance audits and customer trust weigh heavily, lengthening deal cycles for providers that cannot produce rigorous certifications and incident-response metrics.
Vendor Lock-In Risks Slow Large-Scale Workload Migration
The US Federal Trade Commission is scrutinizing exclusive cloud-AI partnerships, highlighting potential switching-cost barriers for customers. South-African studies confirm that SMEs often hesitate to pursue transformative cloud projects over fears of losing bargaining power and technical autonomy. Providers must counter with open architectures, flexible contracts, and robust exit tooling.
*Our forecasts treat driver/restraint impacts as directional, not additive. The impact forecasts reflect baseline growth, mix effects, and variable interactions.
Segment Analysis
By Service Type: Security Services Drive Premium Growth
Managed infrastructure services continue to deliver foundational provisioning, capturing 36.92% of 2025 revenue. Yet managed security services grow faster at 10.52% CAGR as firms prioritize continuous threat hunting, zero-trust enforcement and compliance reporting. The cloud managed services market size for managed security will therefore outpace most other segments. AI-driven security operations centers, such as VikingCloud’s platform that analyzes billions of events daily, strengthen provider advantage by shortening dwell time and automating correlation. Network, application, backup and disaster-recovery services remain steady, channeling complex modernization projects and legacy support.
Second-order effects ripple across the cloud managed services industry as providers bundle security with infrastructure and network oversight, creating integrated platforms that raise switching costs. Enterprise buyers value unified dashboards, consistent SLAs and single-pane governance across multi-cloud estates features that independent point solutions struggle to match.


By Deployment Model: Hybrid Architectures Accelerate Despite Public-Cloud Dominance
The public-cloud option retains 51.42% cloud managed services market share in 2025, anchored by hyperscale availability zones and rich native tooling. The hybrid model, however, accelerates at 11.23% CAGR as clients seek latency control, data residency and cost optimization advantages. Use of AWS Outposts by Nomura Research Institute lets Japanese banks run AWS services on-premises to satisfy sovereignty rules. Equinix Japan’s partnership with Sakura Internet illustrates how co-location and GPU-ready services blend public economics with private control for AI workloads. Private-cloud growth remains modest, reserved for ultra-low-latency or niche regulatory cases.
Managed-service vendors now differentiate themselves in the cloud managed services market by offering consistent policy engines, cost dashboards and observability across public, private and edge footprints. Clients with strict uptime or data-location mandates increasingly treat provider proficiency in hybrid integration as a purchase prerequisite.
By Enterprise Size: SME Adoption Accelerates Through Managed Service Accessibility
Large enterprises command 64.78% of 2025 spending, attracted by vendor capacity to manage sprawling multi-cloud footprints and deliver global SLAs. The cloud managed services market size captured by SMEs, however, expands faster at 9.61% CAGR because managed offerings neutralize expertise gaps and deliver predictable opex. Research on Australian SMEs stresses that thorough preparatory work and external guidance mark the difference between disruptive and smooth transitions. Redapt identifies five areas focus, security, cost, scalability and simple operations where managed services help SMEs punch above their weight. Providers cater to this cohort with packaged 24/7 monitoring, tiered security and pay-per-use billing.
Support for SMEs also aligns with government digital-enablement grants, especially in developing economies where cloud skills are scarce. Bundled migration plus training services help smaller companies adopt advanced analytics and e-commerce without committing to expansive internal IT departments.

By End-User Industry: Retail Transformation Drives Fastest Growth
The BFSI vertical maintains 31.62% share of the cloud managed services market in 2025, due to heavy compliance demands and real-time transaction workloads. Retail and e-commerce deployments, however, register a 9.97% CAGR, making them the fastest growth engine through omnichannel expansion and supply-chain digitization. Edge analytics for smart stores, real-time inventory and personalized marketing push retailers toward managed-service partners. Manufacturing clients integrate edge-to-cloud predictive maintenance, while healthcare entities leverage secure data lakes for diagnostics and tele-medicine.
Providers respond with vertical blueprints pre-configured policy packs, reference architectures and compliance toolchains. For instance, BluEnt reports that retailers rely on managed cloud e-commerce platforms for cost control and elastic scaling during cyclical peaks. Such specialization lifts switching barriers and raises average contract value.
Geography Analysis
North America remains the largest spender, retaining 36.85% share of the cloud managed services market in 2025. Early adoption, mature partner ecosystems and a robust venture funding scene sustain demand for optimization, AI operations and compliance automation. US enterprises favor outcome-based contracts, while Canadian firms leverage cross-border proximity for dual-region resilience. Mexican manufacturers integrate managed edge gateways to underpin Industry 4.0 programs.
Asia Pacific records the fastest 9.41% CAGR in the cloud managed services market through 2031 as governments subsidize digitization and broadband access widens. Huawei Cloud’s partner network now counts more than 45,000 firms and 12,000 marketplace offers, linking finance, telecom and AI start-ups across the region. India’s IT majors revamp legacy estates for global service exports. Japan’s high trust threshold spurs demand for hybrid setups backed by local data centers, while South Korea’s 5G backbone accelerates edge-heavy workloads. Australia’s isolation intensifies calls for local managed nodes that interconnect seamlessly with global resources, an area where OpenText is investing heavily in 2025.
Europe’s regulatory mosaic drives provider differentiation on data-residency and sustainability credentials. Germany’s Mittelstand manufacturers tap managed services for Industrie 4.0, while French and Italian public-cloud spend rises under national AI strategies. UK financial institutions commission integrated threat-management suites to align with PRA expectations. The region’s Green Deal and CSRD reporting dampen demand for providers without transparent emissions metrics; Microsoft’s pledge to power data centers with 100% renewable energy influences sourcing decisions.
South America and the Middle East and Africa represent nascent yet high-potential territories where managed services circumvent limited local infrastructure. Expereo notes businesses boosting spending on SD-WAN and SASE to deliver consistent application performance across geographically dispersed operations.

Competitive Landscape
The cloud managed services market shows moderate concentration. Hyperscalers (AWS, Microsoft, Google) anchor the infrastructure layer, while global IT services majors (IBM, Accenture, TCS, Wipro, HCL) combine scale with vertical consulting. Telecom carriers (NTT DATA, Lumen, Orange) add network depth, and specialized players (Rackspace, VikingCloud, RDX) exploit niche capability gaps.
Strategic directions cluster around:
- Vertical specialization. Pinnacle Technology Partners targets life-sciences customers by integrating AI for drug-discovery pipelines and securing Good Laboratory Practice data flows.
- Sustainability services. IFS launched a sustainability management module within IFS Cloud to meet EU CSRD data-tracking needs, illustrating how compliance demands drive product expansion.
Private-equity interest remains high. CDW bought Mission Cloud in February 2025, while H.I.G. Capital took Converge Technology Solutions private the same month, betting on cross-sell synergies and managed security upsell. Madison Dearborn’s 2024 acquisition of RDX underlines appetite for database-centric providers that bridge legacy and cloud.
White-space opportunities lie in edge-device lifecycle management, sovereign-cloud orchestration and carbon-aware workload scheduling. Providers that can merge cross-domain skills network, infrastructure, security, FinOps and ESG reporting will stand out as one-stop modernization partners.
Cloud Managed Services Industry Leaders
Amazon Web Services (AWS)
Microsoft (Azure Managed Services)
IBM
Accenture
NTT DATA
- *Disclaimer: Major Players sorted in no particular order


Recent Industry Developments
- February 2025: CDW completed acquisition of Mission Cloud, expanding its managed-services portfolio to accelerate client digital transformation.
- February 2025: H.I.G. Capital announced purchase of Converge Technology Solutions, signaling continued private-equity confidence in the sector.
- February 2025: OpenText deepened Asia Pacific investment in cloud, security and AI infrastructure to support regional growth.
- December 2024: Canon IT Solutions launched CNAPP service for continuous multi-cloud security monitoring priced at JPY 350,000 (USD 2,625) monthly.
- November 2024: Nomura Research Institute rolled out AWS Outposts-based managed services for data-sovereignty-sensitive workloads.


Research Methodology Framework and Report Scope
Market Definitions and Key Coverage
Our study defines the cloud managed services market as the recurring, contract-based outsourcing of monitoring, optimization, and technical support for public, private, and hybrid cloud resources, including compute, storage, network, security, and application stacks, delivered by third-party providers and measured in annual service revenue. Mordor Intelligence sizes the market in value terms, beginning with the 2025 baseline of USD 140.96 billion and projecting to 2030.
Scope exclusion: Professional cloud consulting, one-off migration projects, and purely on-premise managed services remain outside the boundary.
Segmentation Overview
- By Service Type
- Managed Infrastructure Services
- Managed Network Services
- Managed Security Services
- Managed Application Services
- Other Service Type
- By Deployment Model
- Public Cloud
- Private Cloud
- Hybrid Cloud
- By Enterprise Size
- Large Enterprises
- Small and Medium Enterprises (SMEs)
- By End-User Industry
- BFSI
- IT and Telecom
- Retail and E-Commerce
- Healthcare and Life Sciences
- Manufacturing
- Government and Public Sector
- Other End-Users
- By Geography
- North America
- United States
- Canada
- Mexico
- South America
- Brazil
- Argentina
- Rest of South America
- Europe
- United Kingdom
- Germany
- France
- Italy
- Spain
- Russia
- Rest of Europe
- Asia-Pacific
- China
- India
- Japan
- South Korea
- Australia
- Rest of Asia-Pacific
- Middle East and Africa
- Saudi Arabia
- United Arab Emirates
- Turkey
- South Africa
- Rest of Middle East and Africa
- North America
Detailed Research Methodology and Data Validation
Primary Research
Mordor analysts interview managed service executives, cloud architects, procurement leads, and industry consultants across North America, Europe, Asia-Pacific, and the Middle East. Insights on average contract values, security add-on penetration, and regional pricing differentials help us plug data gaps and stress-test model assumptions.
Desk Research
We first assemble foundational data from tier-1 public sources such as the U.S. Bureau of Labor Statistics, Eurostat, International Telecommunication Union, OECD ICT indicators, and regional cloud trade associations. Cloud adoption ratios, hyperscaler capacity additions, and tariff filings enrich our demand pool, while company filings and 10-K disclosures anchor provider revenue splits. Paid resources, notably D&B Hoovers and Dow Jones Factiva, supplement provider financials and news flow. A broader scan of patent analytics via Questel and import volumes from Volza helps us sense technology diffusion patterns. This list is illustrative; many additional sources support data collection, validation, and clarification.
Market-Sizing & Forecasting
We reconstruct the top-down demand pool from enterprise cloud spend, public cloud service revenue, and managed service penetration, which are then validated through sampled provider roll-ups and channel checks. Key variables like multi-cloud adoption rate, average seat price, security service attach ratio, regional GDP per digital worker, and hyperscaler capacity build-out drive our model. Multivariate regression with scenario analysis forecasts each variable to 2030; bottom-up slices refine totals where data are solid.
Data Validation & Update Cycle
Analysts compare outputs with independent cloud spend trackers; anomaly flags trigger peer review, and results undergo a final sign-off before release. Reports refresh annually, and material events, such as major pricing shifts or regulations, prompt interim updates.
Why Mordor's Cloud Managed Services Baseline Offers Reliable Clarity
Published estimates often diverge; differing service scopes, pricing ladders, and refresh timings create visible gaps for decision-makers.
Key gap drivers include wider inclusion of one-time professional services, on-premise overlaps, aggressive average selling price escalation, and less frequent dataset refreshes in other studies, whereas we isolate recurring cloud-only revenue and update figures yearly.
Benchmark comparison
| Market Size | Anonymized source | Primary gap driver |
|---|---|---|
| USD 140.96 B (2025) | Mordor Intelligence | - |
| USD 134.44 B (2024) | Global Consultancy A | Includes partial on-premise managed IT and uses higher ASP inflation |
| USD 137.33 B (2024) | Industry Portal B | Blends advisory revenue and applies uniform global penetration rate |
| USD 95.56 B (2024) | Trade Journal C | Excludes security add-ons and relies on limited provider disclosure |
Taken together, the comparison shows that our disciplined scope selection, variable-level cross-checks, and annual refresh cadence deliver a balanced, transparent baseline clients can trust for strategic planning.


Key Questions Answered in the Report
What is the projected growth of the cloud managed services market?
The cloud managed services market size is forecast to rise from USD 154.08 billion in 2026 to USD 240.39 billion by 2031, registering a 9.31% CAGR.
Which service type is growing the fastest?
Managed security services show the fastest expansion, with a projected 10.52% CAGR through 2031 as organizations outsource 24/7 threat detection and compliance management.
Why are hybrid cloud models gaining traction?
Hybrid architectures balance latency, data residency and cost by mixing on-premises assets with public-cloud scalability, driving an 11.23% CAGR in managed hybrid-cloud services.
Which region offers the highest growth opportunity?
Asia Pacific leads in growth with a 9.41% CAGR, propelled by government digitization mandates and expanding cloud infrastructure investments.
What are the main barriers to wider adoption?
Data-breach anxiety, vendor lock-in concerns, qualified-talent shortages and fragmented data-sovereignty laws collectively temper adoption, though providers with strong compliance and open-platform credentials can mitigate these risks.
How consolidated is the competitive landscape?
The market scores 6/10 on concentration; while a handful of global players command significant share, vertical specialists and regional providers continue to carve out profitable niches.
Page last updated on:


