Visual Analytics Market Size and Share
Market Overview
| Study Period | 2020 - 2031 |
|---|---|
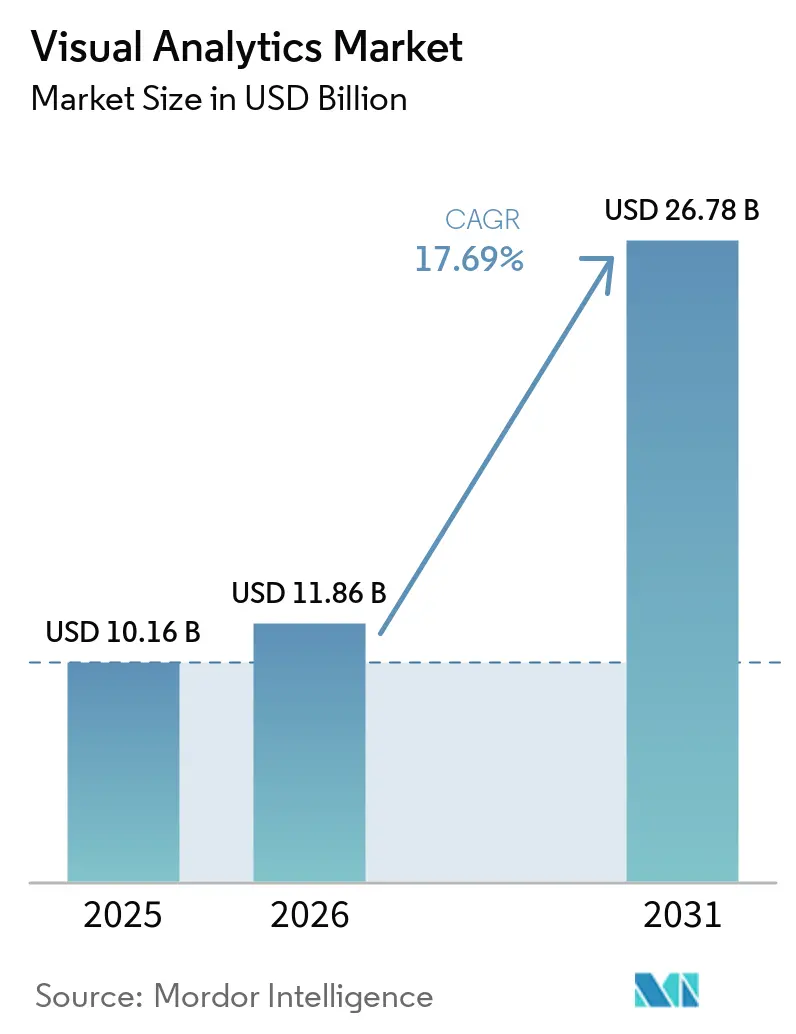
| Market Size (2026) | USD 11.86 Billion |
| Market Size (2031) | USD 26.78 Billion |
| Growth Rate (2026 - 2031) | 17.69% CAGR |
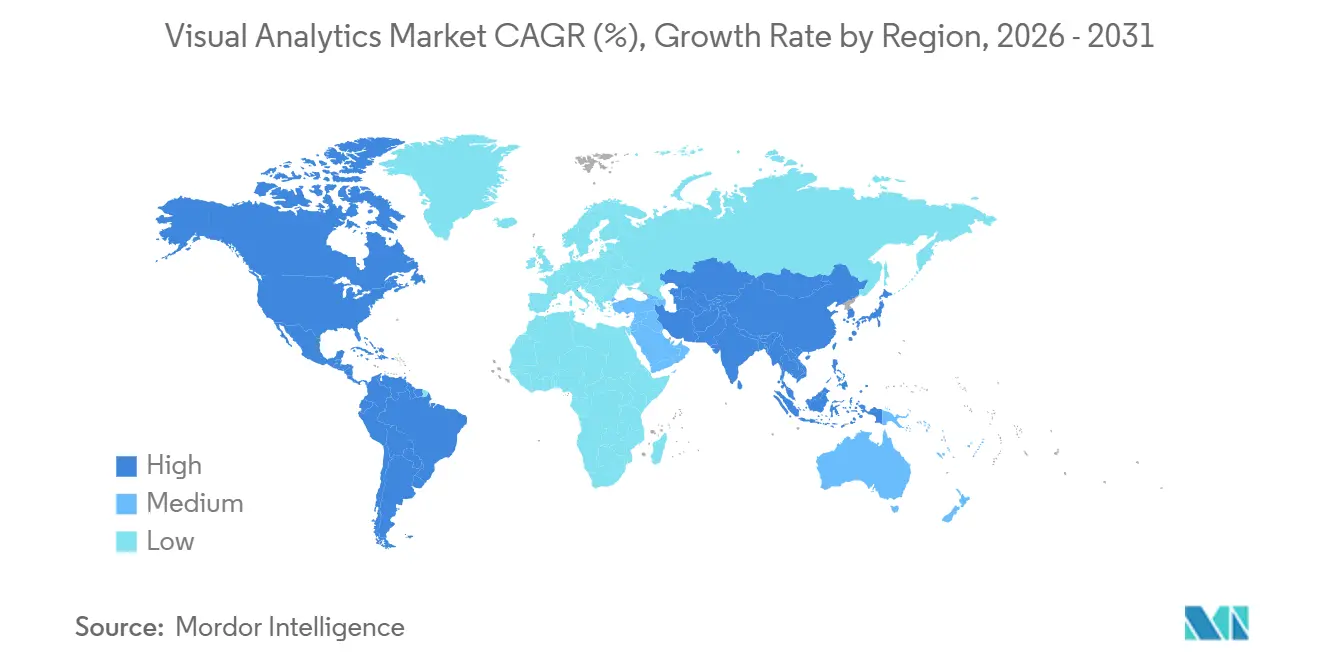
| Fastest Growing Market | Asia Pacific |
| Largest Market | North America |
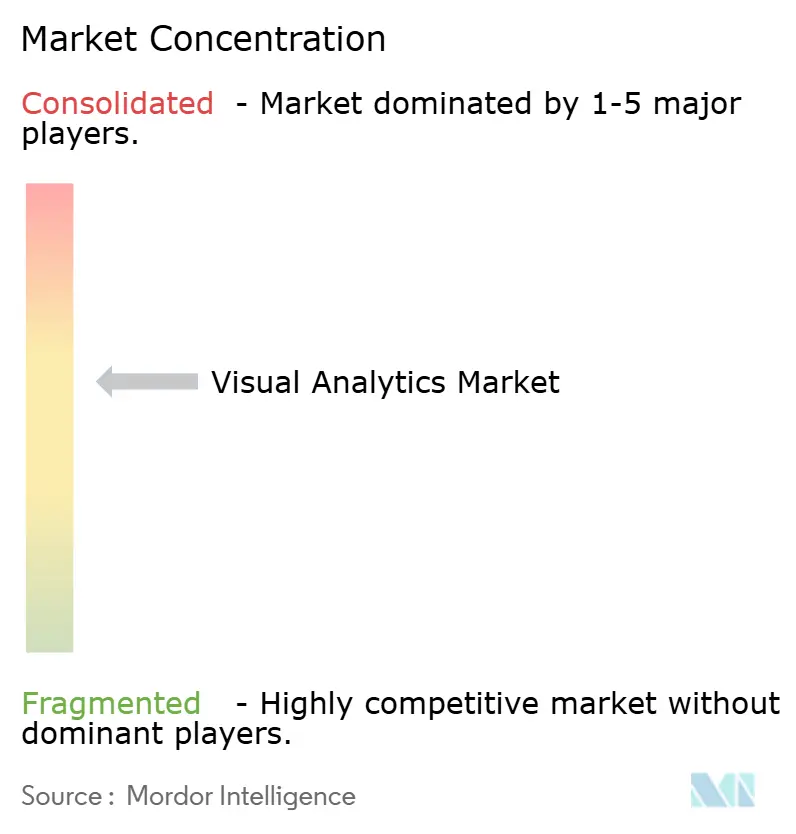
| Market Concentration | Medium |
Major Players *Disclaimer: Major Players sorted in no particular order Image © Mordor Intelligence. Reuse requires attribution under CC BY 4.0. | |
Visual Analytics Market Analysis by Mordor Intelligence
The visual analytics market size is projected to expand from USD 10.16 billion in 2025 and USD 11.86 billion in 2026 to USD 26.78 billion by 2031, registering a CAGR of 17.69% between 2026 and 2031. Spending is shifting from static dashboards to real-time, AI-augmented decisioning as organizations grapple with surging data volumes, stricter reporting mandates, and persistent skills shortages. Cloud deployment dominates because zero-copy architectures enable in-place data analysis, minimize duplication costs, and avoid vendor lock-in. Software platforms still generate the bulk of revenue, yet service engagements are accelerating as firms seek implementation guidance, semantic-layer governance, and managed operations. Vertical momentum is strongest in banking, where machine-readable filings fuel automated credit workflows, and in healthcare, where AI-ready platforms streamline clinical documentation and revenue-cycle analytics. Regionally, North America leads on the back of rising federal technology outlays, while Asia-Pacific posts the fastest growth as sovereign-AI mandates and edge-analytics projects proliferate.
Key Report Takeaways
- By deployment mode, cloud deployment captured 63.43% of the visual analytics market share in 2025, while cloud workloads are forecast to grow at an 18.49% CAGR through 2031.
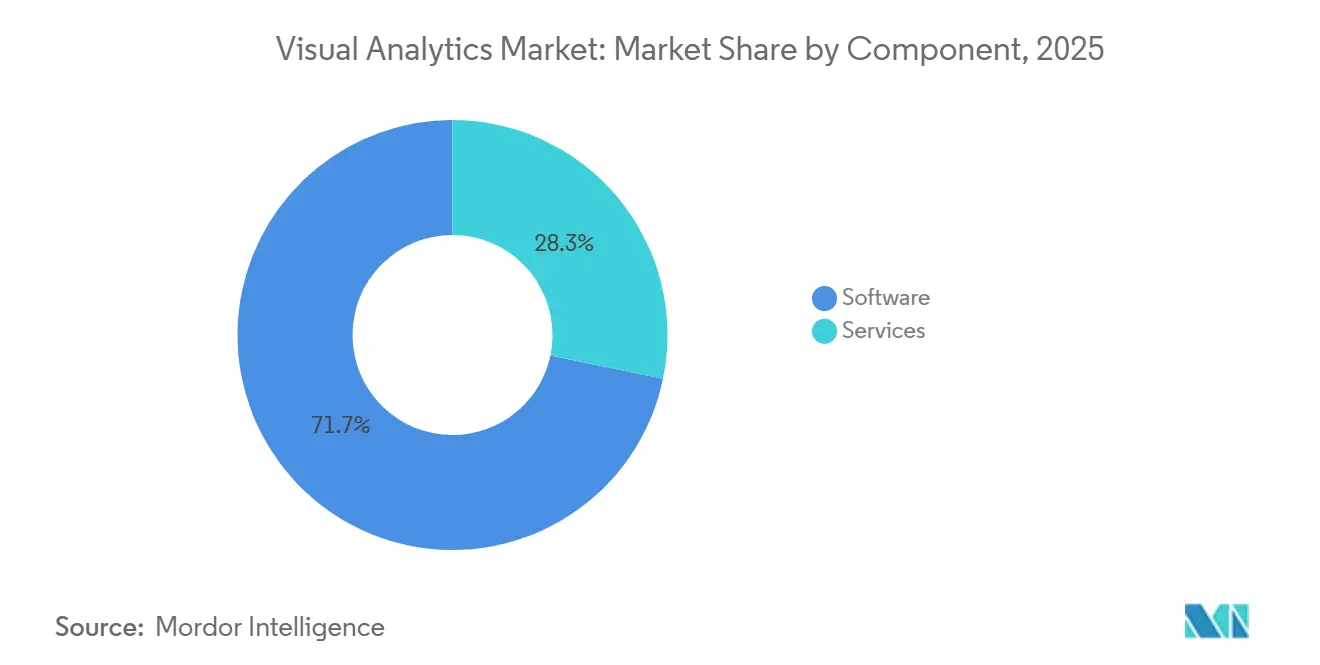
- By component, services are the fastest-growing component, advancing at a 19.49% CAGR between 2026 and 2031, although software retained 71.73% revenue share in 2025.
- By application, supply chain and logistics is projected to be the quickest-expanding application at an 18.72% CAGR, whereas sales and marketing held the largest 27.84% share in 2025.
- By organization size, small and medium enterprises are expected to grow at an 18.88% CAGR, yet large enterprises still commanded 68.31% of 2025 spending.
- By end-user industry, healthcare and life sciences are the fastest-growing, while banking, financial services, and insurance led with 21.48% of 2025 outlays.
- By geography, Asia-Pacific is the highest-growth region with a 18.69% CAGR to 2031, but North America maintained the top regional share at 38.23% in 2025.
Note: Market size and forecast figures in this report are generated using Mordor Intelligence’s proprietary estimation framework, updated with the latest available data and insights as of January 2026.
Global Visual Analytics Market Trends and Insights
Drivers Impact Analysis*
| Driver | (~) % Impact on CAGR Forecast | Geographic Relevance | Impact Timeline |
|---|---|---|---|
| Growing Cloud-Based Data Generation | +3.2% | Global, stronger in North America and Europe | Medium term (2-4 years) |
| Rising Demand for Self-Service BI Platforms | +2.8% | Global, notable in North America and Asia-Pacific | Short term (≤ 2 years) |
| Proliferation of IoT Devices Enabling Edge | +2.5% | Asia-Pacific manufacturing hubs and North America industrial sectors | Medium term (2-4 years) |
| Increasing Regulatory Reporting Requirements | +2.1% | North America and Europe, spreading to Asia-Pacific | Long term (≥ 4 years) |
| Emergence of Low-Code Visual Tools | +1.9% | Global, early uptake in North America and Western Europe | Short term (≤ 2 years) |
| Edge Analytics Adoption in Industry | +1.6% | Asia-Pacific and North America manufacturing regions | Medium term (2-4 years) |
| Source: Mordor Intelligence | |||
Growing Cloud-Based Data Generation
Enterprise data estates are expanding rapidly, with about 90% residing in unstructured silos by early 2026. Zero-copy query patterns now let users analyze that data in place, cutting extract-transform-load overhead and avoiding hyperscaler lock-in. GPU-accelerated engines accelerate unstructured analytics, while unified semantic layers merge structured and unstructured metadata, enabling projects to move from pilot to production. Hybrid architectures remain entrenched because data residency rules, latency needs, and price–performance trade-offs make single-cloud strategies risky.
Rising Demand for Self-Service BI Platforms
Organizations that emphasize user experience, governance, and executive sponsorship lift casual-user adoption from 15-25% to 40-60% within six months.[1]Daniel Mercer, “Self-Service Analytics vs Traditional BI: 2026 Decision Framework,” Promethium, promethium.ai Five-year total cost of ownership for mid-market deployments fell to USD 1.0-1.4 million in 2025, aided by consumption pricing and automated lineage. Yet 70% of projects still stall because cultural change, data quality, and training gaps outpace tooling. Federated, zero-copy designs blend local agility with centralized control, while semantic layers enforce row-level security and consistent metrics.
Proliferation of IoT Devices Driving Real-Time Analytics
More than 95% of new industrial IoT rollouts now include edge analytics, delivering sub-8-millisecond response for shop-floor decisions. Siemens’ Industrial Edge AI Suite scales models across sites and merges image data with control-system telemetry, supporting predictive maintenance and visual inspection. Standard protocols such as OPC-UA and MQTT make predictive models portable, while edge gateways buffer traffic during network outages, preserving data integrity for downstream visualization.
Increasing Regulatory Reporting Requirements
The U.S. Securities and Exchange Commission mandates machine-readable filings across 43 forms, fueling demand for visual analytics that parse XBRL and XML disclosures. Inline tagging imposes modest compliance costs, USD 2,500 annually for small firms, yet it unlocks large structured datasets that regulators and investors can query at scale. A 2024 proposal for common identifiers across eight agencies drew 140 comments, signaling wider interoperability needs and expanded addressable markets for entity-linking analytics tools.[2]U.S. Securities and Exchange Commission, “Semi-Annual Report to Congress Regarding Public and Internal Use of Machine-Readable Data,” sec.gov
Restraints Impact Analysis*
| Restraint | (~) % Impact on CAGR Forecast | Geographic Relevance | Impact Timeline |
|---|---|---|---|
| High Total Cost of Ownership for SMEs | -1.8% | Global, sharper in emerging markets and South America | Short term (≤ 2 years) |
| Data Quality and Silos Limiting Insights | -1.5% | Global, worse in legacy-heavy organizations | Medium term (2-4 years) |
| Shortage of Skilled Data-Visual Pros | -1.2% | Global, pronounced in North America and Europe | Medium term (2-4 years) |
| Vendor Lock-In Worries with Proprietary Tech | -0.9% | Global, especially in regulated sectors | Long term (≥ 4 years) |
| Source: Mordor Intelligence | |||
High Total Cost of Ownership for SMEs
Mid-market analytics projects cost USD 1.0-1.5 million over five years, with service fees and infrastructure often dwarfing license spend. Under-utilized deployments push per-user expense from USD 1,000 to USD 30,000, deterring adoption. Hidden cloud costs range from USD 1,000 to more than USD 50,000 per month, while ongoing maintenance consumes 10-15% of implementation budgets. Consumption-based Spark billing can trim 40% for bursty workloads, but SMEs still need granular usage monitoring to prevent bill shocks
Data Quality and Silos Limiting Insights
Up to 90% of enterprise information remains locked in unstructured repositories, and 41% of firms cite poor data quality as a top analytics obstacle. Healthcare exemplifies the risk, 642 data breaches in 2025 exposed 57 million records, averaging USD 10.2 million per incident. Organizations now devote 20-30% of analytics staff time to cleansing and governance, with semantic layers emerging as the control plane for metric definitions, validation rules, and masking policies.
*Our forecasts treat driver/restraint impacts as directional, not additive. The impact forecasts reflect baseline growth, mix effects, and variable interactions.
Segment Analysis
By Component: Services Gain as Governance Demands Rise
Software captured 71.73% of 2025 revenue by monetizing licenses for cloud-native BI suites, semantic modeling engines, and embedded analytics. These tools have become essential for organizations aiming to streamline decision-making processes and enhance operational efficiency. However, services are expanding at a 19.49% CAGR as enterprises increasingly demand implementation blueprints, managed operations, and data-literacy programs. These services are designed to double user adoption within six months, addressing critical skills gaps across finance, supply chain, and revenue cycle functions. Professional services typically consume USD 250,000-750,000 in mid-market projects, while outcome-based contracts tie fees to measurable KPI gains, such as 2-4-point net-collection improvements, ensuring a clear return on investment for clients.
The visual analytics services market is projected to grow faster than the software market, driven by the integration of AI-powered data-prep assistants and proactive monitoring agents. These innovations significantly reduce manual effort, enabling organizations to focus on strategic initiatives. Partnerships like Tableau Einstein Alliance and Qlik service collaborations now offer bundled solutions, including migration automation, semantic-layer design, and comprehensive training modules. These bundled offerings enhance partner stickiness, streamline deployment processes, and reduce time-to-insight, making them highly attractive to enterprises looking to accelerate their analytics capabilities.


By Deployment Mode: Cloud Dominance Accelerates with Open Formats
Cloud workloads accounted for 63.43% of 2025 spending and are forecast to compound at 18.49% through 2031 as Delta Lake, Parquet, and Apache Iceberg standardization curbs vendor lock-in. This growth is driven by the increasing adoption of cloud-native technologies that offer scalability, flexibility, and cost efficiency. Microsoft Fabric’s Direct Lake and SAP’s live Snowflake connectors illustrate a shift toward zero-copy query paths that align governance and latency needs without wholesale replication. These advancements enable organizations to streamline data processing and analytics while maintaining compliance with data governance policies. Autoscale billing for Spark workloads lowers total cost of ownership, making cloud viable for bursty analytics and experimentation, particularly in industries requiring rapid data insights.
On-premise instances persist in regulated industries and sovereign-AI deployments where data residency and air-gapped operations remain mandatory. These industries, such as healthcare, finance, and government, prioritize data security and compliance, which require on-premises solutions. Hybrid approaches hence dominate architecture roadmaps, combining the benefits of cloud scalability with the control of on-premise systems. Vendors that enable policy coordination across environments gain share because they reduce migration risk and compliance exposure. This hybrid model allows organizations to optimize their IT infrastructure while addressing specific regulatory and operational requirements.
By Application: Supply Chain Gains as IoT Fuels Visibility
Sales and marketing led with 27.84% of 2025 revenue as conversational agents in Slack and Teams delivered root-cause analysis and triggered follow-up actions. These tools have enabled businesses to streamline communication and decision-making processes, enhancing overall productivity. Yet, supply chain and logistics applications are climbing at an 18.72% CAGR as manufacturers harness edge data for predictive maintenance, cobot orchestration, and real-time inventory management. Organizations adopting AI in supply chains recorded 61% higher revenue growth versus peers, validating ROI for time-sensitive analytics and operational efficiency improvements.
Finance modules leverage machine-readable regulatory feeds to accelerate loan origination, automate compliance checks, and enhance fraud detection. Meanwhile, operations dashboards now embed write-back workflows, turning reports into in-context action centers that enable immediate corrective actions. Customer service and human resources cases also grow as natural-language queries trim search time, improve decision accuracy, and enhance employee and customer satisfaction across decentralized teams.
By Organization Size: SMEs Accelerate with Consumption Pricing
Large enterprises retained 68.31% of 2025 outlays due to global rollouts and stringent governance. These organizations often require robust solutions that can handle complex operations, ensure compliance with international standards, and provide scalability to meet growing demands. Still, small and medium enterprises (SMEs) are expanding at an 18.88% CAGR as pre-packaged semantic models, autoscale compute, and per-seat plans lower barriers to entry. These advancements make it easier for SMEs to adopt sophisticated technologies without the need for extensive in-house expertise or infrastructure. Entry bundles start at USD 3,000-5,000 per month for 10-15 users, offering a cost-effective solution for smaller organizations. Additionally, multi-year agreements can cut pricing by 15-25%, making long-term adoption more financially viable for SMEs.
The visual analytics market share for SMEs is poised to grow, as low-code tooling compresses pilot phases to 8-12 weeks and delivers measurable value within 90 days. This rapid implementation timeline allows SMEs to quickly realize the benefits of visual analytics, such as improved decision-making and operational efficiency. Vendors that automate data ingestion, lineage, and policy enforcement resonate with resource-constrained buyers, as these features reduce the need for manual intervention and streamline data management processes. By addressing the unique challenges faced by SMEs, such as limited budgets and technical resources, these solutions are driving increased adoption and market growth within this segment.

By End-User Industry: Healthcare Surges on AI Operationalization
Banking, financial services, and insurance contributed 21.48% of 2025 spending, driven by the adoption of XBRL-tagged disclosures and agentic AI solutions that streamline processes such as trade validation and compliance reporting. These advancements enable financial institutions to enhance operational efficiency and reduce errors in critical workflows. Meanwhile, the healthcare and life sciences sector is emerging as the fastest-growing segment, with 85% of providers now leveraging AI technologies, 77% actively funding generative AI projects, and denial-prediction models reducing write-offs by up to 30%.
Despite these advancements, only 1-3% of hospitals have achieved prescriptive analytics maturity, creating significant opportunities for analytics platforms that integrate clinical, claims, and supply chain data while adhering to stringent privacy regulations. Other sectors, including retail, manufacturing, public sector, and energy, are also experiencing growth as edge telemetry, sustainability mandates, and digital twin technologies expand the scope of business intelligence (BI) into operational domains. These developments are driving cross-industry demand for governed, real-time insights that enable organizations to make data-driven decisions and improve overall performance.
Geography Analysis
North America held 38.23% of 2025 revenue, supported by USD 357 billion in U.S. government technology budgets and 3,611 documented federal AI use cases. The region benefits from strong investments in cloud infrastructure, AI-driven solutions, and digital transformation initiatives across various industries. Agencies are accelerating the adoption of cloud foundations, unified data fabrics, and model-assurance tooling, favoring vendors that deliver provenance, auditability, and U.S.-hosted regions. Additionally, legacy modernization needs, Buy American stipulations, and transparency in software bill of materials amplify demand for platforms that offer verifiable sourcing and explainable outputs. The presence of major technology providers and a robust regulatory framework further strengthens the region's position in the market.
Asia-Pacific is the fastest-growing region, with a 18.69% CAGR through 2031. TSovereign AI rules, on-device inference requirements, and the increasing adoption of low-code platforms in manufacturing clusters are driving the region's growth. These factors, combined with the implementation of OPC-UA and MQTT standards, enable factory-wide predictive models and enhance operational efficiency.[3]Daniel Mercer, “Edge-to-Cloud Patterns for Industrial IoT,” bitbox.cloud Edge deployments are gaining traction as they reduce network costs and latency, while localized interfaces broaden user bases in languages such as Japanese, Korean, and Mandarin. The region's diverse industrial base, coupled with government initiatives to promote digitalization, positions it as a key growth area for the market.
Europe maintains steady momentum due to GDPR and data-sovereignty laws that cement hybrid architectures. The region's focus on data privacy and compliance drives the adoption of solutions that align with stringent regulatory requirements. Hybrid architectures, which combine on-premises and cloud-based systems, are increasingly preferred to ensure data security and operational flexibility. South America, the Middle East, and Africa are trailing but show rising interest in consumption pricing and pre-built semantic models to offset skills gaps. However, connectivity constraints and budget pressures still temper uptake in these regions. Despite these challenges, growing awareness of the benefits of AI-driven solutions and increasing investments in digital infrastructure are expected to support gradual market growth in these areas.

Competitive Landscape
Strategic moves reflect this convergence. Microsoft acquired Osmos in 2026 for self-healing pipelines, enabling automated data workflows and reducing manual intervention in data management. Qlik purchased Upsolver for Iceberg-optimized ingestion, enhancing its ability to handle large-scale data ingestion efficiently while maintaining compatibility with modern data lake architectures. Additionally, Qlik partnered with ServiceNow to embed analytics directly into workflow data fabrics, enabling organizations to seamlessly integrate data insights into their operational processes and improve decision-making. These acquisitions and partnerships highlight the growing trend of vendors consolidating their offerings to provide comprehensive solutions.
Vendor consolidation hints at a platform play, as buyers increasingly prefer integrated stacks that link ingestion, governance, exploration, and operational execution under one contract. This approach not only compresses procurement cycles but also simplifies compliance reviews, making it easier for organizations to adopt and manage these technologies. By offering end-to-end solutions, vendors aim to address the complexities of modern data ecosystems and meet their customers' evolving needs. Emerging disruptors target embedded analytics, with translytical task flows enabling in-report writeback and actions that update records, add data, call external APIs, and initiate approvals, extending BI from read-visualize to operational workflows and blurring boundaries between analytics and transactional systems.[4]Katie Murray, “Power BI March 2026 Feature Summary,” Microsoft Power BI Blog, microsoft.com
Future competition in the market will hinge on several critical factors. Autonomous data engineering capabilities will play a pivotal role, as organizations seek solutions that can automate complex data preparation and transformation tasks. Open-format compatibility will also be essential, ensuring that platforms can seamlessly integrate with diverse data sources and systems. Furthermore, tight integration between analytic agents and business applications will become increasingly important. This integration will enable insights to translate directly into system-of-record updates without requiring manual intervention, thereby streamlining workflows and enhancing operational efficiency. Vendors that can deliver on these fronts are likely to gain a competitive edge in the evolving market landscape.
Visual Analytics Industry Leaders
Microsoft Corporation
Tableau Software LLC (Salesforce, Inc.)
QlikTech International AB
SAP SE
SAS Institute Inc.
- *Disclaimer: Major Players sorted in no particular order

Recent Industry Developments
- April 2026: Qlik acquired Qloud Cover Migration technology, rebranded it as Qlik Analytics Migration Tool, and offered it free to speed transitions to Qlik Cloud.
- April 2026: Oracle Financial Services extended its agentic AI platform to corporate banking with extraction, validation, and narrative agents.
- April 2026: Microsoft Power BI April 2026 release added mobile Copilot chat, voice dictation, and Direct Lake calculated columns.
- March 2026: Microsoft Power BI March 2026 launch delivered general availability of Direct Lake and transactional task flows for in-report writeback.


Global Visual Analytics Market Report Scope
| Software |
| Services |
| On-Premise |
| Cloud |
| Sales and Marketing |
| Finance and Accounting |
| Operations |
| Supply Chain and Logistics |
| Human Resources |
| Customer Service and Support |
| Other Applications |
| Large Enterprises |
| Small and Medium Enterprises |
| Banking, Financial Services and Insurance (BFSI) |
| Retail and eCommerce |
| Healthcare and Life Sciences |
| Manufacturing |
| Information Technology and Telecommunications |
| Government and Public Sector |
| Media and Entertainment |
| Energy and Utilities |
| Transportation and Logistics |
| Other End-User Industries |
| North America | United States | |
| Canada | ||
| Mexico | ||
| South America | Brazil | |
| Argentina | ||
| Rest of South America | ||
| Europe | United Kingdom | |
| Germany | ||
| France | ||
| Italy | ||
| Spain | ||
| Rest of Europe | ||
| Asia-Pacific | China | |
| Japan | ||
| India | ||
| South Korea | ||
| Rest of Asia-Pacific | ||
| Middle East and Africa | Middle East | United Arab Emirates |
| Saudi Arabia | ||
| Rest of Middle East | ||
| Africa | South Africa | |
| Egypt | ||
| Rest of Africa | ||
| By Component | Software | ||
| Services | |||
| By Deployment Mode | On-Premise | ||
| Cloud | |||
| By Application | Sales and Marketing | ||
| Finance and Accounting | |||
| Operations | |||
| Supply Chain and Logistics | |||
| Human Resources | |||
| Customer Service and Support | |||
| Other Applications | |||
| By Organization Size | Large Enterprises | ||
| Small and Medium Enterprises | |||
| By End-User Industry | Banking, Financial Services and Insurance (BFSI) | ||
| Retail and eCommerce | |||
| Healthcare and Life Sciences | |||
| Manufacturing | |||
| Information Technology and Telecommunications | |||
| Government and Public Sector | |||
| Media and Entertainment | |||
| Energy and Utilities | |||
| Transportation and Logistics | |||
| Other End-User Industries | |||
| By Geography | North America | United States | |
| Canada | |||
| Mexico | |||
| South America | Brazil | ||
| Argentina | |||
| Rest of South America | |||
| Europe | United Kingdom | ||
| Germany | |||
| France | |||
| Italy | |||
| Spain | |||
| Rest of Europe | |||
| Asia-Pacific | China | ||
| Japan | |||
| India | |||
| South Korea | |||
| Rest of Asia-Pacific | |||
| Middle East and Africa | Middle East | United Arab Emirates | |
| Saudi Arabia | |||
| Rest of Middle East | |||
| Africa | South Africa | ||
| Egypt | |||
| Rest of Africa | |||


Key Questions Answered in the Report
How large will the visual analytics market be by 2031?
The visual analytics market size is forecast to reach USD 26.78 billion by 2031, expanding at a 17.69% CAGR from 2026 to 2031 according to Mordor Intelligence.
Which deployment mode is growing fastest?
Cloud-based deployments are projected to grow at an 18.49% CAGR as zero-copy architectures and open data formats curb lock-in.
What segment leads current spending?
Software platforms held 71.73% of 2025 revenue, though services are expanding faster as firms seek governance and managed analytics support.
Which region shows the highest growth?
Asia-Pacific is expected to post the fastest regional CAGR of 18.69% through 2031, buoyed by sovereign-AI mandates and edge analytics adoption.
Why are services gaining share?
Organizations struggle with skills gaps and governance complexity, driving demand for implementation, semantic-layer design, and managed services that grow at 19.49% CAGR.
What industries are adopting visual analytics the quickest?
Healthcare and life sciences is the fastest-growing vertical, supported by 85% AI adoption and rising investment in generative analytics to streamline clinical and revenue-cycle workflows.
Page last updated on:


