Virtual Data Room Market Size and Share
Market Overview
| Study Period | 2020 - 2031 |
|---|---|
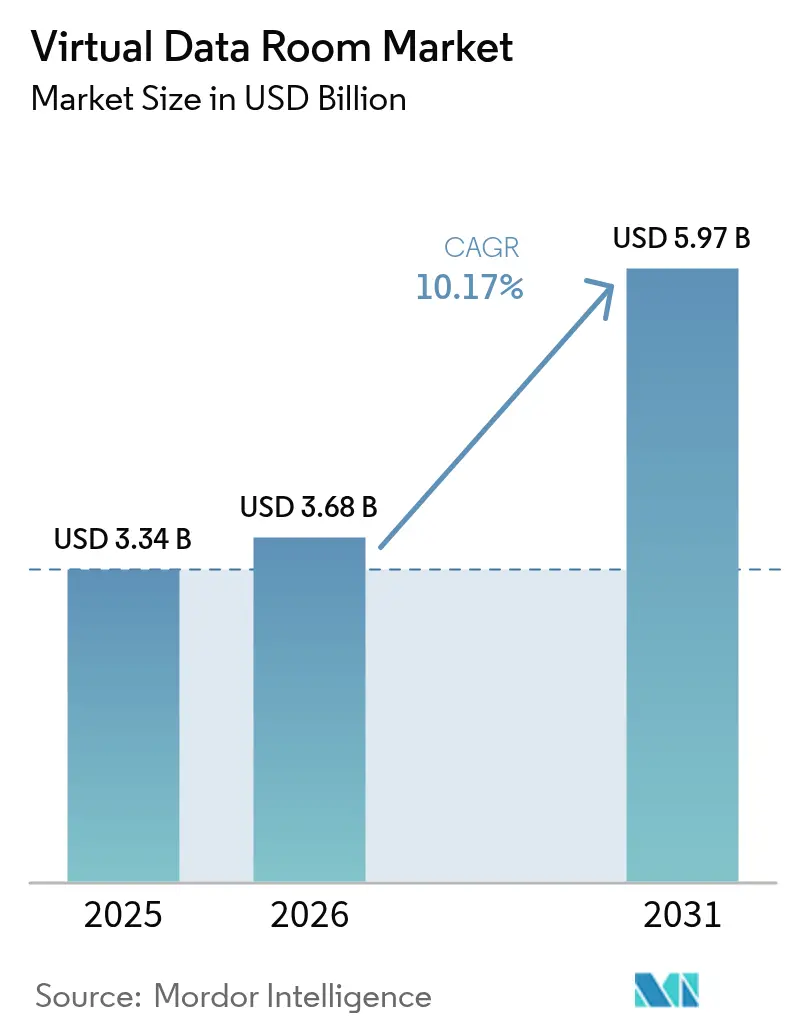
| Market Size (2026) | USD 3.68 Billion |
| Market Size (2031) | USD 5.97 Billion |
| Growth Rate (2026 - 2031) | 10.17% CAGR |
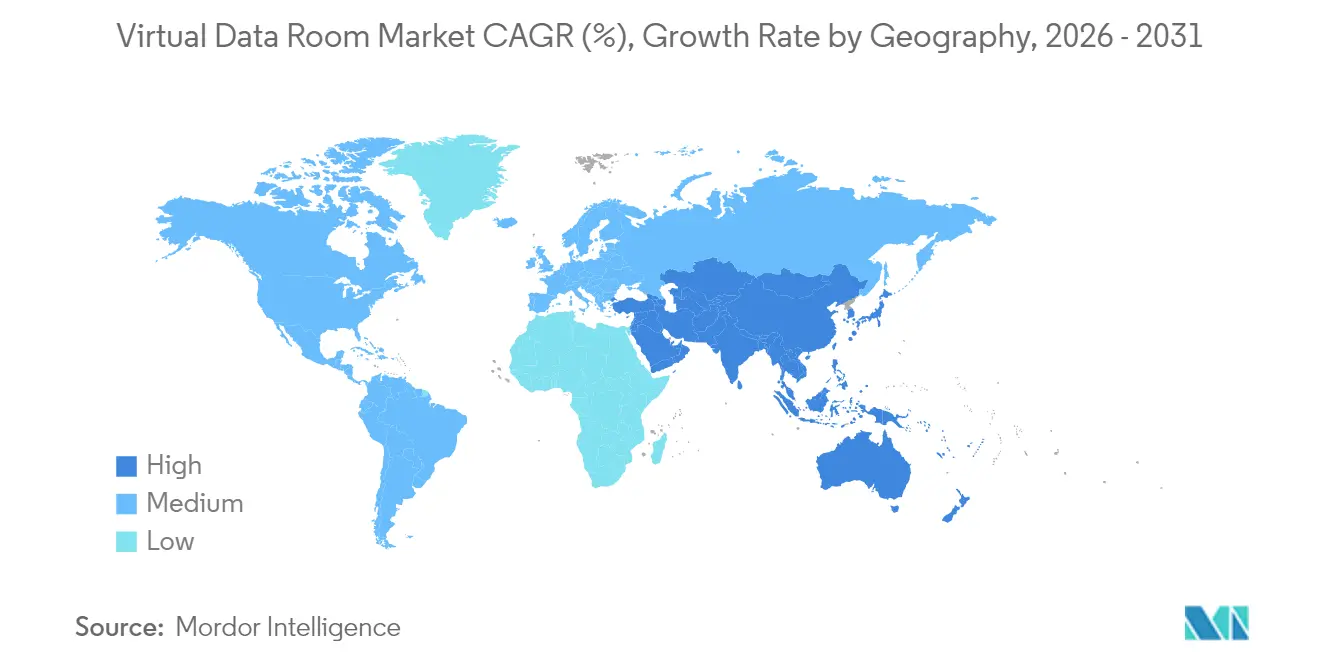
| Fastest Growing Market | Asia Pacific |
| Largest Market | North America |
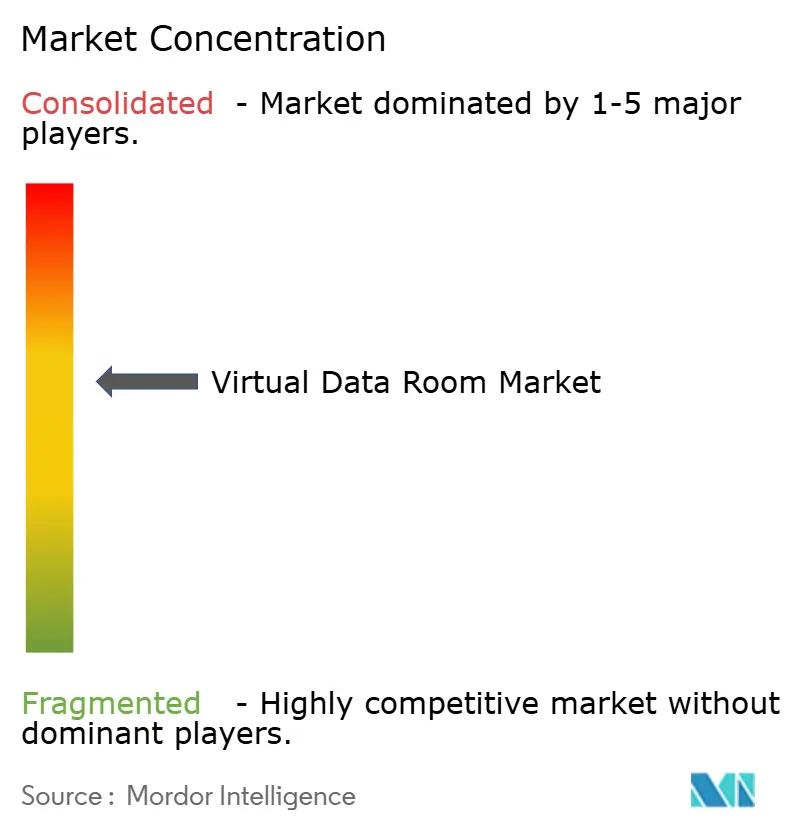
| Market Concentration | Medium |
Major Players *Disclaimer: Major Players sorted in no particular order Image © Mordor Intelligence. Reuse requires attribution under CC BY 4.0. | |
Virtual Data Room Market Analysis by Mordor Intelligence
The virtual data room market size was valued at USD 3.34 billion in 2025 and estimated to grow from USD 3.68 billion in 2026 to reach USD 5.97 billion by 2031, at a CAGR of 10.17% during the forecast period (2026-2031). Demand is expanding as enterprises accelerate the digitization of sensitive documents to meet tightening regulatory mandates and to streamline cross-border transactions.[1]European Commission, “EU Data Act Adopted,” ec.europa.eu Deals are becoming larger and more complex, pushing corporates to adopt secure, AI-enabled platforms for due diligence and post-merger integration. China’s Network Data Security Management Regulations and the EU Data Act are compelling providers to localize storage and embed granular audit trails, reinforcing market expansion in both EMEA and Asia-Pacific. Large enterprises still generate most revenue, yet SMEs are the fastest-growing buyers because subscription‐based models have fallen to USD 400–1,000 per month, removing historical cost barriers. Industry-specific functionality—such as eCTD viewers for life-sciences dossiers—adds further momentum in healthcare and biotech, the fastest-growing end-user vertical at 15.2% CAGR.
Key Report Takeaways
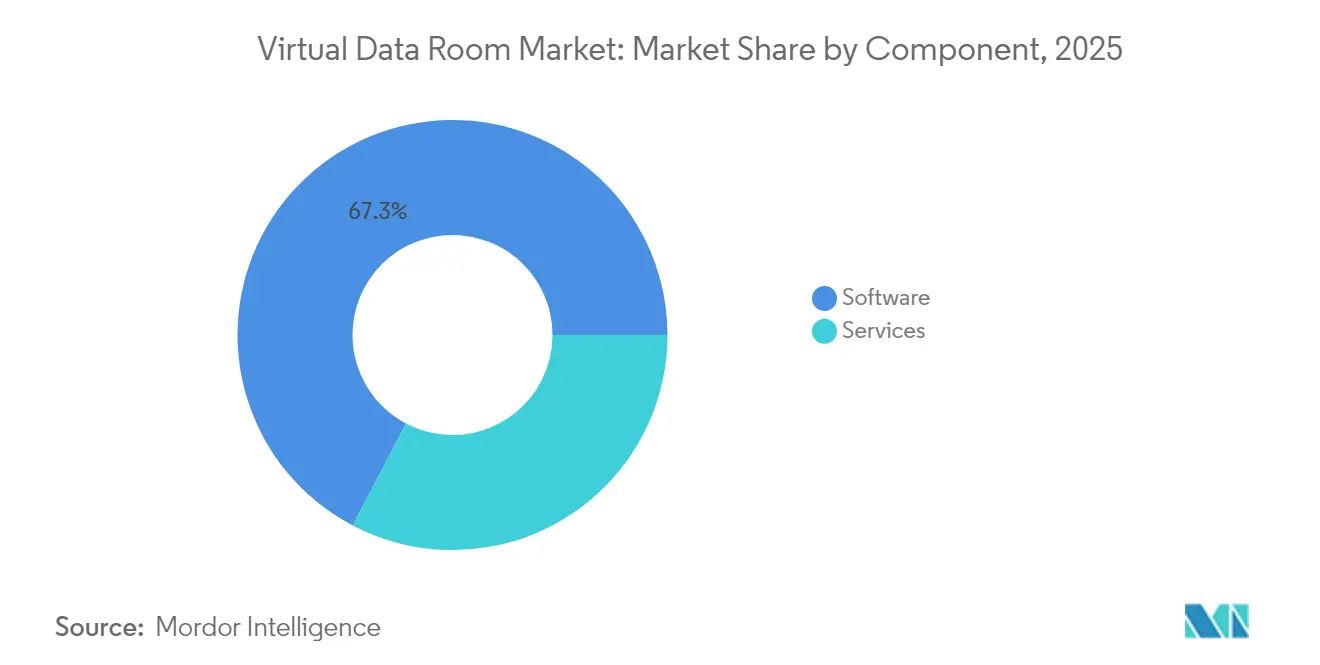
- By component, software led with 67.32% revenue share in 2025; services are projected to expand at a 13.56% CAGR through 2031.
- By deployment mode, cloud captured 82.45% of the virtual data room market share in 2025 while advancing at a 14.29% CAGR to 2031.
- By organization size, large enterprises accounted for 71.25% of the virtual data room market size in 2025; SMEs are poised to grow at 15.43% CAGR between 2026–2031.
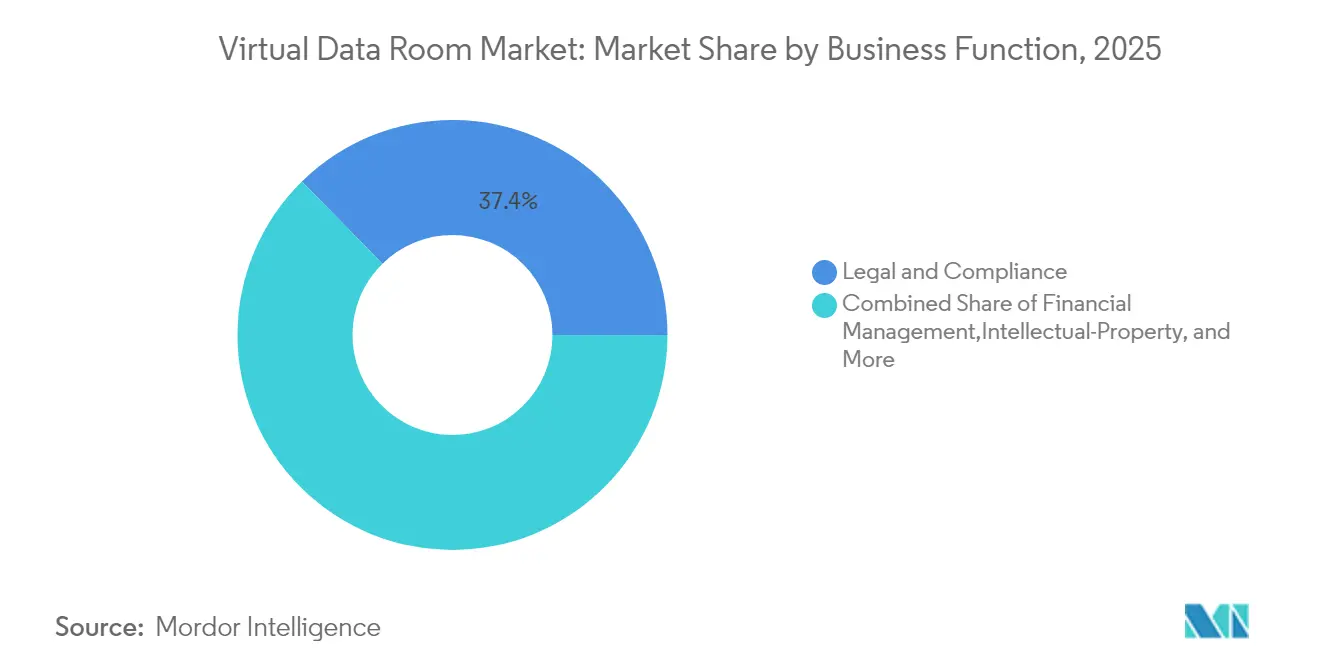
- By business function, legal & compliance dominated with 37.35% share in 2025; intellectual property management is forecast to post the fastest CAGR at 16.56% over the outlook period.
- By end-user industry, BFSI held 30.55% of 2025 revenue, whereas healthcare & life sciences will expand at a 14.88% CAGR to 2031.
- By region, North America remained the largest market with 40.62% share in 2025; Asia-Pacific is the fastest-growing region at 14.02% CAGR through 2031.
Note: Market size and forecast figures in this report are generated using Mordor Intelligence’s proprietary estimation framework, updated with the latest available data and insights as of 2026.
Global Virtual Data Room Market Trends and Insights
Drivers Impact Analysis*
| Driver | (~) % Impact on CAGR Forecast | Geographic Relevance | Impact Timeline |
|---|---|---|---|
| Accelerated Cross-border M&A Requiring Multi-jurisdiction Compliance | +2.8% | Global, with concentration in North America & EMEA | Medium term (2-4 years) |
| Demand for Remote Audit & Board Collaboration in Regulated Industries | +1.9% | Global, particularly BFSI and Healthcare sectors | Short term (≤ 2 years) |
| Rise of IP-centric Transactions in Life Sciences & TMT | +2.1% | North America, Europe, Asia-Pacific core markets | Medium term (2-4 years) |
| Adoption of Integrated AI/ML Analytics within VDR Platforms | +1.7% | Global, with early adoption in developed markets | Long term (≥ 4 years) |
| Migration from Siloed FTP/Email to Secure SaaS-based Data Rooms | +1.5% | Global, with accelerated adoption in emerging markets | Short term (≤ 2 years) |
| Source: Mordor Intelligence | |||
Accelerated Cross-border M&A Requiring Multi-jurisdiction Compliance
Cross-border deal values rose 5% in 2024 even as volumes slipped, highlighting the shift toward high-stakes transactions that must satisfy overlapping antitrust, foreign investment, and data-privacy laws.[2]Vestbee, “2024 CEE Private Equity Report,” vestbee.com New merger-control thresholds in the UAE and stricter FDI filters in Germany illustrate the maze of approvals buyers confront. India’s Digital Personal Data Protection Act requires explicit consent and country-specific processing clauses, further complicating information flows. Vendors are embedding data-sovereignty toggles and real-time regulatory checklists so deal teams can map document location, user access, and retention periods by jurisdiction.
Demand for Remote Audit & Board Collaboration in Regulated Industries
Financial institutions in Asia-Pacific are accelerating cloud migration to cut costs and modernize compliance, yet 93% cite difficulty meeting audit demands, fueling investment in secure board portals with immutable logs.[3]The Financial Brand, “Compliance Pain Points in Fintech,” thefinancialbrand.com China’s Data Security Management Measures oblige banks to classify information and document every access event, a mandate now hard-wired into enterprise-grade VDRs. Nasdaq’s patent for subsidiary governance showcases the push for multi-entity data hierarchies that streamline regulator reviews.
Rise of IP-centric Transactions in Life Sciences & TMT
Biotech licensing and AI-driven tech acquisitions hinge on safeguarding lab notebooks, genomic data, code, and patent files. DFIN’s Venue platform delivers HIPAA, GDPR, and SOC 2 Type II compliance together with eCTD viewers, setting a template for sector-specific offerings. Blockchain-anchored permission layers are emerging to secure patent exchanges, while NLP engines screen portfolios of more than 6,000 digital-identity patents for prior-art risk.
Adoption of Integrated AI/ML Analytics within VDR Platforms
Intralinks is embedding large-language-model summarization, clause extraction, and anomaly detection to shorten due-diligence cycles. Debitos introduced AI-powered search that mines unstructured content and automatically tags sensitive items, lifting productivity for distressed-asset traders. Upcoming tools such as ShareVault’s AI Redaction will mask personally identifiable information before files enter deal rooms, supporting privacy-by-design principles.
Restraints Impact Analysis*
| Restraint | (~) % Impact on CAGR Forecast | Geographic Relevance | Impact Timeline |
|---|---|---|---|
| Data-Sovereignty Rules Limiting Cross-border Hosting | -1.4% | Global, with particular impact in EU, China, and emerging markets | Medium term (2-4 years) |
| Persistent User Mis-configuration Driving Security Breaches | -0.9% | Global, with higher impact in SME segments | Short term (≤ 2 years) |
| High Subscription Costs for SME One-off Projects | -1.2% | Global, with concentration in emerging markets | Short term (≤ 2 years) |
| Vendor-switching & Commoditization Pressure on Pricing | -0.8% | Mature markets, particularly North America and Europe | Long term (≥ 4 years) |
| Source: Mordor Intelligence | |||
Data-Sovereignty Rules Limiting Cross-border Hosting
Conflicts between the EU’s GDPR and the US CLOUD Act force multinationals to compartmentalize storage or risk enforcement action, driving providers to open regional data centers in Germany, Japan, and Australia. China’s Trusted Data Space blueprint similarly restricts outbound transfers, raising capex for infrastructure duplication. German SMEs must also meet NIS-2 and DORA cybersecurity controls, adding compliance overhead that influences provider selection.
Persistent User Mis-configuration Driving Security Breaches
Advanced permission sets can overwhelm non-technical staff, causing inadvertent exposure. Patent filings for granular, role-based controls underscore the search for user-friendly safeguards that lock down defaults and apply searchable encryption to limit fallout when credentials leak. Providers are rolling out guided setup wizards and real-time permission checkers to cut error rates, a critical adoption lever in the SME segment.
*Our forecasts treat driver/restraint impacts as directional, not additive. The impact forecasts reflect baseline growth, mix effects, and variable interactions.
Segment Analysis
By Component: Services Segment Expands amid Software Core
Software anchored 67.32% of revenue in 2025, underscoring its status as the backbone of the virtual data room market. The services component, however, is scaling faster at 13.56% CAGR as clients seek regulatory consulting, AI analytics, and integration support. Large accounts increasingly bundle platform licenses with workflow-design projects, mirroring SS&C’s revenue uplift to USD 4.84 billion in 2024. Government tenders such as the UK’s USD 6.5 billion G-Cloud 14 are also specifying managed services, validating a shift from pure software delivery to outcome-based engagements.
Demand for premium services rises when transactions span privacy regimes, prompting vendors to position specialized teams that configure data-residency rules, retention schedules, and AI-driven redaction models. As a result, implementation consulting, workflow automation, and on-call compliance advisory are expected to command over 30% of incremental market spend by 2031. The services stream therefore acts as a hedge against price pressure in core licensing, reinforcing revenue diversity for established players.


By Deployment Mode: Cloud Ascendancy with Security Guardrails
Cloud delivery captured 82.45% of 2025 revenue and exhibits the highest growth pace at 14.29% CAGR, signalling market consensus that hyperscale infrastructure can now satisfy bank-grade controls. Per-gigabyte fees—ranging from USD 60–77 per month—still influence heavy-data users, but flat-rate options at USD 400–1,000 monthly encourage midsize buyers to migrate. Sovereignty clauses are steering some clients to hybrid setups where sensitive archives stay on-premise while analytics compute bursts into the cloud.
Providers invest in multi-tenant encryption and customer-managed keys so that regulators accept cloud as an equivalent or superior control environment. The global build-out of public-cloud regions creates proximity that slices latency while satisfying residency statutes, accelerating adoption in geographically dispersed deal teams. As technological confidence mounts, legacy on-premise installations are expected to shrink below 10% of the virtual data room market by 2031.
By Organization Size: SMEs Accelerate under Flexible Pricing
Large enterprises retained 71.25% of 2025 spend, yet SMEs will post a 15.43% CAGR to 2031, outpacing every other cohort. Subscription models as low as USD 15 per user per month democratize access, while wizard-based setup trims onboarding to hours rather than weeks. Germany’s Mittelstand illustrates this pivot, where firms adopt VDRs to meet NIS-2 and DORA rules without building costly in-house infrastructure.
Enterprise requirements nevertheless steer innovation. Patented board-portal hierarchies and AI anomaly detection debut in large accounts before filtering to SME packages, creating a virtuous cycle where mass adoption funds further R&D. Occasional-use clients increasingly select virtual data room market size offerings bundled as “transaction packs,” providing fixed-term access without ongoing commitments, a model anticipated to lift SME penetration beyond 30% of active rooms by 2031.
By Business Function: IP Management Gains Momentum
Legal & compliance functions held 37.35% share in 2025, cementing their role as the anchor use case. Intellectual property management, however, is forecast to grow 16.56% CAGR, reflecting the monetization of patents and data assets in tech and life-sciences deals. Blockchain-secured audit trails and NLP-driven prior-art searches now ship as standard in premium plans, reducing diligence cycles for portfolios exceeding 1,000 patents. Financial management tasks—fundraising, restructurings, and divestitures—continue to fuel steady volume, backed by a projected 2–5% uplift in Americas M&A flows during 2025.
By End-user Industry: Healthcare & Life Sciences Outpaces BFSI Growth
BFSI occupied the top revenue slot at 30.55% in 2025 thanks to regulatory intensity and high-value restructurings, yet healthcare & life sciences will expand the fastest at 14.88% CAGR to 2031. Venue’s eCTD viewers and ShareVault’s BIO partnership illustrate the requirement for FDA-ready audit trails and granular role permissions. Government and legal services also present upside, as evidenced by the USD 6.5 billion G-Cloud 14 budget earmarked for secure document services.
Geography Analysis
North America generated 40.62% of 2025 revenue, supported by deep capital markets, robust private equity activity, and well-defined disclosure laws. The virtual data room market size for the region is buoyed by repeat buyers in energy, healthcare, and technology sectors that execute multi-deal pipelines annually. SS&C’s rise to USD 4.84 billion revenue in 2024 underscores this demand.
Europe is gaining momentum as M&A recoveries accelerate post-pandemic, with expected 10% volume growth in 2025. The EU Data Act adds interoperability obligations that favor vendors with API-rich platforms and in-region storage nodes. Germany’s heightened FDI scrutiny and mid-cap private equity rebound create use cases where VDR-enabled real-time Q&A and redaction speed closing timelines.
Asia-Pacific posts the highest CAGR at 14.02%. China’s Financial Technology Development Plan and data-security regulations compel domestic hosting, prompting global providers to establish joint ventures and sovereign clouds. Japan’s LegalTech-led services for electronics supply chains highlight localized innovation that addresses industry-specific compliance. India’s new data-privacy law drives adoption in tech and pharma cross-border deals, cementing APAC’s role as a growth engine through 2031.

Regulatory Landscape
Regulation for virtual data rooms (VDRs) is being shaped by the convergence of privacy, data-sovereignty, and operational-resilience requirements that treat VDRs as critical ICT infrastructure for regulated workflows rather than simple file sharing. In the EU, the Digital Operational Resilience Act (DORA) entered full enforcement in January 2025. This raises expectations around ICT risk management, incident reporting, and oversight of third-party technology providers used by financial entities, increasing the emphasis on provable audit trails, access governance, and third-party control evidence within VDR implementations.
Data-localization and sector rulebooks are also tightening configuration requirements for cross-border deals and regulated digital-asset activity. The UAE Virtual Assets Regulatory Authority (VARA) Rulebooks require Virtual Asset Service Providers to maintain a cybersecurity policy (with defined review and accountability) and align data-protection controls with UAE requirements, reinforcing demand for secure collaboration environments with controlled access, retention, and monitoring. In capital-markets workflows, Euronext guidance around maintaining IPO data room compliance with AMF/Euronext expectations reinforces the need for disciplined permissions, disclosure controls, and traceable logs that support issuer and advisor obligations during protracted, multi-party listing processes.
Value Chain Analysis
The VDR value chain starts with core platform engineering and security design, including encryption, identity and access management, audit logging, and data-residency controls. It also depends on cloud and infrastructure choices that support regional hosting and performance for distributed deal teams. On top of the software layer, vendors and channel partners deliver implementation services that configure room structure, role-based permissions, watermarking, retention schedules, and regulatory reporting outputs for use cases such as M&A, refinancing, litigation, and regulated board or audit reviews. This service layer has become a differentiator as customers seek packaged compliance configurations and integration support, not standalone licenses.
Downstream, distribution and demand are influenced by legal, financial advisory, and specialist technology partners that embed VDRs into diligence and document-production workflows. Integration partnerships are increasingly central to the chain, linking VDR platforms to AI and legal-review tools so firms can analyze live deal content without exporting sensitive files. Examples across 2025-2026 include partnerships and integrations involving ShareVault with the Alliance of M&A Advisors (AM&AA), SmartRoom with Docufi.ai, and AI workflow vendors integrating with established VDR platforms (for instance, Harvey integrations with Datasite and SS&C Intralinks) to bring transaction data into drafting, research, and diligence workflows under controlled access.
Competitive Landscape
The virtual data room market shows moderate concentration: the top five providers collectively control about 55–60% of global revenue. Leaders defend share through AI feature rollouts, regional data-center expansion, and vertical partnerships. SS&C continues bolt-on acquisitions and cross-selling across fund administration, leveraging Intralinks to upsell data rooms into its investor-services base.
Specialists pursue niche depth. ShareVault tailors life-sciences templates and wins association endorsements such as BIO, embedding itself early in biotech pipelines. Debitos targets non-performing loan exchanges with AI search tuned for distressed-asset documentation. Patent filings reveal defense in depth: Seagate’s searchable encryption and Palantir’s real-time permission engines indicate continuous security R&D.
Pricing pressure remains a threat as commoditization sets in for baseline capabilities. Vendors counter with service bundles, outcome-based pricing, and edge features like AI redaction. Government procurement frameworks such as G-Cloud 14 open large contract pools but demand rigorous certification, influencing roadmaps toward ISO 27001, FedRAMP, and sovereign cloud options.
Virtual Data Room Industry Leaders
Vault Rooms Inc.
Citrix Systems Inc.
Drooms GmbH
ShareVault (Pandesa Corporation)
EthosData
- *Disclaimer: Major Players sorted in no particular order

Market Opportunities and Future Outlook
Opportunities are expanding as VDRs move from point-in-time transaction tools to persistent compliance and governance infrastructure, especially in regulated industries that require immutable auditability and third-party oversight alignment. DORA enforcement from January 2025 has sharpened requirements around operational resilience and ICT third-party controls in financial services, which is pushing buyers to emphasize provable logging, incident-response readiness, and vendor oversight documentation within VDR deployments. Multi-jurisdiction data-sovereignty requirements (EU, China, India) also continue to drive demand for in-region hosting options and configurable residency controls, creating whitespace for providers that can standardize regional deployments with policy-based access, retention, and reporting.
Deal complexity in technology, media, and telecom (TMT) and other IP-heavy sectors supports higher-value VDR use cases that combine security with integrated analytics and automation. Large, documented transaction activity also creates direct usage pull: SEC-filed agreements such as the February 2026 Paramount Skydance and Warner Bros. Discovery definitive merger agreement and the June 2026 Fox and Roku definitive agreement reflect the scale of diligence and stakeholder coordination that benefits from structured Q&A, controlled document circulation, and defensible audit trails. At the product level, the shift toward embedded AI (classification, summarization, and redaction) and tighter governance of AI-enabled workflows gives vendors a pathway to differentiate through integrated controls and partnerships that keep sensitive diligence data inside the governed VDR boundary rather than in unmanaged exports.
Recent Industry Developments
- July 2026: Citrix announced NetScaler MCP Gateway capabilities to provide unified governance for LLM and agentic AI traffic. The move targets enterprise requirements to control and observe AI-driven access paths, strengthening secure access architectures that often sit alongside or in front of sensitive collaboration environments.
- June 2026: Drooms announced that EOS Partners became the majority shareholder of the company while CEO Alexandre Grellier continued to lead the business. The transaction supports a new phase of investment capacity for product development and expansion in regulated, sovereignty-conscious European data room use cases.
- March 2025: Drooms launched its AI Assistant within its secure platform, positioned to reduce manual effort in real-asset transactions by up to 50%. Embedding AI into the core workflow increases competitive pressure on baseline VDR offerings and raises buyer expectations for native productivity features without weakening auditability.


Research Methodology Framework and Report Scope
Market Definition and Coverage
For this study, the market covers revenues earned from virtual data room (VDR) software used to securely store, manage, and share confidential documents with permission controls and audit trails, usually for time-bound and compliance-heavy workflows such as due diligence and regulated reviews.
Scope exclusions: We do not count generic file sharing or collaboration tools that lack VDR-grade controls like granular permissions, tamper-resistant versioning, and deal-ready audit logging.
Segmentation Overview
- By Component
- Software
- Services
- By Deployment Mode
- Cloud-based
- On-premise
- By Organization Size
- Small and Medium Enterprises (SMEs)
- Large Enterprises
- By Business Function
- Legal and Compliance
- Financial Management (MandA, Fund-raising, Restructuring)
- Intellectual-Property Management
- Sales and Marketing/ Channel Partnerships
- Other Business Function
- By End-user Industry
- BFSI
- IT and Telecom
- Healthcare and Life Sciences
- Government, Public Sector and Legal Services
- Other End-user Industries
- By Geography
- North America
- United States
- Canada
- Mexico
- Europe
- United Kingdom
- Germany
- France
- Rest of Europe
- Asia-Pacific
- China
- Japan
- India
- Rest of Asia-Pacific
- South America
- Brazil
- Argentina
- Rest of South America
- Middle East
- GCC
- Turkey
- Rest of Middle East
- Africa
- South Africa
- Nigeria
- Rest of Africa
- North America
Data Sources, Market Sizing, and Validation
Desk Research
Desk work starts with building the market boundary and the demand context, before any modeling is done. We refer to public sources such as the US SEC filings database, US Census and Bureau of Economic Analysis time series, Eurostat digital economy indicators, OECD ICT and enterprise adoption datasets, and privacy and data-protection updates from government and regulator sites.
To keep assumptions realistic, we also review vendor websites and product documentation for feature thresholds that separate VDRs from basic file sharing, along with annual reports, earnings decks, and reputable press coverage for pricing cues and customer use cases. Where needed, a paid company financials and intelligence subscription and a patent database subscription are used to cross-check entity-level revenue direction and product investment signals. These examples are illustrative only, and many other public sources were also used for data collection, validation, and clarification.
Primary Interviews and Surveys
Primary inputs are collected through expert interviews and structured surveys with VDR providers, channel and implementation partners, and buying-side users such as corporate development teams, legal and compliance functions, investment advisors, and real estate transaction teams. Since this is a global market, we make sure coverage spans APAC, EMEA, and the Americas so regional deal activity and deployment preferences can be validated and then reflected in the model.
Distribution of primary research fieldwork respondents
| Company type | Respondent position | Region |
|---|---|---|
| Top tier: 25% | CXOs: 12% | APAC: 53% |
| Mid tier: 58% | Functional/Unit leaders: 29% | EMEA: 29% |
| Smaller Players: 17% | Managers: 59% | Americas: 18% |
Market-Sizing & Forecasting
Sizing is built using a top-down approach where deal and compliance-related document-sharing needs are converted into an addressable software spend pool, and then adjusted for VDR adoption in each major region. The key inputs include M&A and capital-raising activity levels, the share of cross-border transactions, the frequency of audit and regulatory reviews in document-heavy industries, cloud versus on-premise preference, and observed subscription price bands for VDR usage.
Those totals are then corroborated with selective bottom-up checks, such as sampled price times expected active-room volumes and supplier revenue reasonableness checks from public disclosures and interview feedback, which helps us avoid overstating smaller use cases. When a sub-segment has limited disclosures, gaps are handled through proxy ratios anchored to transaction intensity and organization count, and then confirmed through primary feedback. For forecasting, scenario analysis is used so the base case reflects expected transaction cycles and compliance intensity, and the final curve is tuned using expert consensus on adoption pace and pricing progression.
Data Validation & Update Cycle
Validation is done by comparing model outputs against independent signals, and then investigating any large variances before sign-off. We run consistency checks across regions and time, re-check unit economics like implied price per active room, and confirm that growth rates align with the underlying activity indicators used in the build.
A multi-step review is followed so assumptions, math, and narrative logic are checked by more than one analyst. If a material event occurs, such as a major regulatory change or a sharp shift in deal activity, we re-contact selected experts to confirm directional impact and update key inputs. Reports are refreshed annually, and a final pre-delivery pass is completed so clients receive the latest updated view.
Mordor Intelligence's Virtual Data Room Market Estimate Compared With Other Published Estimates
Published market values for VDRs can look far apart because each study draws the line differently on what qualifies as a virtual data room, and because forecast horizons and pricing assumptions do not always match.
The biggest gaps usually come from scope and counting rules, such as whether basic file-sharing tools are included, whether adjacent compliance collaboration modules are treated as part of VDR revenue, and which year is used for currency conversion and inflation assumptions. Deal activity signals and subscription price bands are also handled differently, which can change the implied number of active rooms and the revenue per room used in the final totals.
Benchmark comparison
| Source | Market Size | Gaps in Research Methodology |
|---|---|---|
| Mordor Intelligence | USD 3.34 B (2025) | |
| Industry Publisher A | USD 3.40 B (2025) | Scope appears broader on inclusion rules, with no clear exclusion of generic file sharing tools, which can pull in revenue that is not tied to audited, permissioned deal-room workflows. |
| Global Consultancy B | USD 2.83 B (2025) | The estimate is built from a different base-year chain and may apply a narrower near-term adoption curve, which can reduce the implied active-room volumes used to translate deal activity into software revenues. |
Deal volume indicators and observed subscription price ranges are the practical checks that keep Mordor Intelligence tied to a defined VDR demand pool, so the final value is not inflated by non-VDR file sharing spend. Taken together, the table suggests that most of the spread is explained by product boundary choices and near-term adoption or pricing ramps, which are items a buyer should confirm before using any single number for planning.


Key Questions Answered in the Report
What is the projected size of the virtual data room market by 2031?
The virtual data room market is expected to reach USD 5.97 billion by 2031, based on a 10.17% CAGR from its 2025 baseline of USD 3.34 billion.
Which region will grow the fastest over the forecast period?
Asia-Pacific leads with a 14.02% CAGR driven by China’s data-security mandates and a surge in technology and life-sciences M&A.
Why are SMEs adopting VDRs at a higher rate than before?
Subscription pricing starting at USD 15–250 per user monthly and simplified cloud deployment have removed cost and complexity barriers for smaller firms.
How are AI tools reshaping VDR functionality?
Integrated AI performs clause extraction, risk scoring, and automated redaction, cutting diligence time and enhancing compliance for complex transactions.
What is the biggest regulatory driver influencing VDR demand in Europe?
The EU Data Act, effective September 2025, imposes data-sharing and interoperability duties that require secure, auditable platforms.
Which end-user industry is forecast to expand the quickest, and why?
Healthcare & life sciences will grow at 14.88% CAGR because of specialized requirements for clinical trial data, eCTD submissions, and IP licensing.
Page last updated on:


