Virtual Fitness Market Size and Share
Market Overview
| Study Period | 2020 - 2031 |
|---|---|
| Market Size (2026) | USD 38.81 Billion |
| Market Size (2031) | USD 109.36 Billion |
| Growth Rate (2026 - 2031) | 23.02% CAGR |
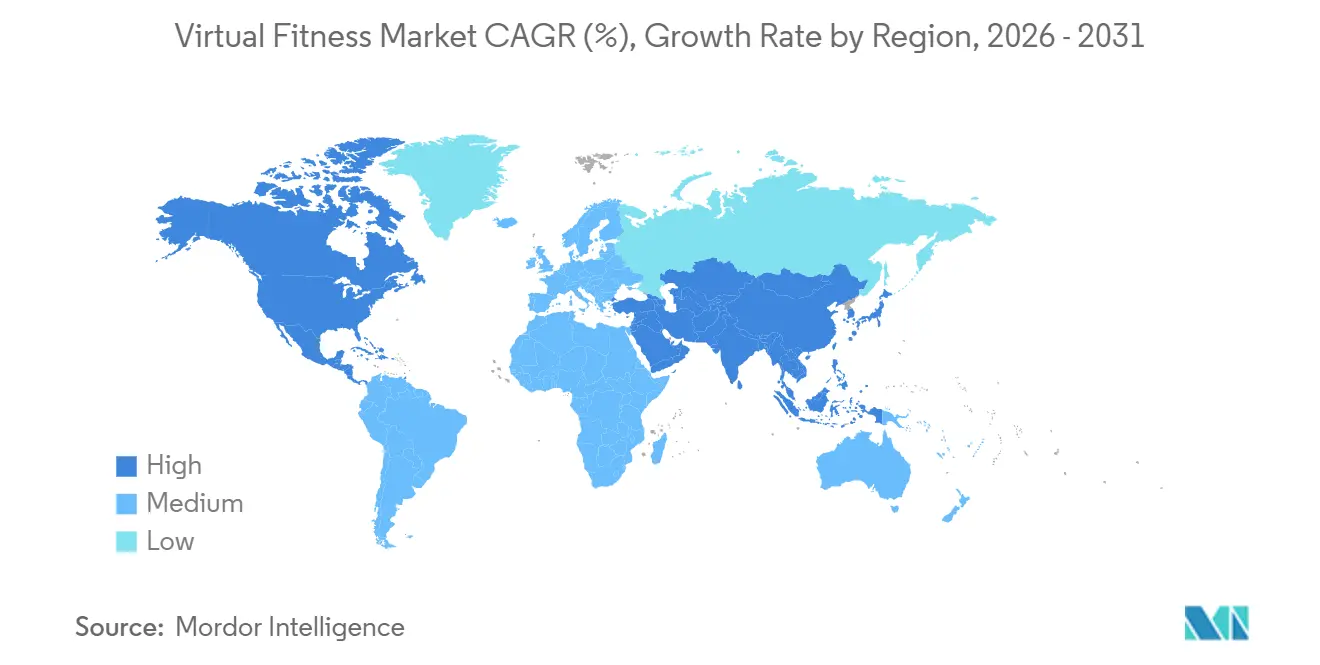
| Fastest Growing Market | Asia Pacific |
| Largest Market | North America |
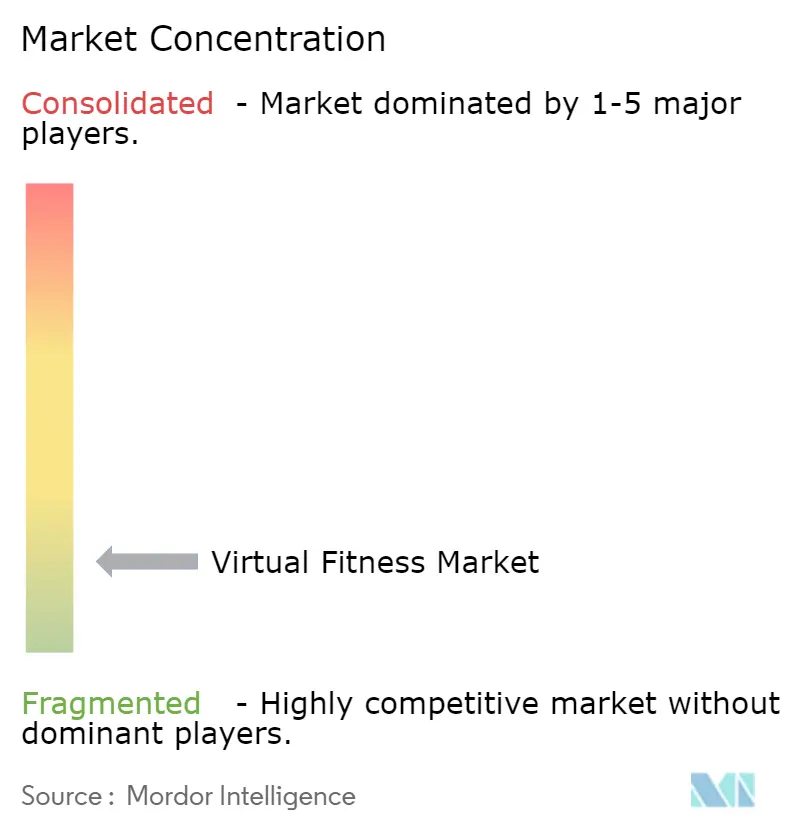
| Market Concentration | Low |
Major Players *Disclaimer: Major Players sorted in no particular order Image © Mordor Intelligence. Reuse requires attribution under CC BY 4.0. | |
Virtual Fitness Market Analysis by Mordor Intelligence
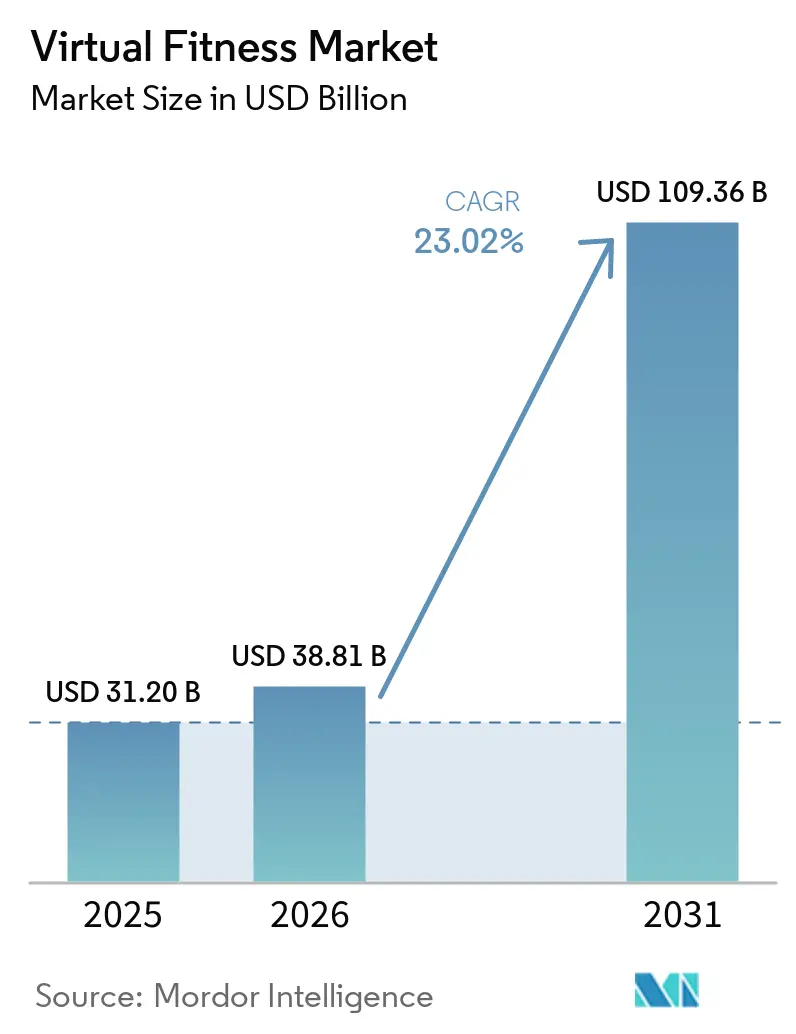
The virtual fitness market size was valued at USD 31.2 billion in 2025 and estimated to grow from USD 38.81 billion in 2026 to reach USD 109.36 billion by 2031, at a CAGR of 23.02% during the forecast period (2026-2031). Structural changes in telehealth regulations, steady expansion of enterprise wellness mandates, and rapid gains in AI-powered coaching engines are lifting overall demand. The maturation of 5G networks is removing latency barriers, which, in turn, is shifting consumer preferences from passive videos to live, interactive classes. Consolidation among software providers, hardware makers, and content marketplaces is reshaping competitive strategies, while payers now reimburse virtual physical therapy, expanding the platform's addressable base. Over the forecast horizon, the virtual fitness market is expected to benefit from immersive gamification that attacks the industry’s chronic retention challenge by rewarding consistency rather than volume.
Key Report Takeaways
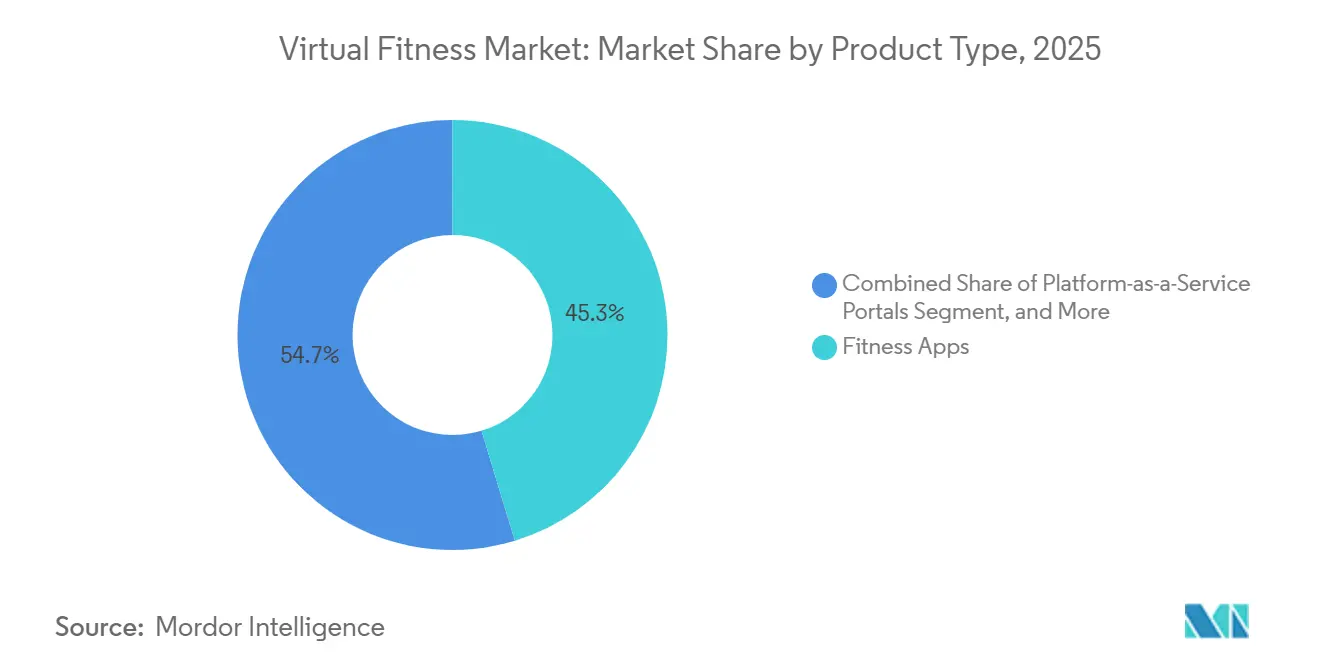
- By product type, fitness apps commanded 45.31% of the virtual fitness market share in 2025, whereas VR and AR fitness titles are forecast to expand at a 24.02% CAGR through 2031.
- By delivery mode, on-demand video libraries led with 57.89% of revenue in 2025, while live-interactive streaming is projected to grow fastest at a 23.62% CAGR to 2031.
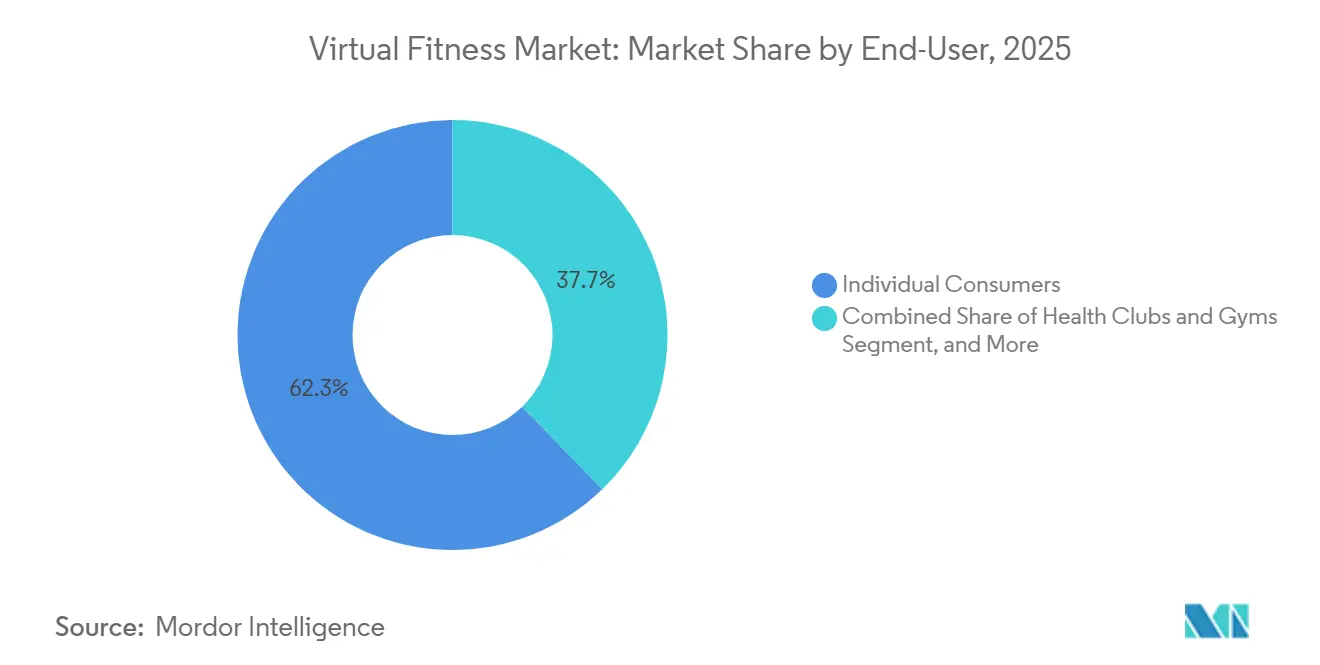
- By end user, individual consumers represented 62.27% of spending in 2025, whereas healthcare and rehabilitation clinics are forecast to post a 23.82% CAGR during 2026-2031.
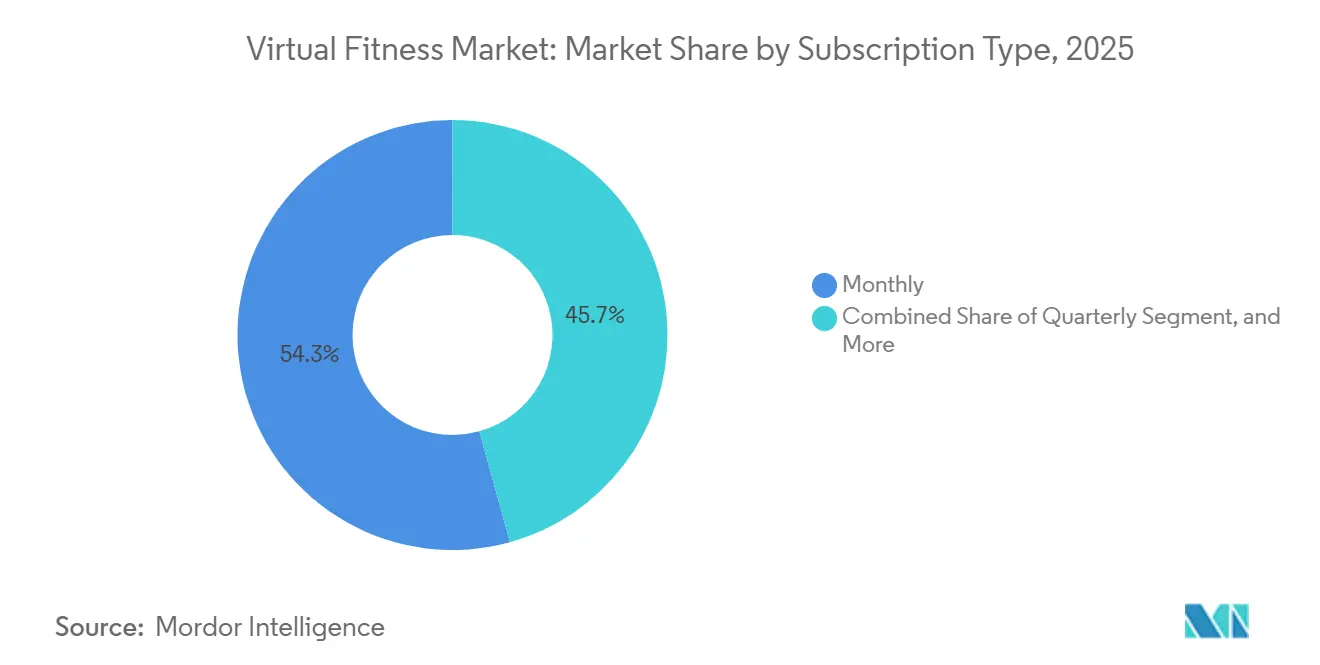
- By subscription type, monthly plans accounted for 54.32% of 2025 revenue, yet pay-per-class and freemium upgrade options are projected to grow at a 23.42% CAGR through 2031.
- By device type, smartphones and tablets captured 49.14% of revenue in 2025, while VR and AR head-mounted displays are expected to expand fastest at a 23.83% CAGR over the same period.
- By technology, video streaming accounted for 55.91% of revenue in 2025, whereas VR and AR immersion are anticipated to record the highest growth at a 24.11% CAGR through 2031.
- By geography, North America accounted for 41.36% of 2025 revenue, but Asia-Pacific is projected to register the highest regional growth at a 24.04% CAGR through 2031.
Note: Market size and forecast figures in this report are generated using Mordor Intelligence’s proprietary estimation framework, updated with the latest available data and insights as of January 2026.
Global Virtual Fitness Market Trends and Insights
Drivers Impact Analysis*
| Driver | (~) % Impact on CAGR Forecast | Geographic Relevance | Impact Timeline |
|---|---|---|---|
| Accelerated Hybrid Fitness Adoption Post-COVID | +4.5% | Global, with strongest uptake in North America and Europe | Medium term (2-4 years) |
| Expanding Corporate Wellness Budgets | +3.2% | North America, Western Europe, Asia-Pacific urban centers | Medium term (2-4 years) |
| Integration of Wearables With Subscription Ecosystems | +4.8% | Global, led by North America and Asia-Pacific | Long term (≥ 4 years) |
| Surge in 5G-Enabled High-Definition Streaming | +3.7% | Asia-Pacific core, North America metro areas, Middle East | Short term (≤ 2 years) |
| Emergence of AI Motion-Tracking for Real-Time Form Correction | +2.9% | Global, early adoption in North America and Europe | Medium term (2-4 years) |
| Increasing Payer Reimbursement for Virtual Cardiac Rehab | +2.1% | North America, Western Europe | Long term (≥ 4 years) |
| Source: Mordor Intelligence | |||
Accelerated Hybrid Fitness Adoption Post COVID
Hybrid access, which blends in-person sessions with digital content, has become a baseline expectation rather than a premium perk. Large employers reported a 70% wellness-program adoption rate in 2024, and 41% intended to increase spending, but transaction data show dollars shifting from gym reimbursements to integrated digital platforms that offer measurable engagement. Virtual operators achieved 27% annual churn in 2023, meaningfully better than big-box gyms, thanks to mobile touchpoints that extend engagement beyond limited on-site hours. Members who complete three or more sessions per week maintain 85-90% retention, motivating platforms to embed AI nudges that increase frequency. Incumbent chains are redesigning facilities to accommodate always-connected members and to preserve lifetime value.
Expanding Corporate Wellness Budgets
Wellness spending is bifurcating; self-insured enterprises are increasing allocations to digital programs, while smaller firms are pulling back amid macro headwinds. Unified ecosystems that merge home workouts, on-site gyms, and wearable data into a single dashboard are now procurement criteria, which favors platforms with robust API stacks. The USD 7.5 billion Mindbody-ClassPass-EGYM merger in January 2026 demonstrates how consolidated vendors can court both enterprise and consumer revenue under a single invoice. Lower-end corporate buyers instead gravitate to freemium or pay-per-class formats, fragmenting demand at the bottom of the pyramid.
Integration of Wearables With Subscription Ecosystems
Global wearable shipments are on track to reach 612.5 million units by 2028, turning these devices into primary data pipelines for personalized coaching. Apple, which controls over 50% of the smartwatch segment, linked Strava workouts directly into Apple Fitness+ feeds in January 2025, offering three-month trials to convert social users into paying subscribers. Garmin brought Google Health Connect support in July 2025, whereas Whoop enabled two-way Apple Health sync to refine recovery-based prescriptions. Integration costs can run to USD 500,000 for medical-grade builds, yet early movers are locking in proprietary data loops that rivals struggle to displace.[1]Apple Inc., “Strava Workouts Now Sync with Apple Fitness+,” apple.com
Surge in 5G-Enabled High-Definition Streaming
Sub-200-millisecond latency achieved over 5G networks is transforming classes into fully interactive coaching sessions. Verizon’s Connected Athletes pilot verified that coaches could modify intensity mid-session without perceptible lag, a shift impossible on 4G. Studios now use edge CDNs and adaptive bitrate streaming so participants maintain smooth video when switching between cellular and Wi-Fi. Real-time interactivity lifts class completion rates and enables in-stream commerce, such as timed product drops, which monetize attention within the workout itself.
Restraints Impact Analysis*
| Restraint | (~) % Impact on CAGR Forecast | Geographic Relevance | Impact Timeline |
|---|---|---|---|
| High Subscriber Churn and Low 90-Day Retention | -3.8% | Global, most acute in North America and Europe | Short term (≤ 2 years) |
| Rising Music-Licensing and Instructor Royalty Costs | -2.4% | Global, concentrated in North America and Europe | Medium term (2-4 years) |
| Data-Privacy Litigation Risk Around Biometric Tracking | -1.9% | North America, Europe (GDPR jurisdictions) | Medium term (2-4 years) |
| Bandwidth Inequality in Rural and Emerging Markets | -1.6% | Asia-Pacific, South America, Middle East and Africa rural areas | Long term (≥ 4 years) |
| Source: Mordor Intelligence | |||
High Subscriber Churn and Low 90-Day Retention
Roughly half of new digital subscribers cancel within 90 days, undermining unit economics. Peloton’s app-only churn climbed to 7.0% monthly by Q2 FY2026, yielding an average customer lifetime of 14 months, a horizon too short to recoup acquisition costs without upsells. Virtual-only providers lack the social stickiness of physical facilities, forcing them to deploy gamified challenges, AI-predicted lapse risk, and flexible pricing tiers that let casual users downgrade rather than quit outright. Platforms that push users to three weekly sessions secure 85-90% retention, yet fewer than one-third hit that cadence in the first month.
Rising Music-Licensing and Instructor Royalty Costs
Music and trainer royalties are the largest variable expenses in subscription fitness. Because compulsory mechanical licenses do not cover synchronized fitness videos, Peloton has historically paid USD 0.03 per stream, nearly 10 times Spotify’s rate, and settled a lawsuit with music publishers in 2020 for as much as USD 300 million. Celebrity instructors now negotiate performance bonuses tied to subscriber acquisitions, adding payout volatility. Smaller brands test royalty-free libraries and AI-generated soundtracks to lower costs, but the motivational impact still trails that of commercial hits, pressuring retention when playlists degrade.[2]National Music Publishers’ Association, “NMPA v. Peloton Settlement Details,” nmpa.org
*Our forecasts treat driver/restraint impacts as directional, not additive. The impact forecasts reflect baseline growth, mix effects, and variable interactions.
Segment Analysis
By Product Type: Apps Lead While VR Titles Accelerate
Apps held 45.31% of 2025 revenue, anchoring the virtual fitness market through low entry barriers and smartphone ubiquity. Platform-as-a-service portals aggregate studio content so users can sample multiple formats without additional logins, a convenience that drives stickiness. Smart equipment-linked content, such as Peloton’s Bike+, adds hardware lock-in to subscription engagement, lengthening average tenure.
VR and AR fitness titles, though still niche, are registering a 24.02% CAGR through 2031, the fastest growth rate in the virtual fitness market. Immersive gameplay addresses boredom that plagues two-dimensional videos, rewarding consistent effort with progress narratives. Headset shipments dipped in 2025, yet smart-glasses volume jumped 211.2%, previewing lighter AR overlays that can guide outdoor runs. Enterprise demand for immersive training is already validating ROI, hinting at consumer spillovers once hardware drops below USD 300.


By Delivery Mode: On-Demand Dominates, Live Streaming Gains Momentum
On-demand libraries accounted for 57.89% of 2025 spend, reflecting the growing consumer preference for scheduling flexibility in virtual fitness programs. These libraries allow users to select classes that align with their specific needs, preferences, or moods, offering a highly personalized experience. Advanced AI engines further enhance user engagement by curating tailored queues of classes, which not only improve watch time but also ensure that users remain consistently engaged with the platform.
Live-interactive streams are projected to grow at a 23.62% CAGR, significantly outpacing the overall expansion of the virtual fitness market. These streams leverage sub-200-millisecond latency, enabling coaches to interact with participants in real time by addressing them by name, fostering accountability, and strengthening user retention. Additionally, commerce-native overlays integrated into these streams allow viewers to purchase fitness apparel or equipment directly during the session. This feature effectively converts user attention into incremental revenue streams while simultaneously increasing each customer's lifetime value.
By Subscription Type: Monthly Plans Prevail, Usage-Based Models Rise
Monthly billing accounted for 54.32% of revenue in 2025, offering a balance between user flexibility and predictable cash flow for businesses. This model appeals to users who prefer short-term commitments while ensuring steady income streams. On the other hand, annual subscription tiers, which are typically 10-15% cheaper than monthly plans, attract committed members who prioritize cost savings. These annual plans help businesses secure long-term customer loyalty while providing users with financial benefits over time.
Pay-per-class and freemium upgrades are witnessing significant growth, expanding at a 23.42% CAGR, particularly among price-sensitive first-time users in emerging economies. Freemium models foster community growth through network effects, eventually converting a small percentage of users into premium tiers that contribute the majority of profit margins. Additionally, cohort-based pricing, where groups of friends subscribe together to avail discounts, is emerging as a promising strategy to enhance customer retention and drive engagement.
By Device Type: Smartphones Dominate, Headsets Poised for Upside
Smartphones and tablets accounted for 49.14% of spending in 2025, driven by their portability and the absence of additional hardware costs. These devices have become the preferred choice for users seeking convenience and accessibility. Additionally, smart TV applications have gained traction by extending workout experiences to larger screens, aligning with the trend of group viewing in living-room settings. This shift highlights the growing demand for versatile platforms that cater to diverse user preferences.
Virtual reality (VR) and augmented reality (AR) head-mounted displays are projected to grow at a compound annual growth rate (CAGR) of 23.83%. However, their adoption remains limited due to high prices and limited content. Meanwhile, smart glasses, which experienced triple-digit growth in 2025, present a promising avenue for lightweight overlay applications. Wearable devices, on the other hand, primarily serve as biometric input tools, with platforms leveraging them as data gateways rather than primary display devices. This evolving ecosystem underscores the role of emerging technologies in shaping user experiences.
By End User: Consumers Still Lead, Clinics Accelerate
Individual consumers accounted for 62.27% of revenue in 2025. This growth was driven by consumers' self-funding subscriptions and hardware to access digital fitness and rehabilitation solutions. Health clubs also played a crucial role by integrating digital tiers into their offerings, enabling them to engage members even when they were away from the facilities. This approach not only enhanced customer experience but also helped reduce member attrition rates, ensuring sustained revenue streams for these establishments.
Healthcare and rehabilitation clinics are projected to achieve a robust 23.82% CAGR, supported by key policy changes and technological advancements. Medicare’s permanent tele-physical therapy (tele-PT) coverage, enacted in 2026, and Aetna’s 2025 expansion of benefits have been pivotal in driving this growth. Additionally, the adoption of AI-guided computer vision technology has enabled clinicians to remotely monitor movement quality, identify compensations, and improve patient outcomes. This innovation has also unlocked remote-patient-monitoring CPT codes, which provide monthly reimbursements ranging from USD 100 to USD 150 per patient, further incentivizing the adoption of these advanced solutions.
By Technology: Video Streaming Leads, AI and VR Drive Differentiation
Video streaming accounted for 55.91% of the projected revenue for 2025, playing a crucial role in delivering both on-demand and live classes across various device categories. The implementation of adaptive bitrate protocols ensures smooth playback even under fluctuating network conditions, thereby safeguarding the overall user experience. This technology has become a cornerstone for maintaining seamless content delivery, which is critical for user satisfaction and projected 2025 revenue engagement in the digital fitness ecosystem.
Virtual Reality (VR) and Augmented Reality (AR) technologies are advancing at a compound annual growth rate (CAGR) of 24.11%, significantly enhancing the virtual fitness market. These technologies, combined with computer-vision-based form correction, create immersive and interactive environments that accurately score only properly executed repetitions. Additionally, AI-driven recommendation engines play a pivotal role in predicting churn risks and automatically adjusting session intensity. This not only improves user retention but also increases upsell opportunities, making these innovations integral to the growth and sustainability of the virtual fitness industry.
Geography Analysis
North America accounted for 41.36% of global revenue in 2025, supported by mature corporate wellness programs, high smartwatch penetration, and permanent Medicare Part B reimbursement for virtual physical therapy. United States enterprises such as Kaiser and Optum integrate tele-PT into musculoskeletal care pathways, while Peloton raised its U.S. subscription fee to USD 49.99 in 2025 without significant short-term cancellations. Canada and Mexico trail due to fragmented reimbursement, yet metro areas adopt hybrid gym models to compete for digitally savvy consumers.
Asia-Pacific is the fastest-growing region, with a 24.04% CAGR through 2031, propelled by smartphone-first populations and government digital health initiatives in China and India. Local platforms localize content in Hindi, Mandarin, and regional dialects to widen reach beyond major cities. Japan and South Korea have high wearable attach rates, and Samsung has integrated iFIT recommendations into its Galaxy devices. Middle Eastern hubs such as the UAE and Saudi Arabia invest in AI-enabled virtual hospitals, with Seha Virtual Hospital linking more than 170 facilities nationwide, normalizing tele-health usage that spills over into fitness applications.[3]Saudi Arabia Ministry of Health, “Seha Virtual Hospital Fact Sheet,” moh.gov.sa
Europe maintains a significant revenue share, led by the United Kingdom, Germany, and France, where GDPR compliance shapes data-collection architectures. Startups like Runna attract acquisition interest as global players seek localized content. South America, with Brazil at the forefront, is scaling from a smaller base, yet improving mobile bandwidth is unlocking app-driven fitness adoption in urban corridors. Middle East and Africa exhibit pockets of rapid uptake in Gulf Cooperation Council countries, though rural bandwidth gaps still impede widespread streaming.

Competitive Landscape
The virtual fitness market is highly fragmented, with no single brand holding more than a 10% global market share. This fragmentation has positioned competition along three primary axes: hardware-software integration, AI-driven personalization, and the breadth of ecosystem partnerships. Peloton continues to lead as a flagship integrated player by combining proprietary equipment with exclusive content. However, the company has faced challenges, as rising churn rates have exposed vulnerabilities, particularly when hardware saturation began to slow. Meanwhile, Apple Fitness+ capitalizes on its dominance in the global smartwatch market, with a share exceeding 50%, to seamlessly distribute content. The platform has expanded into 28 new markets, utilizing AI-powered dubbing to localize classes efficiently. Additionally, the USD 7.5 billion merger of Mindbody, ClassPass, and EGYM highlights a growing trend toward vertical integration, enabling companies to capture both enterprise and consumer revenue streams within a unified ecosystem.[4]Mindbody, “Mindbody, ClassPass and EGYM Complete USD 7.5 Billion Merger,” mindbodyonline.com
Healthcare-focused startups, such as Kintinu Telerehab and XRHealth, are carving out high-margin niches by offering medical-grade computer-vision monitoring that qualifies for reimbursement. These companies are addressing a specific market segment, providing solutions tailored to healthcare needs. At the same time, biometric privacy litigation is emerging as a critical factor influencing competition. For instance, Whoop’s class action under Illinois BIPA and Amazon’s VTO case, which survived dismissal in 2026, underscore the importance of transparent consent mechanisms. Brands that prioritize privacy and compliance may gain a competitive edge by building greater trust with consumers. However, content costs remain a significant structural challenge for the industry. Smaller apps, in particular, struggle to amortize expenses related to music and instructor royalties, which has driven consolidation within the market.
To address these challenges and diversify revenue streams, leading firms are making strategic moves into adjacent segments. For example, Strava has acquired Runna and The Breakaway, while Peloton has launched its Commercial Series targeting gyms and hotels. These initiatives aim to mitigate consumer churn and expand market presence. The focus on diversification reflects a broader industry trend, as companies seek to strengthen their positions by exploring new opportunities and partnerships. As the virtual fitness market continues to evolve, firms that adapt to these dynamics and leverage innovation are likely to maintain a competitive advantage in the coming years.
Virtual Fitness Industry Leaders
Peloton Interactive Inc.
Apple Inc. (Apple Fitness+)
iFIT Inc.
Les Mills International Ltd.
ClassPass LLC (Mindbody Inc.)
- *Disclaimer: Major Players sorted in no particular order

Recent Industry Developments
- April 2026: Freeletics secured USD 45 million Series A financing led by FitLab and professional-sports ownership groups, citing 120% U.S. growth.
- March 2026: Peloton introduced the Commercial Series, targeting gyms, hotels, and corporate wellness centers to diversify hardware revenue.
- January 2026: iFIT rolled out Trainer Games on Amazon Prime Video, tapping into 200 million Prime members without requiring a separate subscription.
- January 2026: Mindbody, ClassPass, and EGYM finalized a USD 7.5 billion three-way merger, with USD 785 million in fresh capital, to create a vertically integrated wellness stack.


Global Virtual Fitness Market Report Scope
The virtual fitness market comprises digital platforms, applications, and connected technologies that deliver fitness, wellness, and exercise experiences through online and technology-enabled environments. Virtual fitness solutions enable users to access live or on-demand workout sessions, personalized coaching, health monitoring, and immersive training experiences remotely through internet-connected devices. The market integrates advanced technologies such as artificial intelligence, motion tracking, computer vision, gamification, video streaming, and virtual/augmented reality to enhance user engagement, performance tracking, and personalized fitness experiences across home-based, commercial, and healthcare settings.
The Virtual Fitness Market Report is Segmented by Product Type (Fitness Apps, Platform-as-a-Service Portals, Smart Equipment-Linked Content, VR/AR Fitness Titles, and AI-Driven Personalized Coaching Engines), Delivery Mode (Live-Interactive Streaming, On-Demand Video Library, and Pre-Recorded Downloadables), Subscription Type (Monthly, Quarterly, Annual, and Pay-per-Class/Freemium Upgrade), Device Type (Smartphones and Tablets, Smart TVs and Streaming Sticks, Connected Fitness Equipment Consoles, VR/AR Head-Mounted Displays, and Wearables), End-User (Individual Consumers, Health Clubs and Gyms, Enterprises and Corporate Wellness, and Healthcare and Rehabilitation Clinics), Technology (Video Streaming, AI and Machine Learning, Gamification Engines, Motion-Tracking/Computer Vision, and VR/AR Immersion), and Geography (North America, South America, Europe, Asia-Pacific, and Middle East and Africa). The Market Forecasts are Provided in Terms of Value (USD).
| Fitness Apps |
| Platform-as-a-Service Portals |
| Smart Equipment-Linked Content |
| VR/AR Fitness Titles |
| AI-Driven Personalized Coaching Engines |
| Live-Interactive Streaming |
| On-Demand Video Library |
| Pre-Recorded Downloadables |
| Monthly |
| Quarterly |
| Annual |
| Pay-per-Class / Freemium Upgrade |
| Smartphones and Tablets |
| Smart TVs and Streaming Sticks |
| Connected Fitness Equipment Consoles |
| VR/AR Head-Mounted Displays |
| Wearables (Smartwatches, Bands) |
| Individual Consumers |
| Health Clubs and Gyms |
| Enterprises and Corporate Wellness |
| Healthcare and Rehabilitation Clinics |
| Video Streaming |
| AI and Machine Learning |
| Gamification Engines |
| Motion-Tracking / Computer Vision |
| VR/AR Immersion |
| North America | United States | |
| Canada | ||
| Mexico | ||
| South America | Brazil | |
| Argentina | ||
| Rest of South America | ||
| Europe | United Kingdom | |
| Germany | ||
| France | ||
| Italy | ||
| Rest of Europe | ||
| Asia-Pacific | China | |
| Japan | ||
| India | ||
| South Korea | ||
| Rest of Asia-Pacific | ||
| Middle East and Africa | Middle East | United Arab Emirates |
| Saudi Arabia | ||
| Rest of Middle East | ||
| Africa | South Africa | |
| Egypt | ||
| Rest of Africa | ||
| By Product Type | Fitness Apps | ||
| Platform-as-a-Service Portals | |||
| Smart Equipment-Linked Content | |||
| VR/AR Fitness Titles | |||
| AI-Driven Personalized Coaching Engines | |||
| By Delivery Mode | Live-Interactive Streaming | ||
| On-Demand Video Library | |||
| Pre-Recorded Downloadables | |||
| By Subscription Type | Monthly | ||
| Quarterly | |||
| Annual | |||
| Pay-per-Class / Freemium Upgrade | |||
| By Device Type | Smartphones and Tablets | ||
| Smart TVs and Streaming Sticks | |||
| Connected Fitness Equipment Consoles | |||
| VR/AR Head-Mounted Displays | |||
| Wearables (Smartwatches, Bands) | |||
| By End-User | Individual Consumers | ||
| Health Clubs and Gyms | |||
| Enterprises and Corporate Wellness | |||
| Healthcare and Rehabilitation Clinics | |||
| By Technology | Video Streaming | ||
| AI and Machine Learning | |||
| Gamification Engines | |||
| Motion-Tracking / Computer Vision | |||
| VR/AR Immersion | |||
| By Geography | North America | United States | |
| Canada | |||
| Mexico | |||
| South America | Brazil | ||
| Argentina | |||
| Rest of South America | |||
| Europe | United Kingdom | ||
| Germany | |||
| France | |||
| Italy | |||
| Rest of Europe | |||
| Asia-Pacific | China | ||
| Japan | |||
| India | |||
| South Korea | |||
| Rest of Asia-Pacific | |||
| Middle East and Africa | Middle East | United Arab Emirates | |
| Saudi Arabia | |||
| Rest of Middle East | |||
| Africa | South Africa | ||
| Egypt | |||
| Rest of Africa | |||


Key Questions Answered in the Report
What is the current virtual fitness market size and its expected value by 2031?
The virtual fitness market size was USD 38.81 billion in 2026 and is forecast to reach USD 109.36 billion by 2031 at a 23.02% CAGR.
Which product category holds the largest share in virtual fitness?
Fitness apps led the market with a 45.31% share in 2025, reflecting their low entry barriers and smartphone ubiquity.
Which region is projected to grow fastest in virtual fitness through 2031?
Asia-Pacific is expected to register the highest growth, advancing at a 24.04% CAGR through 2031 due to smartphone-first populations and supportive digital-health policies.
How are corporate wellness programs influencing virtual fitness adoption?
Self-insured enterprises are enlarging budgets for integrated digital platforms that link home workouts, on-site gyms, and wearable data, driving demand for unified ecosystems.
Why are VR and AR titles gaining momentum in virtual fitness?
Immersive environments solve engagement and retention challenges common in two-dimensional videos, pushing VR and AR fitness titles to a forecast 24.02% CAGR through 2031.
What is the main challenge to profitability for virtual fitness platforms?
High subscriber churn, with 50% of new users quitting within 90 days, shortens customer lifetimes and elevates acquisition costs, pressuring margins until retention improves.
Page last updated on:


