Sports Tech Market Size and Share
Market Overview
| Study Period | 2020 - 2031 |
|---|---|
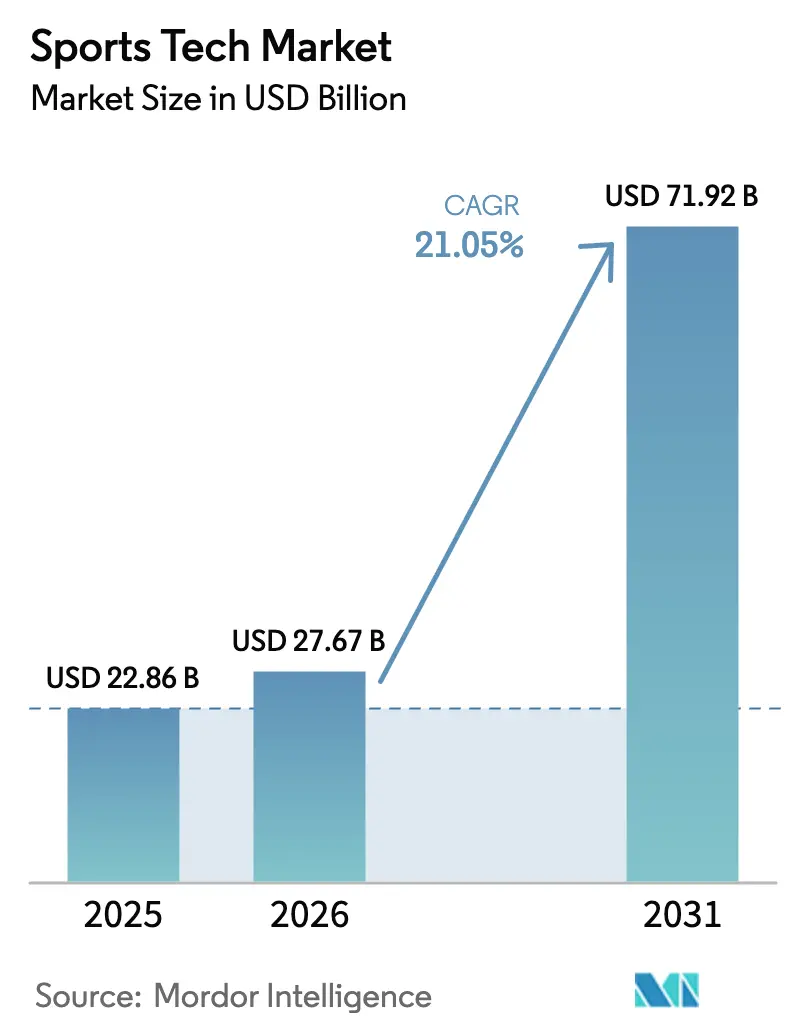
| Market Size (2026) | USD 27.67 Billion |
| Market Size (2031) | USD 71.92 Billion |
| Growth Rate (2026 - 2031) | 21.05% CAGR |
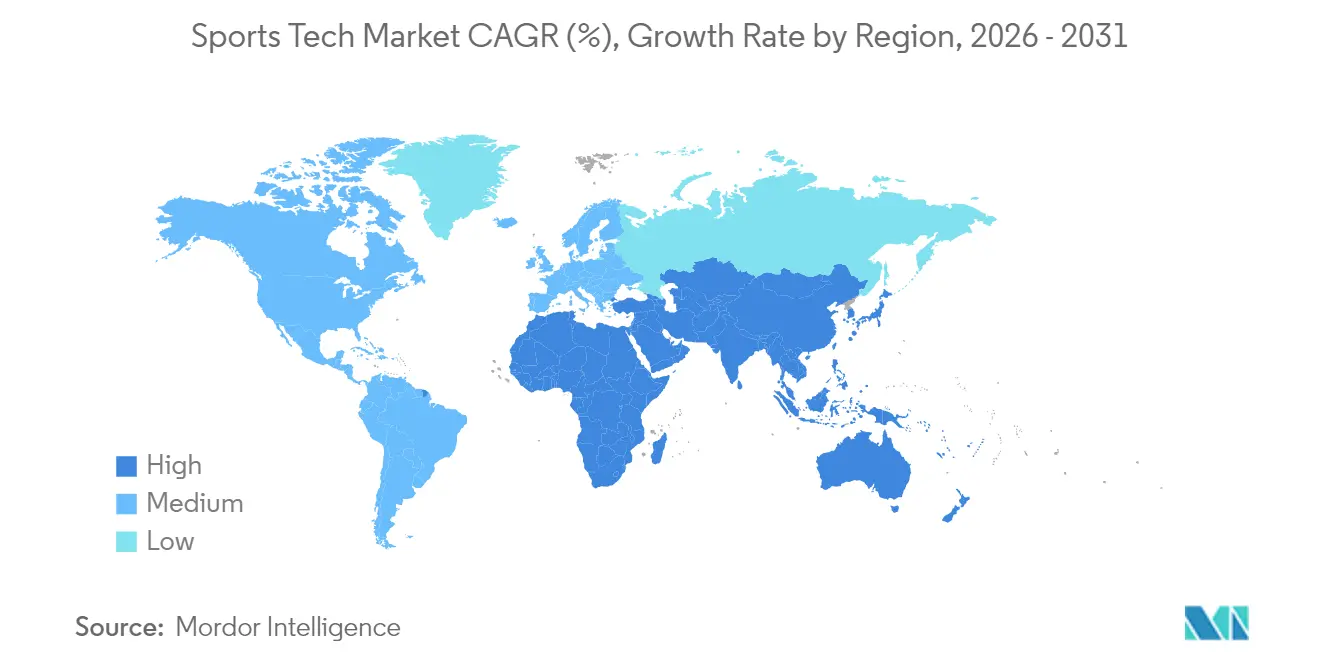
| Fastest Growing Market | Middle East |
| Largest Market | Asia Pacific |
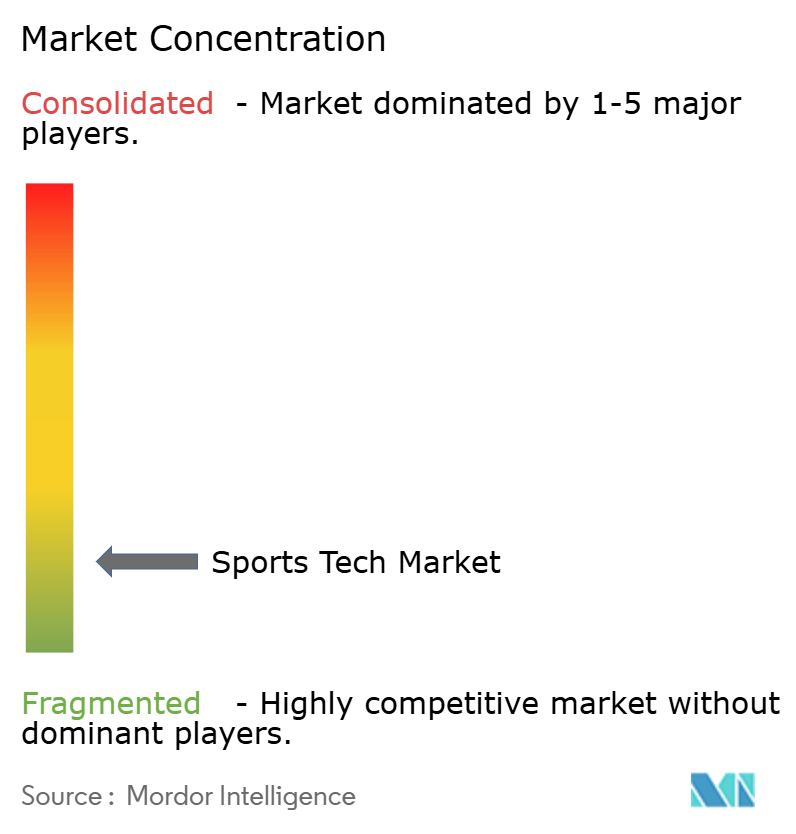
| Market Concentration | Medium |
Major Players *Disclaimer: Major Players sorted in no particular order Image © Mordor Intelligence. Reuse requires attribution under CC BY 4.0. | |
Sports Tech Market Analysis by Mordor Intelligence
The Sports Tech Market size was valued at USD 22.86 billion in 2025 and estimated to grow from USD 27.67 billion in 2026 to reach USD 71.92 billion by 2031, at a CAGR of 21.05% during the forecast period (2026-2031). Momentum originates from three converging forces: 5G reaching private-network economics, edge servers moving analytics on-premise, and subscription software replacing one-off device sales. Stadium operators now treat connectivity, point-of-sale, and security as one backbone, creating a clear path for augmented-reality navigation and cashier-less concessions. Clubs renew data analytics licenses each season instead of replacing wearables every few years, so suppliers secure recurring revenue. Interoperability concerns persist, but published API roadmaps are winning bids, shifting power toward solution suites. By 2030, more than half of all revenue is expected outside North America as Asia-Pacific, buoyed by cricket, esports, and mobile commerce, leapfrogs retrofit-heavy regions.
Key Report Takeaways
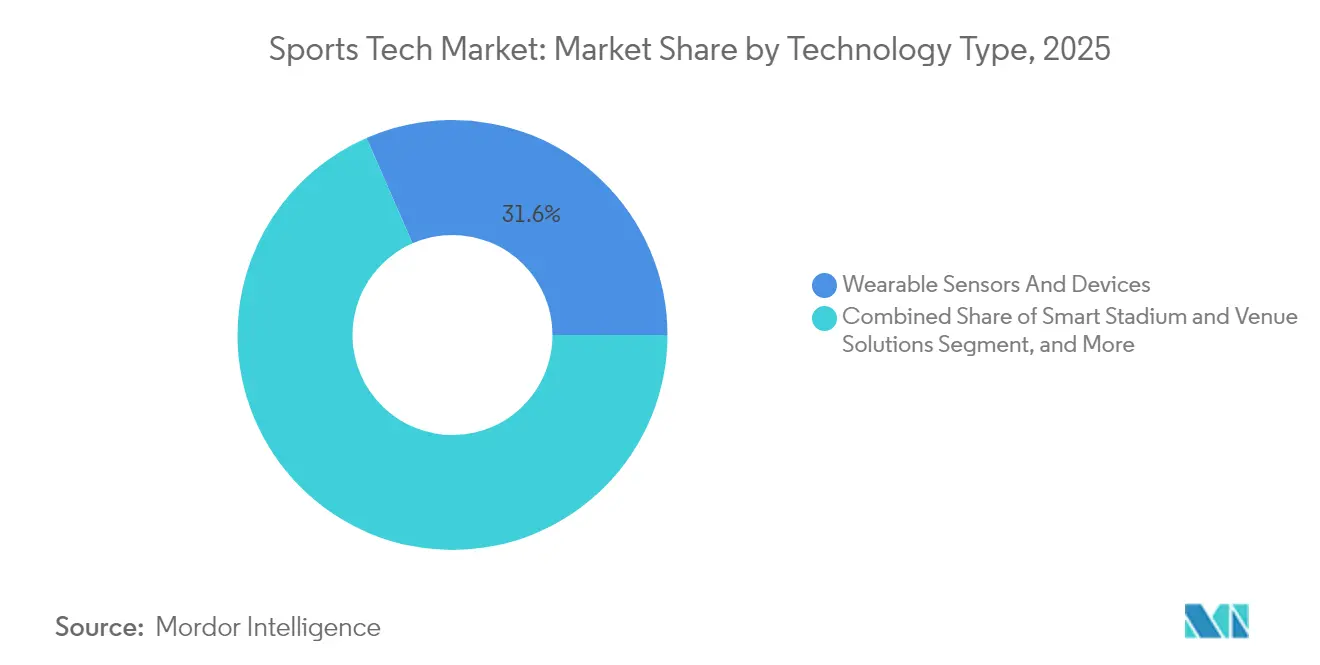
- By technology type, wearables led with roughly one-third of 2025 revenue, while esports platforms are projected to expand at a 25.85% CAGR through 2031.
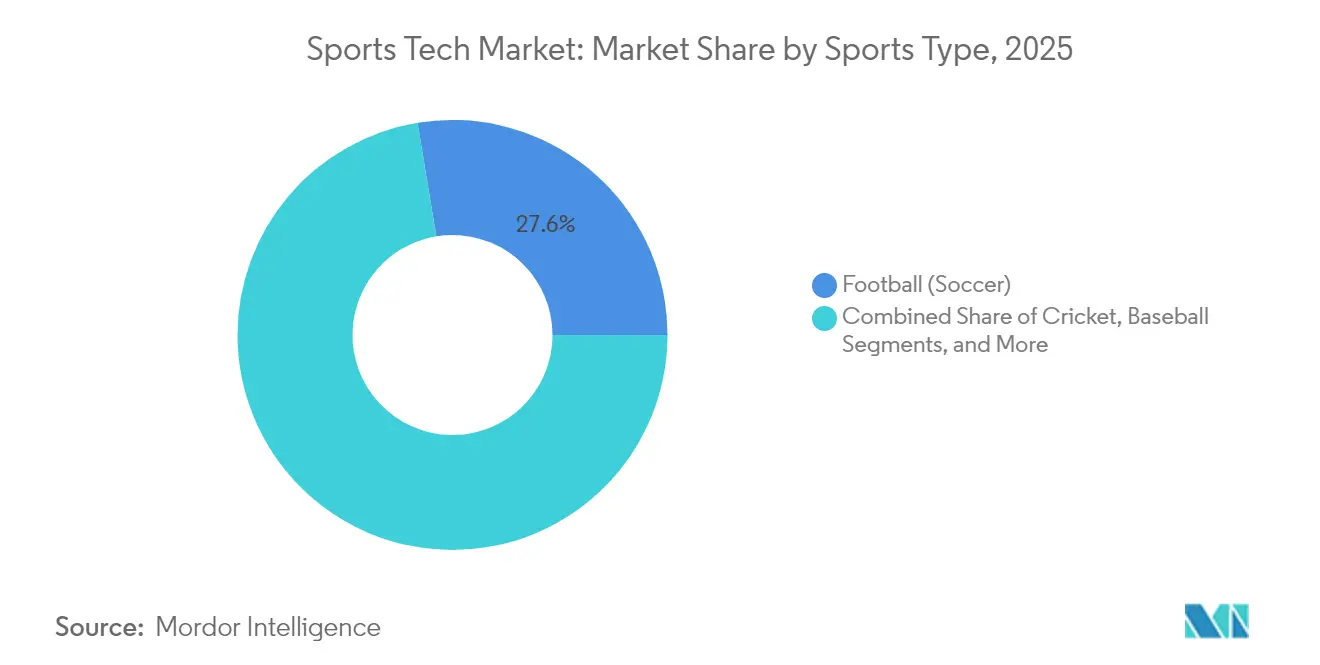
- By sports type, football commanded 27.60% of the Sports Technology market share in 2025; cricket is forecast to grow at about 22.35% CAGR to 2031.
- By end-user, professional teams and leagues controlled close to 39.20% of the 2025 Sports Technology market size, but consumer-facing apps are advancing at above 26.4% CAGR.
- By geography, North America held 34.70% revenue share in 2025, whereas Asia-Pacific is poised for a 24.10% CAGR through 2031.
Note: Market size and forecast figures in this report are generated using Mordor Intelligence’s proprietary estimation framework, updated with the latest available data and insights as of 2026.
Global Sports Tech Market Trends and Insights
Drivers Impact Analysis*
| Driver | (~) % Impact on CAGR Forecast | Geographic Relevance | Impact Timeline |
|---|---|---|---|
| Growing deployment of 5G-enabled connected stadium infrastructure | +4.2% | Global, led by North America and Europe | Medium term (3-4 yrs) |
| Real-time player tracking mandated by major leagues | +3.8% | North America and Europe | Short term (≤2 yrs) |
| Surge in AI-powered video analytics for rights-holder monetisation | +2.5% | Asia-Pacific | Medium term (3-4 yrs) |
| Shift to direct-to-fan digital commerce | +2.1% | Europe, global fan bases | Short term (≤2 yrs) |
| Explosive venture-capital inflow into esports platforms | +3.5% | Middle East | Medium term (3-4 yrs) |
| Institutional push for injury-prevention wearables | +2.3% | Global | Short term (≤2 yrs) |
| Source: Mordor Intelligence | |||
Growing Deployment of 5G Enabled Connected Stadium Infrastructure
Private 5G cores installed during the 2024-2025 season supply ticket scanning, security cameras, and high-density streaming from a single network. Verizon’s 500 radio nodes at Caesars Superdome moved 38 TB of game-day traffic without congestion, proving that a unified backbone can enable real-time mixed-reality mascots and multiview replays [1]Nicole Ferraro, “Why Verizon Swapped Wi-Fi for 5G at Super Bowl LIX,” Light Reading, lightreading.com. Edge servers inside the venue drive sub-10 ms latency, opening avenues for on-demand player biometrics. Software developers now optimise code for predictable round-trip times, and venue managers reallocate former Wi-Fi budgets to fan-facing apps.
Real-Time Player Tracking Mandated by Major Leagues in North America and Europe
The National Football League embedded RFID tags in every shoulder pad during 2024, capturing hundreds of data points per athlete each second. Clubs upgraded databases and hired Python-fluent analysts, while new middleware anonymises telemetry for broadcast graphics. Contract clauses now tie incentives to sensor metrics, and coaches act on early strain signals that appear days before injuries, extending careers.
Surge in AI-Powered Video Analytics for Rights-Holder Monetization in Asia
Foxtel’s Kayo Sports released computer-vision engines HyperLayer and The Emperor in November 2024, cutting highlight-production time to minutes and boosting social engagement with snack-size clips [2]Foxtel Group, “Game-Changing Tech Innovations Unveiled for Kayo Sports’ Biggest-Ever Summer of Cricket,” foxtelgroup.com.au. Rights-holders sell targeted mid-roll ads inside these clips, while cloud processing trims production costs. Similar pilots across India and the Philippines demonstrate that scalable pricing can match seasonal budgets.
Shift to Direct-to-Fan Digital Commerce among Premier Football Clubs
Manchester United’s October 2024 switch to a multilingual SCAYLE engine delivered record online kit sales during launch week. Fan accounts store preferred sizes and payment credentials, enabling one-click buys when live push notifications trigger after a goal. Arsenal followed in 2025 with predictive ticket-pricing modules that reduce page-load times by one-third.
Restraints Impact Analysis*
| Restraint | (~) % Impact on CAGR Forecast | Geographic Relevance | Impact Timeline |
|---|---|---|---|
| Capital-intensive retrofit of legacy venues | -2.8% | Europe and Japan | Short term (≤2 yrs) |
| Fragmented data standards | -3.1% | Global | Medium term (3-4 yrs) |
| Intellectual-property litigation on computer-vision algorithms | -1.9% | North America | Medium term (3-4 yrs) |
| Privacy backlash on biometric data collection | -2.0% | Europe | Short term (≤2 yrs) |
| Source: Mordor Intelligence | |||
Capital-Intensive Retrofit of Legacy Venues
Stadiums built long before modern cable trays must channel fibre behind heritage masonry, inflating budgets and lengthening construction schedules. A 2024 London project required months of façade-friendly routing, prompting cities to question hosting bids without public tech funding. Modular wireless nodes on handrails offer a workaround yet deliver lower throughput, leaving many European and Japanese venues lagging newer Southeast Asian builds.
Fragmented Data Standards Hampering Interoperability
Wearable, ticketing, and streaming providers use distinct schemas, preventing unified fan or athlete views. An industry draft ontology published in 2025 improved ultra-wideband tracking but remains patchy elsewhere. Procurement officers now demand open-source SDKs, making transparency a differentiator yet slowing full-suite deployments.
*Our forecasts treat driver/restraint impacts as directional, not additive. The impact forecasts reflect baseline growth, mix effects, and variable interactions.
Segment Analysis
By Technology Type: Wearables Dominate while Esports Platforms Accelerate
Wearable sensors accounted for 31.55% of 2025 revenue, the highest share among all technologies in the Sports Technology market. Teams link load-monitoring straps to cloud dashboards and reported fewer non-contact injuries during the 2024-2025 season, reinforcing renewal intent and converting device purchases into annual analytics fees. This transition anchors recurring revenue and raises enterprise valuations. Esports platforms are the quickest-advancing component, tracking a 25.85% CAGR through 2031 as purpose-built arenas roll out fibre-to-seat cabling and global streaming partners pursue seasonal circuits in days rather than months. The Sports Technology market size for esports is projected to multiply as cloud-native stacks lower entry costs for tournament organisers. Sports performance and video analytics benefit from computer vision that halves tagging time, while fan-engagement suites merge ticketing, loyalty, and merchandising in a single interface.
Middleware now merges wearable telemetry with AI-captured match footage, creating integrated performance reports that raise the standard coaching baseline. Developers treat esports as a proving ground for interactive overlays that later migrate to broadcast TV. Vendors publish API roadmaps to calm integration worries, cementing platform preference over point devices. The Sports Technology market continues to reward suppliers that pair hardware with data subscriptions, allowing annuity revenue to supplant one-off sales.


By Sports Type: Football Leads while Cricket Gains Pace
Football captured 27.60% of the 2025 Sports Technology market share, reflecting global followership and high club budgets. Spending targets owned streaming services, which remove geographic blackout rules and funnel first-party data into dynamic ticket-pricing engines. Clubs integrate sponsorship inventory with real-time player milestones, expanding revenue categories. Cricket shows the steepest CAGR, near 22.35%, thanks to Asia-Pacific appetite and experimental formats such as umpire cam and ball-trail heat maps. The Sports Technology market size allocated to cricket broadcasting is poised to grow sharply as advertisers value on-screen analytics inventory over traditional ad breaks.
Cricket’s momentum encourages regional broadcasters to adopt cloud production, and federations invest in analytics to optimise player workloads across dense schedules. Meanwhile, football continues to pioneer direct-to-fan commerce and augmented-reality replays. Data-rich environments raise athlete bargaining power through performance-linked incentives. Across both sports, open data standards remain pivotal for cross-league sponsorship packages, ensuring scalability for global fan bases.
By End-user: Professional Leagues Hold Scale while Consumer Apps Expand Fastest
Professional teams and leagues accounted for nearly 39.20% of 2025 revenue, the largest stakeholder group in the Sports Technology market. League bargaining frameworks now embed technology upgrades, converting stadium improvements into collective-benefit initiatives. Clubs apply analytics to set ticket prices in real time, matching seat value with on-field narratives. Consumer-facing apps, though smaller today, are projected to grow above 26.4% annually. OneFootball’s 170 million monthly users prove the reach possible when live chat, playlists, and personalised feeds converge in one place.
Higher education joins the mix as North American conferences sign exclusive streaming deals covering more than 800 events each season, widening audience reach. Insurance firms offer premium discounts for verified injury-prevention wearables, aligning financial incentives with technology deployment. The Sports Technology industry increasingly bundles compliance modules within athlete-management software, reducing administrative work and strengthening renewal rates.
Geography Analysis
North America retained 34.70% of 2025 revenue, driven by leagues that embed connectivity targets in labour agreements. The February 2025 5G expansion at Caesars Superdome doubled radio density and showcased network resilience under a 70,000-fan load. Clubs use data to adjust ticket prices in near real time, and impending privacy legislation is set to raise compliance outlays but can translate into brand trust for early adopters.
Asia-Pacific is forecast to achieve a 24.10% CAGR to 2031, the fastest of any region. Kayo Sports’ AI-generated cricket highlights proved that cloud vision engines sustain prime-time engagement without full production crews. Domestic IT champions now exceed USD 1.4 billion in tech revenues, providing local capacity to supply home-grown solutions. Ongoing sub-6 GHz 5G rollout across India and Indonesia positions mobile networks as the primary fan-engagement rail.
Europe faces higher retrofit complexity. Wembley’s 2025 standalone 5G upgrade required heritage-grade aesthetics and precise cable routing. Clubs counter these costs with e-commerce platforms that serve global supporters; Arsenal cut page-load times by one-third after a 2025 cloud migration. Strict data-protection rules slow experimental rollouts but create a standards-led ecosystem that incoming vendors must respect.

Competitive Landscape
The Sports Technology market is fragmented but trending toward platform consolidation. Sportradar’s USD 225 million purchase of IMG ARENA united near-real-time data for 70,000 live events with betting-odds services, expanding cross-sell potential. IBM positions its watsonx AI as a neutral engine that clubs can embed within existing stacks, emphasising explainable models over black-box forecasts [3]IBM Corp., “Watsonx for Sports,” ibm.com. Start-ups holding patents for low-light object tracking attract acquirers keen on night-game analytics. White-space remains in consent-management software that reconciles athlete, fan, and media data under uniform governance.
A second wave of capital targets esports infrastructure. Saudi Arabia’s Vision 2030 backs a 25,000 m² Riyadh complex with fibre-to-seat cabling and 8K broadcast control, aiming for international finals by 2025. Publishers plan seasonal circuits that culminate in Gulf events, adding tourism and sponsorship appeal. Vendors able to meet sub-5 ms round-trip latency secure preferred-supplier status.
Established apparel brands integrate sensors in smart garments. Amer Sports reported record Q1 2025 sales of USD 1,473 million, citing embedded performance insights that connect to athlete-management dashboards. Mergers and strategic alliances indicate that end-to-end ecosystems will shape bargaining strength over the coming cycle.
Sports Tech Industry Leaders
IBM Corporation
Cisco Systems Inc.
SAP SE
Oracle Corporation
Apple Inc.
- *Disclaimer: Major Players sorted in no particular order

Recent Industry Developments
- May 2025: Amer Sports reported record Q1 revenue of USD 1,473 million, crediting demand for connected technical apparel with embedded insights.
- March 2025: StumpEye appointed Simon Taufel as brand ambassador to advance stump-camera technology for umpiring and grassroots coaching.
- February 2025: FloSports and East Coast Conference signed an exclusive media-rights deal to stream 800+ collegiate events per season on FloCollege, backed by a USD 50 million platform investment.
- February 2025: Verizon doubled 5G capacity at Caesars Superdome, demonstrating resilience under a 70,000-fan load.


Research Methodology Framework and Report Scope
Market Definitions and Key Coverage
Our study defines the sports technology market as all hardware, software, and connected infrastructure whose primary purpose is to enhance athlete performance, sports organization decision-making, fan engagement, or venue operations. Value is recorded at the first point of commercial sale, expressed in USD, and covers wearable sensors, smart-stadium platforms, video and data analytics engines, immersive media solutions, and esports infrastructure.
Scope exclusions include consumer fitness gadgets not marketed for competitive sports, standalone sports betting platforms, and generic broadcast equipment, which are outside the boundary.
Segmentation Overview
- By Technology Type
- Wearable Sensors and Devices
- Smart Stadium and Venue Solutions
- Sports Performance and Video Analytics
- Fan Engagement and Sponsorship Tech
- Esports Platforms and Infrastructure
- Immersive Media (AR/VR and Metaverse)
- By Sports Type
- Football (Soccer)
- Cricket
- Baseball
- Basketball
- Tennis
- Motorsports
- Other Sports
- By End-user
- Professional Teams and Leagues
- Colleges and Universities
- Sports Associations and Federations
- Broadcasters and Media Networks
- Fans / Consumers
- By Geography
- North America
- United States
- Canada
- Mexico
- South America
- Brazil
- Argentina
- Rest of South America
- Europe
- Germany
- United Kingdom
- France
- Italy
- Spain
- Rest of Europe
- Asia-Pacific
- China
- Japan
- South Korea
- India
- Rest of Asia-Pacific
- Middle East and Africa
- United Arab Emirates
- Saudi Arabia
- South Africa
- Rest of Middle East and Africa
- North America
Detailed Research Methodology and Data Validation
Primary Research
Mordor analysts spoke with league technology directors, stadium operators, esports platform founders, and performance-science consultants across North America, Europe, and Asia-Pacific. Interviews tested price assumptions, confirmed typical device replacement cycles, and clarified where adoption lags because of budget or regulatory hurdles, thereby tightening our estimates.
Desk Research
We began with publicly available anchors such as IOC Olympic Solidarity spending, FIFA and NBA technology procurement reports, FCC 5G rollout statistics, and EU Eurostat ICT adoption datasets, which outline the adoption base. Trade bodies like the Global Sports Innovation Center, plus patent trends retrieved via Questel, hint at emerging solution clusters, while D&B Hoovers company filings reveal revenue splits for key suppliers. These inputs frame baseline volumes, price corridors, and technology diffusion curves. Additional cues from peer-reviewed journals on injury-mitigation wearables and from national customs data on camera imports helped refine unit flows. This list is illustrative; many other sources informed validation and clarification.
Market-Sizing & Forecasting
A hybrid top-down demand-pool build, cross-checked with selective bottom-up supplier roll-ups, underpins the model. Key variables include the number of professional teams mandated to use player-tracking, global smart-stadium capex, average per-fan digital spend, esports monthly active users, 5G coverage, and median sensor ASP. Historical series feed a multivariate regression that projects each driver, and then scenario analysis adjusts for macro shocks or rule changes. Where supplier data were patchy, weighted averages from primary interviews closed the gaps.
Data Validation & Update Cycle
Outputs pass variance checks against auxiliary metrics such as venture funding flows and customs trade lines. A peer review panel inside Mordor re-runs anomaly flags, and reports refresh annually, with interim updates when major league regulations or technology breakthroughs materially shift the trend.
Why Our Sports Tech Baseline Commands Reliability
Published estimates often diverge because firms mix consumer fitness, media rights, or even gambling revenues with core sports tech.
Key gap drivers include 1) narrower segment selection by some publishers that omit immersive media; 2) others bundling broadcast rights and betting, inflating totals; 3) differing ASP progression logic; and 4) refresh cycles that lag fast VC-funded growth.
Benchmark comparison
| Market Size | Anonymized source | Primary gap driver |
|---|---|---|
| USD 22.86 B (2025) | Mordor Intelligence | - |
| USD 22.97 B (2025) | Global Consultancy A | Excludes esports platforms and fan-commerce apps, limiting upside |
| USD 34.25 B (2025) | Industry Association B | Adds betting and media distribution revenues beyond core tech |
| USD 32.47 B (2025) | Trade Journal C | Uses static ASPs and biennial refresh, overstating near-term growth |
The comparison shows that when scope, variables, and refresh cadence are aligned with on-ground adoption markers, Mordor's disciplined approach provides a balanced figure decision-makers can trace back to transparent assumptions.


Key Questions Answered in the Report
How large will the Sports Technology market size be by 2031?
The market is expected to reach USD 71.92 billion, up from USD 27.67 billion in 2026, representing a 21.05% CAGR.
Which technology segment is growing the fastest?
Esports platforms show the highest growth, recording a projected 25.85% CAGR between 2026 and 2031.
Why is Asia-Pacific pivotal for future expansion?
Youthful demographics, rapid 5G rollout, and a surge in cricket and esports viewership underpin a 24.10% regional CAGR through 2031.
How are clubs capturing direct-to-fan revenue?
Multilingual e-commerce engines tied to live match events enable one-click kit purchases and predictive ticket offers, lifting basket value.
What main obstacle hampers European venue upgrades?
Heritage-building constraints and high retrofit costs challenge fibre and 5G installation, lengthening project timelines.
How does real-time player tracking benefit teams?
Continuous positional and biometric data surfaces injury-risk indicators days in advance, supporting workload adjustments and longer careers.
Page last updated on:


