Virtualized Ran (vRAN) Market Size and Share
Market Overview
| Study Period | 2019 - 2030 |
|---|---|
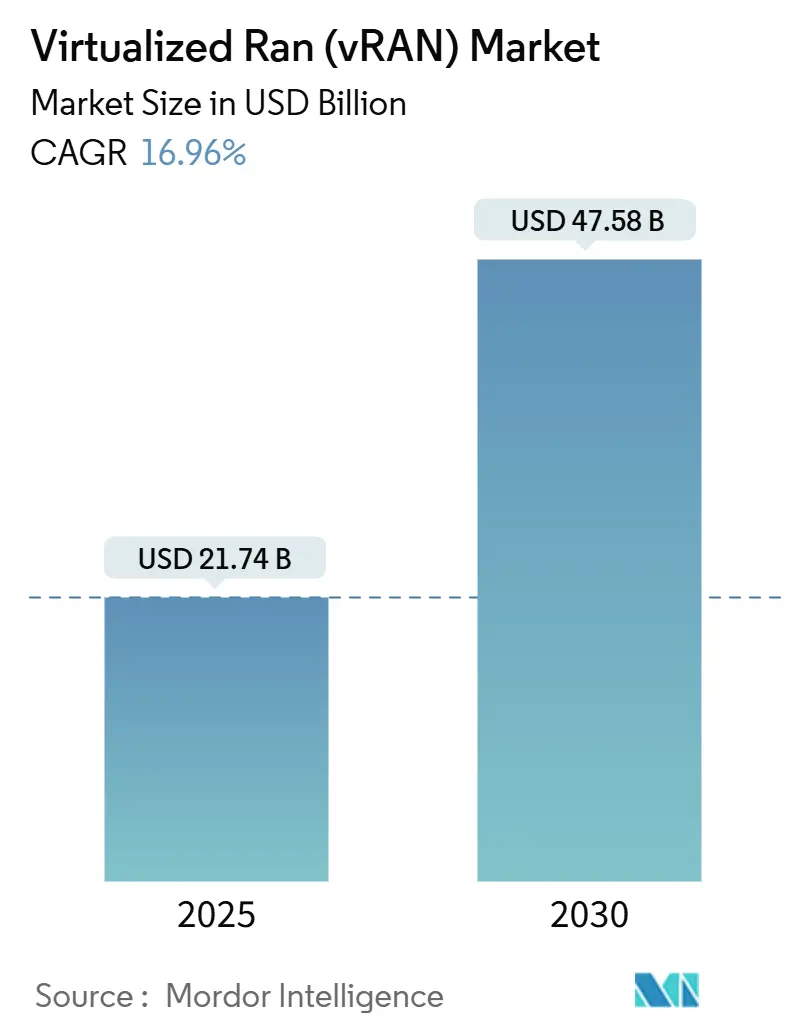
| Market Size (2025) | USD 21.74 Billion |
| Market Size (2030) | USD 47.58 Billion |
| Growth Rate (2025 - 2030) | 16.96% CAGR |
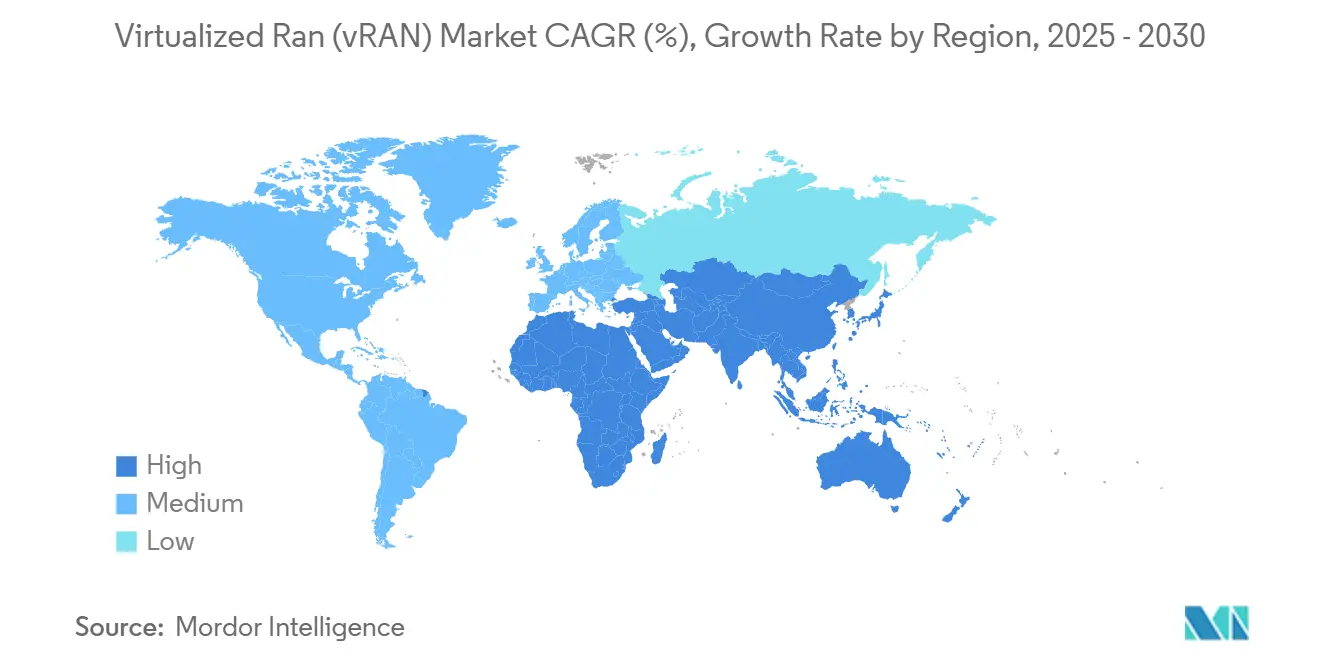
| Fastest Growing Market | Middle East |
| Largest Market | Asia Pacific |
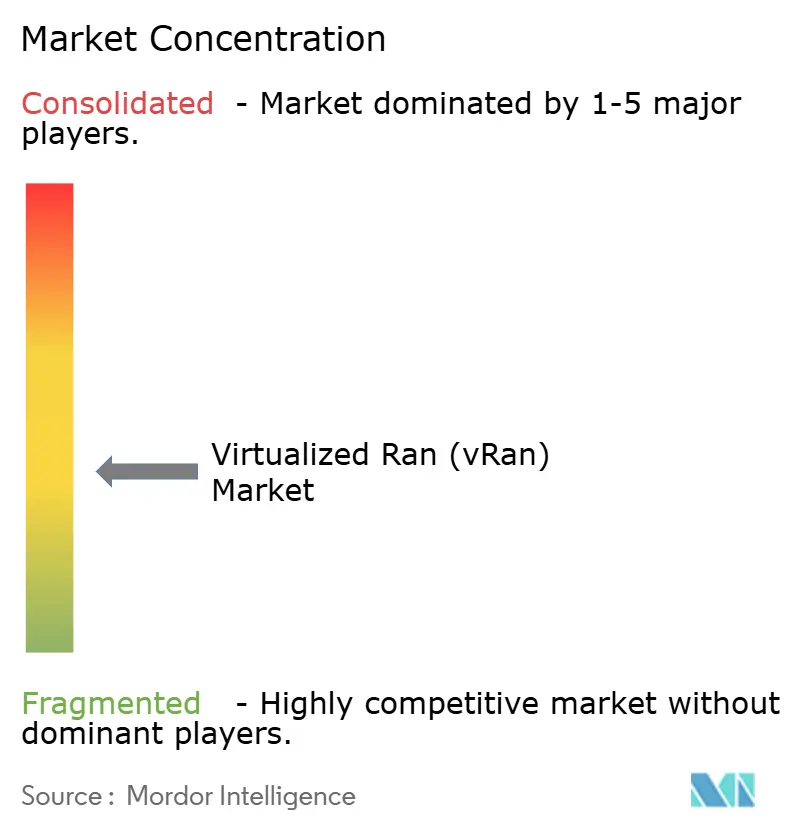
| Market Concentration | Medium |
Major Players *Disclaimer: Major Players sorted in no particular order Image © Mordor Intelligence. Reuse requires attribution under CC BY 4.0. | |
Virtualized Ran (vRAN) Market Analysis by Mordor Intelligence
The Virtualized RAN market size stands at USD 21.74 billion in 2025 and is projected to reach USD 47.58 billion by 2030, expanding at a 16.96% CAGR. Robust 5G standalone rollouts, the shift from hardware-centric to cloud-native architectures, and rising energy-efficiency mandates are driving the pivot toward software-defined radio access solutions. Disaggregation of centralized, distributed, and radio units enables resource pooling that lowers total cost of ownership, while multivendor interoperability standards from the O-RAN Alliance widen supplier choice and compress procurement cycles. Operator capital is flowing into edge-optimized deployments that minimize latency for time-critical applications such as industrial automation, and hyperscale cloud providers are entering partnership models that combine carrier-grade reliability with web-scale agility. However, constrained fronthaul fiber capacity in emerging economies and the complexity of integrating virtualized components with entrenched hardware threaten to temper near-term rollout velocity.
Key Report Takeaways
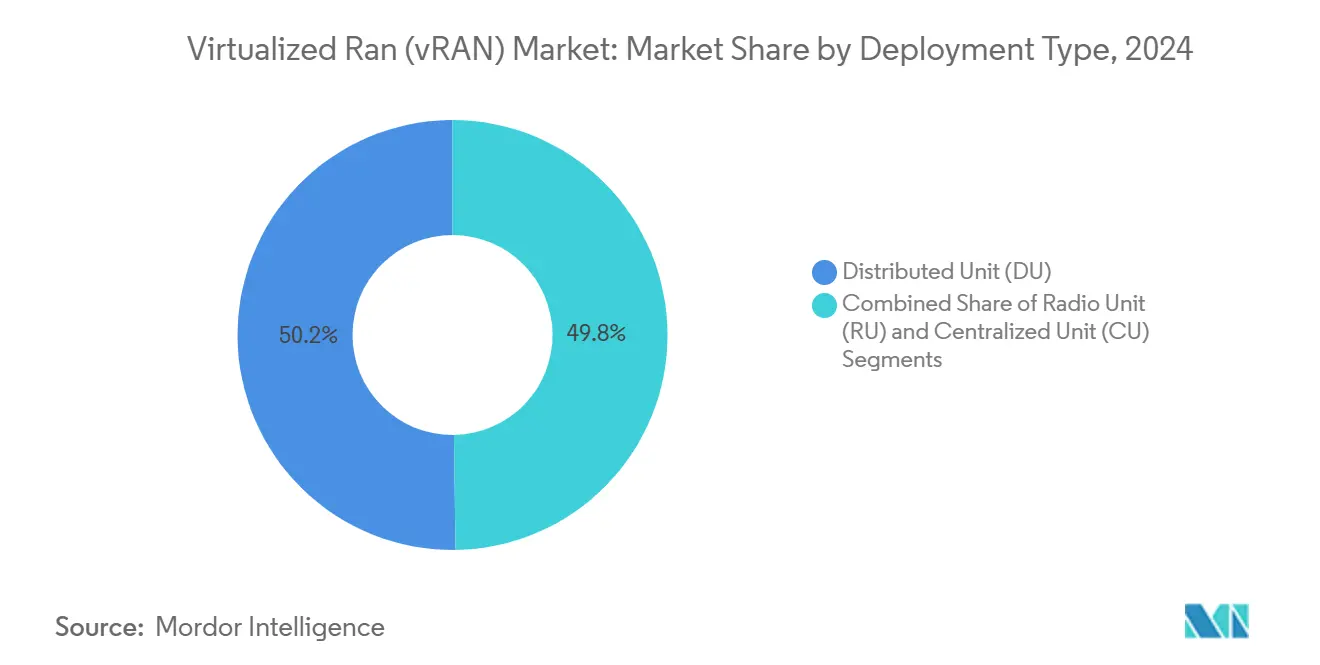
- By deployment type, distributed units led with 50.22% of the Virtualized RAN market share in 2024, while radio units are projected to advance at a 17.52% CAGR to 2030.
- By architecture, open vRAN held 46.44% revenue share of the Virtualized RAN market in 2024; cloud-native vRAN is forecast to expand at an 18.66% CAGR through 2030.
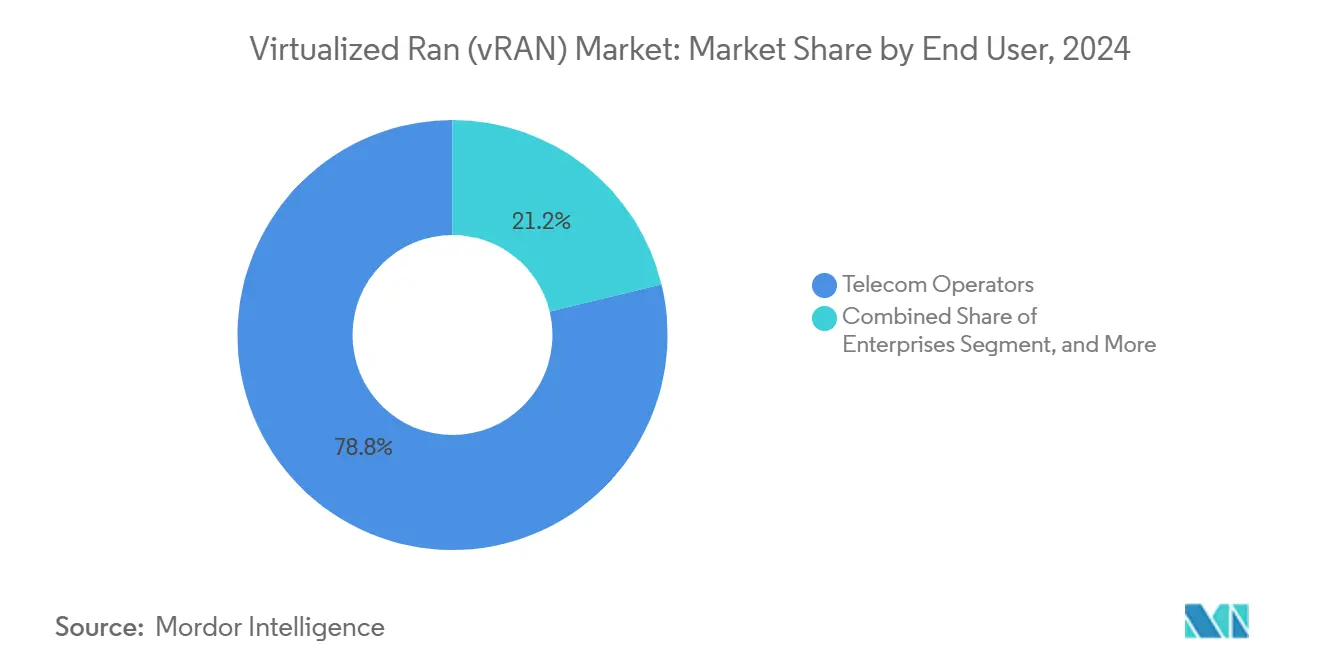
- By end user, telecom operators commanded a 78.78% share of the Virtualized RAN market in 2024, whereas enterprise demand is projected to grow at an 18.88% CAGR through 2030.
- By frequency band, sub-6 GHz accounted for 64.12% of the Virtualized RAN market size in 2024, while mmWave solutions are projected to rise at a 17.22% CAGR up to 2030.
- By geography, the Asia Pacific captured 36.88% revenue share of the Virtualized RAN market in 2024, while the Middle East region recorded the fastest regional CAGR at 17.26% through 2030.
Global Virtualized Ran (vRAN) Market Trends and Insights
Drivers Impact Analysis*
| Driver | (~) % Impact on CAGR Forecast | Geographic Relevance | Impact Timeline |
|---|---|---|---|
| Accelerated 5G Standalone Rollouts by Tier-1 Operators | +3.2% | Global, with concentration in North America and APAC | Medium term (2-4 years) |
| O-RAN Alliance-Led Multivendor Interoperability Momentum | +2.8% | Global, early adoption in Europe and North America | Long term (≥ 4 years) |
| Escalating Energy-Efficiency Targets for RAN Sites | +2.4% | Europe and North America, expanding to APAC | Medium term (2-4 years) |
| Cloud-Native Network Function Automation at Scale | +2.1% | Global, led by hyperscale markets | Long term (≥ 4 years) |
| Government Open-Network Incentive Programs in Asia Pacific | +1.8% | APAC core, spillover to MEA | Short term (≤ 2 years) |
| Rising Private-Network Demand from Industrial Campuses | +1.3% | North America and Europe, expanding globally | Medium term (2-4 years) |
| Source: Mordor Intelligence | |||
Accelerated 5G Standalone Rollouts by Tier-1 Operators
Operators in North America, Europe, and Asia Pacific are pushing full 5G standalone deployments to unlock network slicing and ultra-reliable low-latency communications, and this shift places the Virtualized RAN market at the center of modernization strategies. Verizon earmarked USD 10 billion of 2024-2025 capital for cloud-native RAN to support industrial automation services.[1]Verizon Communications, “5G Infrastructure Investment Strategy,” VERIZON.COM Virtualized architectures let operators separate real-time packet scheduling from non-real-time control, which improves spectral efficiency and accelerates service rollouts. Disaggregated functions can be scaled independently, allowing network slices to adjust bandwidth and compute resources on demand. The monetization logic rests on delivering differentiated quality-of-service tiers that legacy integrated baseband designs cannot support. Consequently, technology roadmaps now integrate centralized orchestration with distributed edge nodes for responsive capacity expansion aligned to traffic surges.
O-RAN Alliance-Led Multivendor Interoperability Momentum
The O-RAN Alliance framework standardizes open interfaces, encouraging an ecosystem where processors, radios, and control software from multiple vendors interoperate seamlessly. Deutsche Telekom validated 15 suppliers in a 2024 field test, proving commercial readiness for multivendor open RAN.[2] Deutsche Telekom, “O-RAN Interoperability Test Results,” TELEKOM.COM Procurement leverage improves as operators avoid single-vendor lock-in and negotiate better pricing. Best-of-breed component selection also accelerates innovation cycles because specialized software firms can iterate independently of hardware refresh timelines. Open-interface compliance now serves as a de-risking mechanism by embedding security test suites and performance benchmarks into the certification process. The net outcome is a competitive landscape where differentiation shifts from proprietary hardware to agile software and advanced analytics.
Escalating Energy-Efficiency Targets for RAN Sites
Regulators and corporate boards are mandating carbon-reduction roadmaps that pressure carriers to cut energy consumption across radio sites. The European Union’s Digital Decade program urges a 55% emissions reduction by 2030, prompting operators to migrate to cloud-native RAN that can lower site power draw by up to 30%. Virtualized workloads migrate offsite or power down during trough traffic periods, trimming operational expenditure in markets where energy now exceeds 20% of network operating costs. Enhanced telemetry within virtualized stacks delivers granular visibility that supports predictive shutdown of underutilized hardware. Savings gained through reduced cooling and space requirements strengthen the return-on-investment narrative for full disaggregation. As sustainability targets tighten, efficiency will evolve from a tactical advantage to a regulatory requirement.
Cloud-Native Network Function Automation at Scale
Containerized RAN functions orchestrated via Kubernetes clusters introduce day-zero to day-two automation that slashes deployment lead times from weeks to hours. Red Hat’s OpenShift integrations showcase automated rollouts, scaling, and self-healing of distributed RAN workloads, cutting manual intervention substantially. Automated Continuous Integration and Continuous Delivery pipelines accelerate feature releases without jeopardizing service assurance commitments. Operators can curate catalog-based network slices and offer on-demand enterprise connectivity, adding new revenue lines. Machine-learning-driven closed-loop automation predicts anomalies, initiates corrective actions, and optimizes spectrum allocation in real time. Such at-scale automation mitigates operational complexity as the Virtualized RAN industry moves toward hundreds of microservices managing differentiated use cases.
Restraints Impact Analysis*
| Restraint | (~) % Impact on CAGR Forecast | Geographic Relevance | Impact Timeline |
|---|---|---|---|
| Integration Complexity with Legacy Purpose-Built RAN | -1.8% | Global, acute in mature markets with extensive legacy infrastructure | Short term (≤ 2 years) |
| Limited Fronthaul Fiber Availability in Emerging Regions | -1.4% | Emerging markets in Africa, Latin America, rural APAC | Medium term (2-4 years) |
| Persistent Security Concerns over Disaggregated Stacks | -1.1% | Global, heightened in government and enterprise segments | Medium term (2-4 years) |
| Vendor Skill-Gap in Real-Time Cloud Optimization | -0.9% | Global, most acute in emerging markets and smaller operators | Short term (≤ 2 years) |
| Source: Mordor Intelligence | |||
Integration Complexity with Legacy Purpose-Built RAN
Carriers operating dense 4G macro grids face extended timelines when blending virtualized basebands with conventional radio heads, often requiring bespoke middleware that strains engineering resources. ATandT disclosed an 18-month schedule slip during its phased virtualization program due to unforeseen interoperability issues. Dual management systems add overhead as legacy OSS and new cloud orchestrators coexist. Each integration cycle demands exhaustive end-to-end testing to assure key performance indicators such as call-setup success rate. Operators exposed to tight service-level agreements hesitate to move faster, prioritizing stability over innovation speed. Capex and opex escalate as parallel infrastructures must operate until full cut-over, eroding near-term financial gains expected from virtualization.
Limited Fronthaul Fiber Availability in Emerging Regions
Virtualized RAN architectures depend on high-capacity, low-latency links between radio and centralized processing sites, yet many rural and emerging markets lack affordable fiber backbones. The World Bank reported that 60% of Sub-Saharan rural communities and 45% of rural Latin America still lack adequate fiber connectivity in 2024. Microwave substitutes add latency and restrict bandwidth, undermining RAN centralization benefits. Building new fiber can exceed USD 50,000 per kilometer in remote terrain, jeopardizing investment economics without state subsidies. Consequently, operators often default to distributed architectures that sacrifice cost-saving pooling advantages. The infrastructure gap risks widening the digital divide as advanced 5G services reach maturity elsewhere.
*Our forecasts treat driver/restraint impacts as directional, not additive. The impact forecasts reflect baseline growth, mix effects, and variable interactions.
Segment Analysis
By Deployment Type: Edge Processing Drives DU Dominance
Within the USD 21.74 billion Virtualized RAN market size of 2025, distributed units account for 50.22% of revenue, underscoring their importance in executing latency-sensitive scheduling and hybrid automatic repeat request functions. The segment continues to benefit from edge computing strategies that place compute resources nearer to the radio head, cutting round-trip delays for immersive media and autonomous machinery. Operators leverage DU flexibility to re-allocate processing loads dynamically, improving spectrum utilization during peak events. Laboratory proofs from Intel’s FlexRAN reference design show that workload partitioning can adapt to traffic volatility without manual intervention. Meanwhile, radio units are forecast to grow at 17.52% CAGR on rising adoption of massive MIMO arrays that demand intelligent beam management. Their advancement is amplified by cost-optimized silicon and software-defined functionality that supports frequency agility across sub-6 GHz and mmWave bands. Centralized units retain relevance for non-real-time tasks, pooling compute resources in core data centers where economies of scale prevail. The evolving mix lets carriers tailor architecture to application latency profiles, which enhances overall network economics.
A second wave of DU deployment emphasizes power efficiency. Dynamic voltage and frequency scaling, coupled with AI-driven workload orchestration, allows servers to throttle consumption without compromising service quality. Telcos tap these features to meet sustainability metrics while maintaining user experience parity. Integration with container orchestration permits fast instantiation of DU software images, cutting maintenance windows and freeing personnel for higher-value tasks. This agility differentiates distributed units from legacy distributed base stations, where hardware refresh cycles constrained feature velocity. In urban densification projects, operators install DU clusters in lampposts and utility cabinets, circumventing expensive rooftop leases. Collectively, these dynamics cement the DU segment’s leadership in the Virtualized RAN market and shape procurement roadmaps toward modular, standards-compliant hardware.


By Architecture: Open Standards Challenge Proprietary Dominance
Open vRAN currently commands 46.44% revenue share, reflecting early operator confidence in multivendor interoperability. Yet cloud-native vRAN registers the fastest expansion at 18.66% CAGR, propelled by fully containerized functions that streamline continuous integration pipelines. Cloud-native design allows microservices to scale independently based on real-time demand, preventing over-provisioning and shrinking operational overhead. Operators gain vendor flexibility by decoupling lifecycle management from specific appliance roadmaps, which lessens total cost of ownership across multi-generation networks. VMware’s telco cloud strategy showcases how virtualization layers integrate with O-RAN specifications, bringing NFV maturity into the 5G era. Proprietary vRAN retains pockets of demand in mission-critical environments requiring deterministic latency guarantees that current open stacks cannot yet provide. However, the cost-performance gap narrows each release cycle, making proprietary lock-in less defensible.
Transition journeys often start with hybrid architectures, enabling operators to harvest immediate efficiency gains without jeopardizing existing service-level agreements. As container orchestration stabilizes, carriers move non-real-time functions into centralized data centers and keep real-time workloads at the edge, balancing latency and pooling benefits. Continuous benchmarking by the O-RAN Alliance ensures performance parity across open and legacy interfaces, reinforcing confidence in multivendor deployments. Commercial contracts increasingly include service guarantees bound by community-driven compliance badges, fostering a virtuous adoption loop. Over the forecast horizon, investment gravitation toward cloud-native vRAN is expected to intensify, redefining cost structures and shifting competitive advantage toward software innovation.
By End User: Enterprise Adoption Extends Beyond Operator Core
Telecom operators dominate with 78.78% market share, leveraging pre-existing spectrum licenses and nationwide coverage obligations. Private enterprise demand is rising at an 18.88% CAGR as manufacturers, logistics hubs, and automotive plants deploy bespoke 5G networks for Industry 4.0 workflows. The enterprise growth trajectory accelerates because standardized slice templates simplify deployment while safeguarding data within campus boundaries. BMW’s German assembly lines illustrate how virtualized RAN underpins adaptive robotics, computer vision quality inspection, and real-time AGV coordination. Neutral host providers emerge as intermediaries, bundling spectrum, RAN infrastructure, and managed services into turnkey offerings for companies lacking telco expertise. Differentiated security controls embedded in virtualized stacks meet stringent operational technology requirements, reinforcing adoption momentum.
Operators are repurposing existing spectrum for campus deployments, monetizing under-utilized bands and building incremental revenue streams. As cloud-native orchestration matures, network slices can be spun up in minutes, enabling pay-as-you-grow models tailored to production line expansions or temporary projects. Virtualized architectures simplify lifecycle management across diverse hardware estates, easing multi-site rollouts. Integration with edge computing platforms allows on-premises analytics to process machine data locally, preserving data sovereignty and reducing WAN transmission costs. With these synergies, the enterprise segment will continue to erode the operators’ share margin, injecting fresh competitive dynamics into the Virtualized RAN industry.
By Frequency Band: mmWave Gains Momentum Despite Sub-6 GHz Leadership
Sub-6 GHz frequencies provide wide-area coverage and currently hold 64.12% of revenue, anchoring nationwide 5G deployments. mmWave systems, though nascent, are progressing at a 17.22% CAGR as beamforming advances mitigate historic propagation limits. Qualcomm’s 2024 algorithms improved spectral efficiency by 15%, extending cell edge performance for urban deployments. Virtualized RAN enables dynamic spectrum assignment that steers traffic between bands based on application latency and throughput requirements. Fixed wireless access providers exploit mmWave to deliver gigabit connectivity where fiber is cost-prohibitive. Indoor venues, stadiums, factories, and malls adopt mmWave small cells to support high-density user scenarios without resorting to expensive DAS retrofits. By pooling baseband resources, cloud-native controllers can rapidly shift capacity to mmWave clusters during peak events, preserving user experience.
Regulatory actions continue to open new mmWave blocks, and spectrum auctions increasingly bundle contiguous channels that favor high-band operations. Vendors respond with integrated RF front-ends that handle sub-6 and mmWave bands on common hardware, simplifying stock-keeping and installation. Combining both spectrum layers, operators orchestrate carrier aggregation strategies that deliver consistent throughput across mixed coverage zones. The technological convergence supports robust business cases for incremental mmWave rollout, ensuring complementary coexistence with sub-6 leadership rather than displacing it.
Geography Analysis
Asia Pacific remains the largest regional contributor, accounting for 36.88% of 2024 revenue as China, Japan, and India orchestrate nationwide 5G investments supported by favorable industrial policies. Production-linked incentives in India lower equipment costs, while Japan’s Society 5.0 vision funds pilot programs that validate cloud-native architectures at scale. Mature semiconductor supply chains in Taiwan and South Korea cut component lead times, accelerating deployments. Australia catalyzes distributed RAN research to bridge its vast rural gaps, showcasing DU clusters housed in weatherized roadside cabinets. This collective momentum secures Asia Pacific’s leadership in capturing the expanding Virtualized RAN market.
The Middle East registers the fastest pace, growing at a 17.26% CAGR as sovereign wealth funds finance smart-city megaprojects where autonomous transport, IoT lighting, and immersive tourism require ultra-reliable low-latency networks. Saudi Arabia’s NEOM initiative and the UAE’s AI 2031 agenda stipulate advanced 5G infrastructure that favors disaggregated architectures for flexible capacity scaling. Cross-border knowledge exchange via strategic vendor partnerships accelerates standards adoption, and spectrum licensing regimes are aligned to encourage neutral host models that support rapid multivendor rollouts. These drivers position the Middle East as a bellwether for large-scale, greenfield virtualized deployments.
North America and Europe sustain mid-teens growth as carriers upgrade legacy macro layers to cloud-native RAN primarily to meet energy-reduction commitments. Established fiber grids reduce fronthaul constraints, letting operators shift traffic to centralized pools that cut operating costs. The U.S. Federal Communications Commission’s 5G FAST plan and the European Union’s Digital Decade create supportive regulatory frameworks. Enterprise private-network uptake is most pronounced in these mature economies, reflecting advanced industrial automation and stringent data-privacy mandates. By contrast, Africa and Latin America trail due to limited fiber availability, although multilateral funding initiatives and infrastructure-sharing models signal a potential inflection beyond the forecast horizon.

Competitive Landscape
Supplier power is widely distributed across traditional network equipment manufacturers, cloud-native software specialists, semiconductor vendors, and hyperscale infrastructure providers. No single vendor holds a commanding presence, making the Virtualized RAN market moderately fragmented. Established OEMs such as Nokia, Ericsson, and Samsung leverage decades-long operator relationships and depth in integration services, while software-centric players including Mavenir and Parallel Wireless disrupt via rapid feature cadence geared to open interfaces. Semiconductor titans like Intel position reference designs such as FlexRAN to seed ecosystems and expand processor demand across DU and CU footprints.[3]Intel Corporation, “FlexRAN Partner Ecosystem,” INTEL.COM
Strategic partnerships form the centerpiece of differentiation. Nokia’s USD 2.3 billion cloud-native contract with Bharti Airtel exemplifies scale deployments validated by co-innovation roadmaps in automation and edge computing. Cloud providers Amazon Web Services and Microsoft Azure integrate telco cloud zones into global regions, providing Infrastructure-as-a-Service options that bypass capex hurdles for greenfield entrants. Competitive intensity centers on securing O-RAN Alliance badging for multivendor compatibility and accumulating intellectual property in near-real-time RIC algorithms.
Pricing pressure is emerging as operators issue tenders mandating open interfaces and multivendor proofs, squeezing high-margin hardware loops. Vendors answer with lifecycle services managed RIC analytics, continuous security monitoring, and automated software pipelines that create recurring revenue streams beyond one-time equipment sales. Patent landscapes around radio-aware scheduling and AI-based optimization expand, and service differentiation skews toward software prowess rather than hardware performance alone.
Virtualized Ran (vRAN) Industry Leaders
NEC Corporation
Samsung Electronics Co., Ltd.
Nokia Corporation
Telefonaktiebolaget LM Ericsson
Fujitsu Limited
- *Disclaimer: Major Players sorted in no particular order

Recent Industry Developments
- May 2025: Mavenir and partners: commercial deployments of Open vRAN small cells and operator trials. Mavenir reported successful deployments of Open vRAN small cells in Glasgow for Three UK, showcasing advantages in urban scale, coverage, and capacity.
- April 2025: Rakuten AI-driven intelligent RIC launched in Japan, Rakuten Mobile (along with Rakuten Symphony) progressed the implementation of AI-driven RICs throughout its Open/vRAN, showcasing AI automation and pilots for RIC monetization
- March 2025: SoftBank + Nokia: AI + vRAN together on one GPU server. SoftBank and Nokia revealed orchestration enabling AI and vRAN to utilize the same GPU server and optimize resources dynamically—an evident advancement toward “AI-RAN” frameworks
- October 2024: Nokia announced a USD 2.3 billion contract with Bharti Airtel to deploy cloud-native 5G RAN across major Indian metros.


Global Virtualized Ran (vRAN) Market Report Scope
| Centralized Unit (CU) |
| Distributed Unit (DU) |
| Radio Unit (RU) |
| Open vRAN |
| Cloud-Native vRAN |
| Proprietary vRAN |
| Telecom Operators |
| Enterprises |
| Neutral Host and Private Networks |
| Sub-6 GHz |
| mmWave (>24 GHz) |
| North America | United States |
| Canada | |
| Mexico | |
| South America | Brazil |
| Argentina | |
| Rest of South America | |
| Europe | Germany |
| United Kingdom | |
| France | |
| Italy | |
| Spain | |
| Rest of Europe | |
| Asia Pacific | China |
| Japan | |
| India | |
| South Korea | |
| Australia | |
| Rest of Asia Pacific | |
| Middle East | Saudi Arabia |
| United Arab Emirates | |
| Turkey | |
| Rest of Middle East | |
| Africa | South Africa |
| Nigeria | |
| Kenya | |
| Rest of Africa |
| By Deployment Type | Centralized Unit (CU) | |
| Distributed Unit (DU) | ||
| Radio Unit (RU) | ||
| By Architecture | Open vRAN | |
| Cloud-Native vRAN | ||
| Proprietary vRAN | ||
| By End User | Telecom Operators | |
| Enterprises | ||
| Neutral Host and Private Networks | ||
| By Frequency Band | Sub-6 GHz | |
| mmWave (>24 GHz) | ||
| By Geography | North America | United States |
| Canada | ||
| Mexico | ||
| South America | Brazil | |
| Argentina | ||
| Rest of South America | ||
| Europe | Germany | |
| United Kingdom | ||
| France | ||
| Italy | ||
| Spain | ||
| Rest of Europe | ||
| Asia Pacific | China | |
| Japan | ||
| India | ||
| South Korea | ||
| Australia | ||
| Rest of Asia Pacific | ||
| Middle East | Saudi Arabia | |
| United Arab Emirates | ||
| Turkey | ||
| Rest of Middle East | ||
| Africa | South Africa | |
| Nigeria | ||
| Kenya | ||
| Rest of Africa | ||


Key Questions Answered in the Report
What is the projected revenue for virtualized RAN by 2030?
Revenue is forecast to reach USD 47.58 billion by 2030, expanding at a 16.96% CAGR from the 2025 base.
Which deployment element holds the largest share today?
Distributed units account for 50.22% of 2024 revenue, reflecting their central role in edge-centric processing.
Why are enterprises investing in private 5G RAN deployments?
Enterprises seek dedicated connectivity for Industry 4.0 automation, and virtualized architectures allow customized slices and on-premises edge compute.
Which region is growing fastest in adopting virtualized RAN?
The Middle East leads with a 17.26% CAGR, powered by smart-city projects backed by sovereign wealth funds.
How do open RAN standards impact vendor selection?
O-RAN interfaces reduce lock-in, enabling multivendor ecosystems that lower procurement costs and accelerate feature innovation.
What infrastructure barrier limits adoption in emerging markets?
Limited fronthaul fiber availability restricts centralized processing models, slowing deployments in rural Africa and Latin America.
Page last updated on:


