Virtual Goods Market Size and Share
Market Overview
| Study Period | 2021 - 2031 |
|---|---|
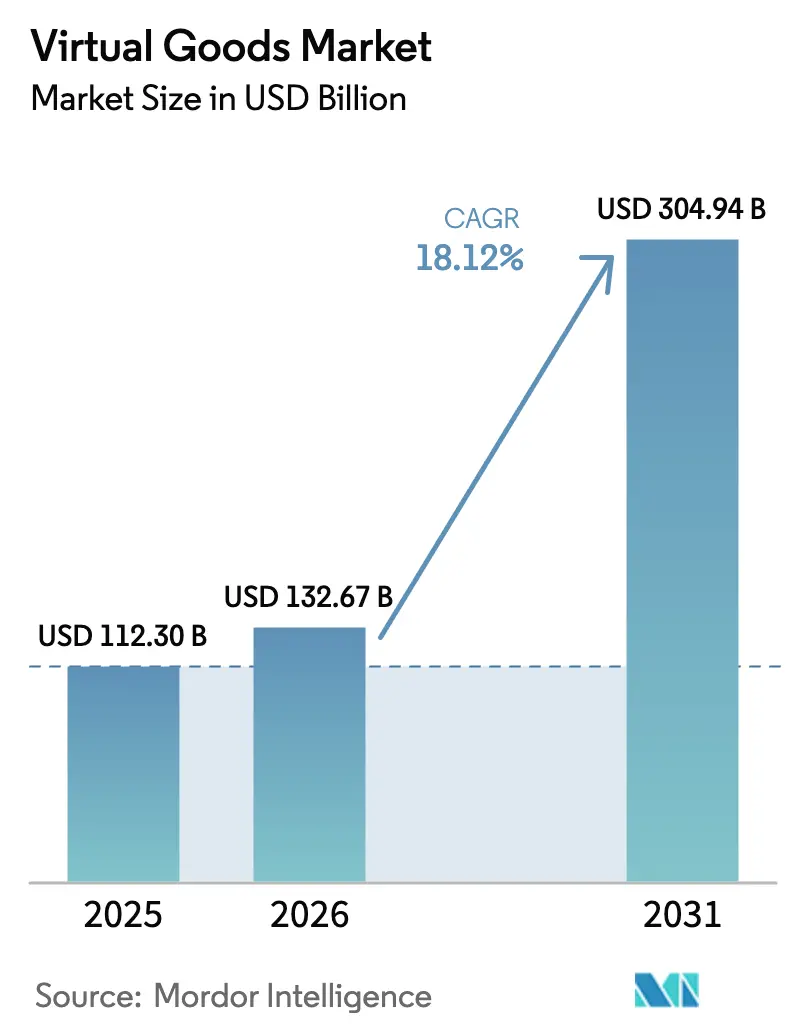
| Market Size (2026) | USD 132.67 Billion |
| Market Size (2031) | USD 304.94 Billion |
| Growth Rate (2026 - 2031) | 18.12% CAGR |
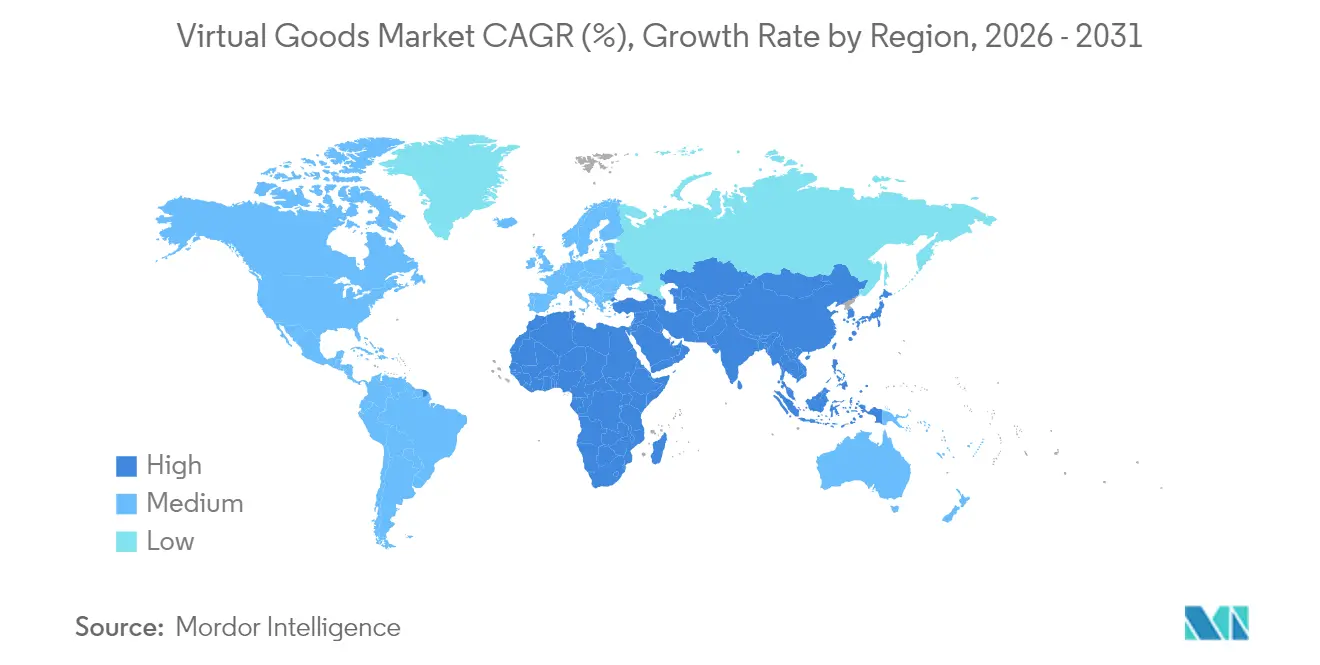
| Fastest Growing Market | Middle East and Africa |
| Largest Market | Asia Pacific |
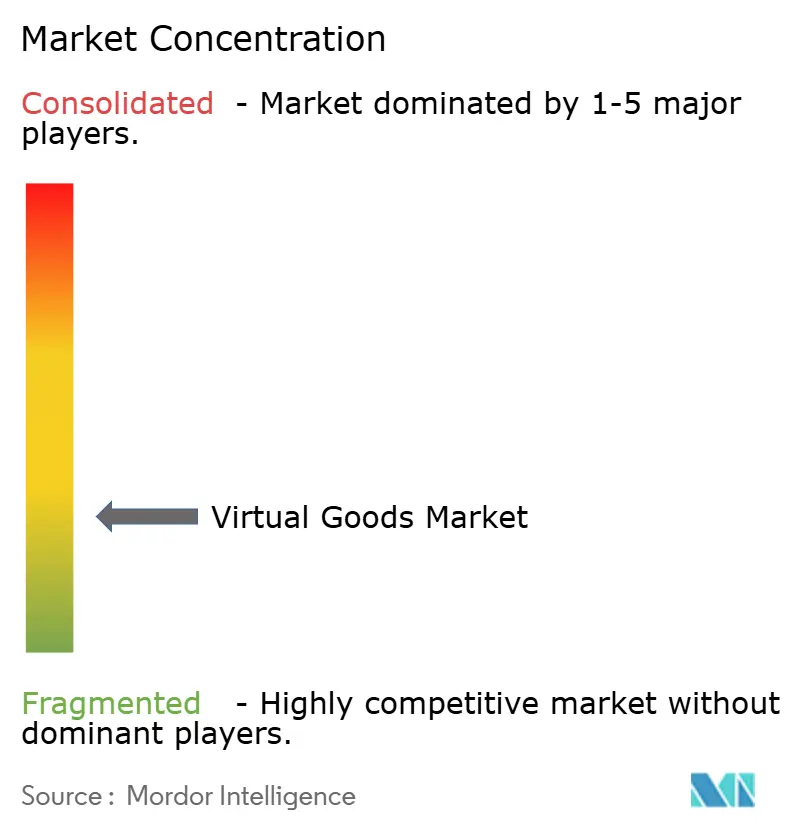
| Market Concentration | Low |
Major Players *Disclaimer: Major Players sorted in no particular order Image © Mordor Intelligence. Reuse requires attribution under CC BY 4.0. | |
Virtual Goods Market Analysis by Mordor Intelligence
The Virtual Goods Market size was valued at USD 112.3 billion in 2025 and estimated to grow from USD 132.67 billion in 2026 to reach USD 304.94 billion by 2031, at a CAGR of 18.12% during the forecast period (2026-2031). Solid momentum comes from rising digital ownership, stronger Web3 wallet penetration, and government-backed metaverse programs across high-growth regions. Blockchain-enabled assets, although they represented only 35.5% of 2024 spending, are expanding faster than centralized alternatives at a 21.8% CAGR, encouraged by verifiable scarcity and cross-platform portability. Asia retains leadership through virtual goods market share powered by an extensive mobile-gaming audience and seamless digital payments. Meanwhile the Middle East & Africa is positioned for the quickest expansion as 5G coverage widens and initiatives such as Dubai’s “VR City 2030” stimulate demand. Subscription-based business models are accelerating at consumers prefer predictable access to rotating content over random loot boxes.
Key Report Takeaways
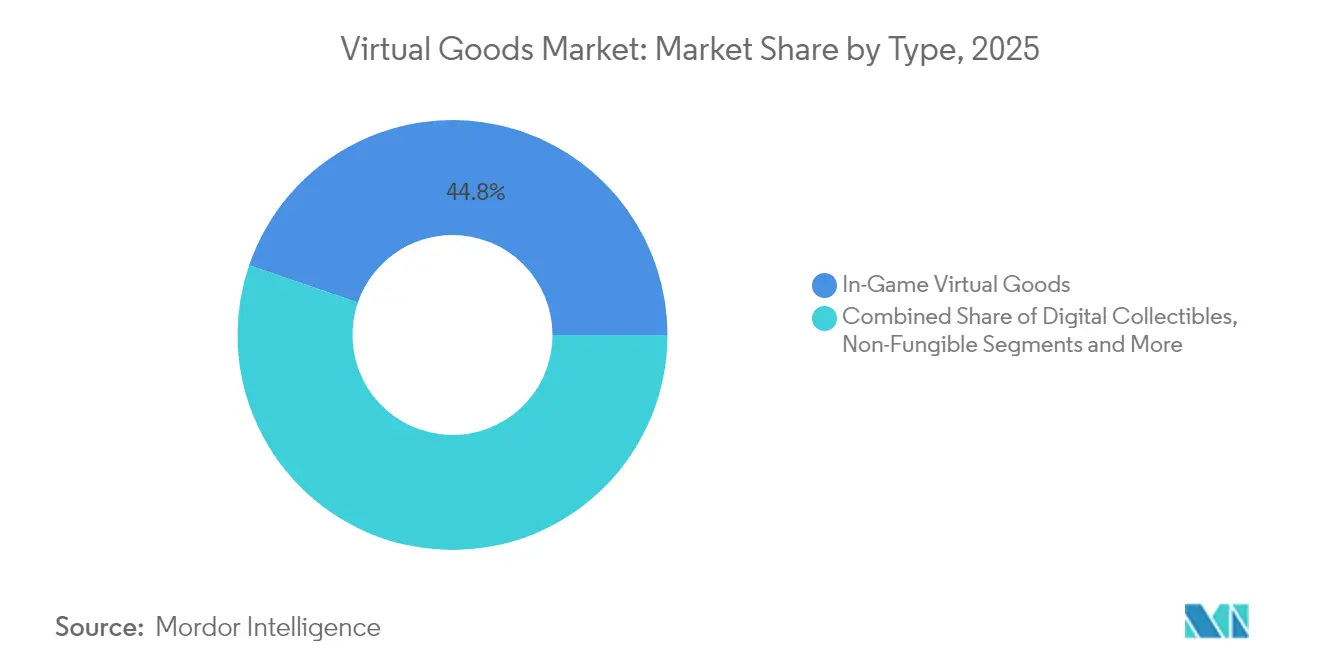
- By type, in-game virtual goods led with 44.75% of the virtual goods market share in 2025; virtual land and property is forecast to expand at a 21.55% CAGR through 2031.
- By platform, mobile applications captured 39.05% revenue share in 2025 while metaverse worlds are projected to climb at a 20.35% CAGR to 2031.
- By device, smartphones and tablets accounted for 46.85% of the virtual goods market size in 2025; VR/AR head-mounted displays are advancing at 20.32% CAGR.
- By technology, non-blockchain systems controlled 63.85% of 2025 revenue, yet blockchain-enabled assets will post the fastest 21.1% CAGR.
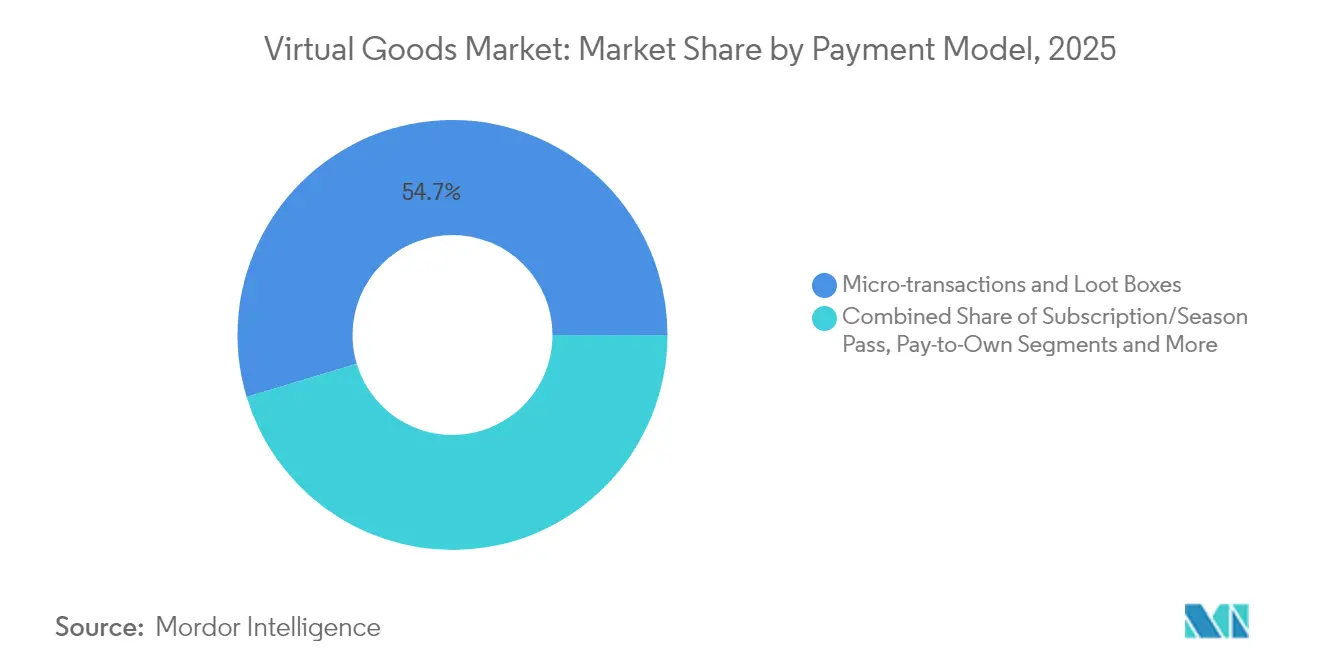
- By payment model, micro-transactions and loot boxes held 54.65% of the virtual goods market size in 2025, while subscriptions show the highest 18.95% CAGR outlook.
- By geography, Asia generated 39.85% of 2025 spending; the Middle East & Africa is set to log the strongest 20.1% CAGR through 2031.
Note: Market size and forecast figures in this report are generated using Mordor Intelligence’s proprietary estimation framework, updated with the latest available data and insights as of 2026.
Global Virtual Goods Market Trends and Insights
Drivers Impact Analysis*
| Driver | (~) % Impact on CAGR Forecast | Geographic Relevance | Impact Timeline |
|---|---|---|---|
| Metaverse platforms boosting demand for wearable NFTs | +3.2% | North America, spillover to Europe | Medium term (2-4 years) |
| Web3 wallets enabling asset monetization | +4.1% | Asia-Pacific, global adoption follows | Short term (≤ 2 years) |
| Play-to-earn models accelerating in-game currency purchases | +2.8% | Latin America, Southeast Asia expansion | Medium term (2-4 years) |
| Brand collaborations for limited-edition collectibles | +2.5% | Europe, North America | Short term (≤ 2 years) |
| 5G and cloud gaming spurring real-time skins demand | +1.9% | Nordics, Western Europe, North America | Medium term (2-4 years) |
| Tokenized real-world assets driving virtual land sales | +2.7% | Middle East, global expansion | Long term (≥ 4 years) |
| Source: Mordor Intelligence | |||
Proliferation of Metaverse Platforms Driving Demand for Wearable NFTs in North America
Immersive social worlds are redefining digital fashion, prompting North American users to treat wearable NFTs as status symbols. Fifty-four percent of metaverse participants cite high-quality visual identity as essential, and limited drops from brands such as Nike consistently sell out across Roblox and Decentraland. Interoperable blockchain verification secures value beyond one platform and stimulates a projected 30% annual rise in wearable NFT sales through 2027.[1] YouGov, “Metaverse in 2025 – What users want and what's holding others back”, yougov.com
Integration of Web3 Wallets Enabling Ownership & Monetization of Digital Assets in Asia-Pacific
Web3 wallets supply the architecture for true ownership and have lifted regional transactions by 37% during 2024. Hybrid fiat-on-chain models, already active in China, sidestep crypto bans while preserving blockchain proofs, opening new revenue lines that BCG estimates could add USD 2-3 billion to gaming by 2028.
Rise of Play-to-Earn Models Accelerating Purchase of In-Game Virtual Currency in Latin America
P2E adoption has soared in Argentina and Venezuela where gamers hedge against inflation using virtual currencies on low-fee chains such as Solana. Developers tailoring token economics for this engaged community achieve stronger liquidity and higher retention.
Brand Collaborations for Limited-Edition Digital Collectibles Boosting Revenue in Europe
Luxury houses and entertainment IP owners partner with digital platforms to mint scarce items that attract 340% secondary-market premiums. PwC expects such initiatives to feed into USD 1 trillion global advertising revenue by 2026.
Restraints Impact Analysis*
| Restraint | (~) % Impact on CAGR Forecast | Geographic Relevance | Impact Timeline |
|---|---|---|---|
| Regulatory uncertainty around digital-asset classification | -2.3% | North America, Europe | Medium term (2-4 years) |
| Crypto-payment volatility deterring mainstream users | -1.8% | Global, higher in emerging markets | Short term (≤ 2 years) |
| Copyright risks for user-generated content | -1.6% | Global | Medium term (2-4 years) |
| Security breaches in NFT marketplaces | -1.9% | Asia, global spillover | Short term (≤ 2 years) |
| Source: Mordor Intelligence | |||
Regulatory Uncertainty Around Digital-Asset Classification in US & EU
Fragmented legal definitions slow cross-border scaling. The SEC logged record enforcement actions in 2024 and keeps crypto on its 2025 exam priorities, while Europe moves ahead with MiCA yet faces local implementation hurdles.
High Volatility of Crypto-Payment Methods Deterring Mainstream Consumers
Double-digit price swings undermine trust in token-denominated purchases. Stablecoin market capitalization now exceeds USD 170 billion, but regulators warn on systemic risk, prompting hybrid settlement models that isolate end-users from crypto exposure.
*Our forecasts treat driver/restraint impacts as directional, not additive. The impact forecasts reflect baseline growth, mix effects, and variable interactions.
Segment Analysis
By Type: Virtual Land Leads Digital Real Estate Boom
In-game assets retained 44.75% virtual goods market share in 2025, underscoring the entrenched monetization of cosmetics and power-ups. Virtual land is scaling fastest at 21.55% CAGR as brands acquire parcels for flagship experiences, sending premium plots above the USD 1 million threshold. The shift from speculative flips to revenue-yielding retail, event, and advertising spaces strengthens the investment story.
Digital collectibles splinter into NFT-backed drops with immutable scarcity and traditional locked-platform skins. Verified rarity commands mark-ups that enrich creators and collectors alike. Virtual currencies act as payment rails that keep user spending inside ecosystem loops, boosting lifetime value. Emerging service categories such as avatar styling build experiential depth, while tokenized physical assets blur lines between tangible and virtual ownership, enlarging the overall virtual goods market.


By Platform: Metaverse Environments Redefine Engagement
Mobile titles generated 39.05% of 2025 revenue owing to their reach and low friction. Even so, metaverse worlds are charting a 20.35% CAGR, making them the new epicenter of social commerce. User time spent in persistent 3D venues rises each quarter, which increases demand for identity items that work across multiple spaces. Social networks amplify gifting functions, as 17 million US Twitch members and 5.6 million DouYu users purchase tips and badges.
PC and console ecosystems retain high-ARPU audiences who buy intricate skins and mods, while crypto-native hubs entice early adopters with self-custody and resale rights. Convergence is underway, yielding cross-platform bundles that sustain value wherever users log in. This alignment of user expectations cements the virtual goods market as a multi-platform economy.
By Device: AR/VR Headsets Drive Premium Experiences
Smartphones and tablets contributed 46.85% to the 2025 virtual goods market size thanks to vast install bases and instant payment links. Yet VR/AR headsets top the growth chart at 20.32% CAGR, helped by Meta’s cumulative USD 100 billion investment that pushes hardware prices lower. VR shoppers exhibit 46% higher engagement and 17.5% better conversion, which allows premium pricing.
PC and console users demand high-fidelity items driven by robust GPUs. Cross-device entitlements let a sword bought on mobile unlock a richer animated version in VR, enlarging cart sizes. Studios increased multi-platform game count by 40% in 2024, reinforcing the need for device-agnostic asset libraries inside the virtual goods market.
By Technology: Blockchain Assets Gain Momentum
Centralized systems still own 63.85% of sales because they deliver turnkey onboarding, but blockchain-enabled goods show the sharpest rise at 21.1% CAGR. Users prize verifiable ownership, secondary resale, and interoperability, while developers leverage token economies for creator royalties. Regulatory probes by the European Commission keep competitive barriers lower by discouraging walled-garden lock-ins.
Hybrid stacks now surface, embedding custodial wallets inside familiar interfaces. This tolerant architecture absorbs future rule shifts and widens participation beyond crypto-native audiences, enhancing resilience across the virtual goods market.
By Payment Model: Subscriptions Reshape Revenue Streams
Micro-transactions and loot boxes controlled 54.65% of 2025 turnover, yet subscriptions post the brightest 18.95% CAGR. Thirty-six percent of 2025 mobile-game revenue already came from passes that promise steady content refreshes, and consumer spend could reach USD 11 billion in 2025. Predictable cash flows improve working-capital cycles and enable heavier live-ops investments.
One-time pay-to-own items stay relevant for collectibles with enduring appeal. Combined models flourish as studios pair rewarded videos with offerwalls to improve retention, proving that diversified monetization maximizes take-rate across the virtual goods market.
By Application: Metaverse Events Transform Engagement
Online games accounted for 58.10% of 2025 outlays, yet metaverse and virtual events head the growth board at 23.6% CAGR. Live concerts, branded product launches, and fan conventions inside virtual arenas multiply engagement while removing geographic limits. Brands profit from ticketing, sponsorship, and branded merch skins, embedding virtual goods at every touchpoint.
Social gifting rises on short-form platforms where fans reward creators with stickers and badges. Digital commerce pilots blend showrooming and immediate purchase of digital twins. Educational, tourism, and healthcare simulations appear small now, but they set the stage for specialized asset categories that further diversify the virtual goods market.
Geography Analysis
Asia generated 39.85% of 2025 revenue on the back of an 800-million-strong mobile-gaming audience, advanced QR-code payments, and high ARPU in Japan and South Korea. China’s policy constraints on crypto prompt creative compliance, centering on fiat-settled blockchain proofs that maintain asset legitimacy. Web3 wallet use spreads quickly, catalyzing creator-to-player commerce. Security lapses in NFT markets dampen sentiment, yet investment persists as firms upgrade custodial standards.
North America ranks second, propelled by premium spenders who seek identity signaling inside games, metaverse spaces, and social media. Wearable NFTs flourish as 54% of users prioritize avatar aesthetics. Regulatory opacity remains a drag, with divergent SEC and CFTC interpretations increasing cost of compliance. Strategic tie-ups like Disney’s USD 1.5 billion Epic Games stake enlarge branded asset pipelines, reshaping content supply chains. The Middle East & Africa delivers the top 20.1% CAGR outlook as 5G and public-sector metaverse strategies accelerate adoption. Dubai’s VR roadmap induces private builds of retail showrooms and event sites. Tokenized property resonates with investors seeking Sharia-compliant diversification. Sub-Saharan Africa’s mobile-first demographic embraces low-bandwidth collectibles, adding fresh volume to the virtual goods market. Latin America benefits from P2E mechanics that turn gameplay into viable side income amid economic volatility, enhancing platform liquidity and stickiness.

Competitive Landscape
Global leadership is moderate in concentration. Tencent, Roblox, and Meta anchor the centralized sphere through user-scale advantages and proprietary payment rails. Blockchain-native challengers such as Dapper Labs and Animoca Brands carve share via non-custodial wallets and royalty pipelines. Convergence multiplies as incumbents trial tokenized passes and decentralized outfits add comfort layers like credit-card checkout.
Strategic control of the value chain is rising. Disney’s minority equity in Epic Games fuses IP, engine technology, and storefront access, setting a template for vertical synergies. Regulatory developments reshape alliances: the US Department of Defense listing of Tencent injects geopolitical risk that may reroute sourcing and co-development. Large studios deploy AI to trim asset-creation cycles, with 62% adoption across workflows, enabling rapid response to trend spikes.
White-space opportunities lie in interoperability middleware, creator tooling, and sector-specific asset libraries. Nordic studios gain public funding that accelerates niche genre experimentation, while Gulf developers secure capital to infuse regional culture into skins and environments. Competitive intensity will hinge on the pace at which cross-platform standards mature, as those standards can dilute lock-in advantages and redistribute rents within the virtual goods market.
Virtual Goods Industry Leaders
Tencent Holdings Ltd.
Meta Platforms Inc.
Roblox Corporation
Epic Games Inc.
Valve Corporation
- *Disclaimer: Major Players sorted in no particular order

Recent Industry Developments
- May 2025: Meta launched a USD 50 million Creator Fund to sponsor user-generated virtual goods across its portfolio.
- March 2025: Tencent lifted its stake in Kadokawa Corporation, broadening Japanese IP access for future asset pipelines.
- March 2025: Tilting Point opened a USD 150 million user-acquisition fund aimed at scaling mobile titles with heavy virtual goods monetization.
- March 2025: Tripledot agreed to acquire AppLovin’s games unit for USD 900 million, boosting cross-promotion reach.


Global Virtual Goods Market Report Scope
Virtual goods, existing in digital form, are non-physical items commonly found on online platforms, games, or in virtual environments. While intangible and lacking a physical presence, these goods can be bought, sold, traded, or utilized within digital experiences. Typically acquired using real-world or in-game currency, virtual goods enhance user experiences, offer customization, or introduce added functionality in virtual spaces.
The study tracks the revenue accrued through the sale of virtual goods by various players across the globe. The study also tracks the key market parameters, underlying growth influencers, and major vendors operating in the industry, which supports the market estimations and growth rates over the forecast period. The study further analyses the overall impact of COVID-19 aftereffects and other macroeconomic factors on the market. The report’s scope encompasses market sizing and forecasts for the various market segments.
The virtual goods market is segmented by component(in-game virtual goods, digital collectibles, virtual currency, virtual land and property, and virtual services), application(online games, social media platforms, and others), and geography (North America, Europe, Asia Pacific, Middle East & Africa, and Latin America). The market sizes and forecasts regarding value (USD) for all the above segments are provided.
| In-Game Virtual Goods |
| Digital Collectibles (Non-NFT) |
| Non-Fungible Tokens (NFT-Based Collectibles) |
| Virtual Currency (Coins, Gems, Tokens) |
| Virtual Land and Property |
| Virtual Services (Avatar Styling, Event Tickets, etc.) |
| PC / Console Games |
| Mobile Games and Apps |
| Metaverse Platforms and Virtual Worlds |
| Social-Media Networks |
| Crypto-Native Marketplaces |
| Smartphones and Tablets |
| PCs and Consoles |
| VR / AR Head-Mounted Displays |
| Blockchain-Enabled |
| Non-Blockchain (Centralized) |
| Micro-transactions and Loot Boxes |
| Subscription / Season Pass |
| Pay-to-Own (One-Time Purchase) |
| Online Games |
| Metaverse and Virtual Events |
| Social-Media Gifting and Tipping |
| Digital Commerce and Advertising |
| Others (Education, Virtual Tourism) |
| North America | United States |
| Canada | |
| Mexico | |
| South America | Brazil |
| Argentina | |
| Rest of South America | |
| Europe | United Kingdom |
| Germany | |
| France | |
| Nordics | |
| Rest of Europe | |
| APAC | China |
| Japan | |
| South Korea | |
| India | |
| Southeast Asia | |
| Australia and New Zealand | |
| Rest of APAC | |
| Middle East | GCC |
| Turkey | |
| Rest of Middle East | |
| Africa | South Africa |
| Nigeria | |
| Rest of Africa |
| By Type | In-Game Virtual Goods | |
| Digital Collectibles (Non-NFT) | ||
| Non-Fungible Tokens (NFT-Based Collectibles) | ||
| Virtual Currency (Coins, Gems, Tokens) | ||
| Virtual Land and Property | ||
| Virtual Services (Avatar Styling, Event Tickets, etc.) | ||
| By Platform | PC / Console Games | |
| Mobile Games and Apps | ||
| Metaverse Platforms and Virtual Worlds | ||
| Social-Media Networks | ||
| Crypto-Native Marketplaces | ||
| By Device | Smartphones and Tablets | |
| PCs and Consoles | ||
| VR / AR Head-Mounted Displays | ||
| By Technology | Blockchain-Enabled | |
| Non-Blockchain (Centralized) | ||
| By Payment Model | Micro-transactions and Loot Boxes | |
| Subscription / Season Pass | ||
| Pay-to-Own (One-Time Purchase) | ||
| By Application | Online Games | |
| Metaverse and Virtual Events | ||
| Social-Media Gifting and Tipping | ||
| Digital Commerce and Advertising | ||
| Others (Education, Virtual Tourism) | ||
| By Geography | North America | United States |
| Canada | ||
| Mexico | ||
| South America | Brazil | |
| Argentina | ||
| Rest of South America | ||
| Europe | United Kingdom | |
| Germany | ||
| France | ||
| Nordics | ||
| Rest of Europe | ||
| APAC | China | |
| Japan | ||
| South Korea | ||
| India | ||
| Southeast Asia | ||
| Australia and New Zealand | ||
| Rest of APAC | ||
| Middle East | GCC | |
| Turkey | ||
| Rest of Middle East | ||
| Africa | South Africa | |
| Nigeria | ||
| Rest of Africa | ||


Key Questions Answered in the Report
How big is the Virtual Goods Market?
The Virtual Goods Market size is expected to reach USD 132.67 billion in 2026 and grow at a CAGR of 18.12% to reach USD 304.94 billion by 2031.
What is the current Virtual Goods Market size?
In 2026, the Virtual Goods Market size is expected to reach USD 132.67 billion.
Who are the key players in Virtual Goods Market?
Meta Platforms, Inc. (formerly Facebook Inc.), Tencent Holdings Ltd., Coinbase Global, Inc., Binance Holdings Ltd. and Gree Inc. are the major companies operating in the Virtual Goods Market.
Which is the fastest growing region in Virtual Goods Market?
The Middle East & Africa is estimated to grow at the highest CAGR over the forecast period (2026-2031).
Which region has the biggest share in Virtual Goods Market?
In 2025, the Asia accounts for the largest market share in Virtual Goods Market.
What years does this Virtual Goods Market cover, and what was the market size in 2025?
In 2025, the Virtual Goods Market size was estimated at USD 132.67 billion. The report covers the Virtual Goods Market historical market size for years: 2019, 2020, 2021, 2022, 2023 and 2024. The report also forecasts the Virtual Goods Market size for years: 2026, 2027, 2028, 2029, 2030 and 2031.
Page last updated on:


