Virtual Events Market Size and Share
Market Overview
| Study Period | 2020 - 2031 |
|---|---|
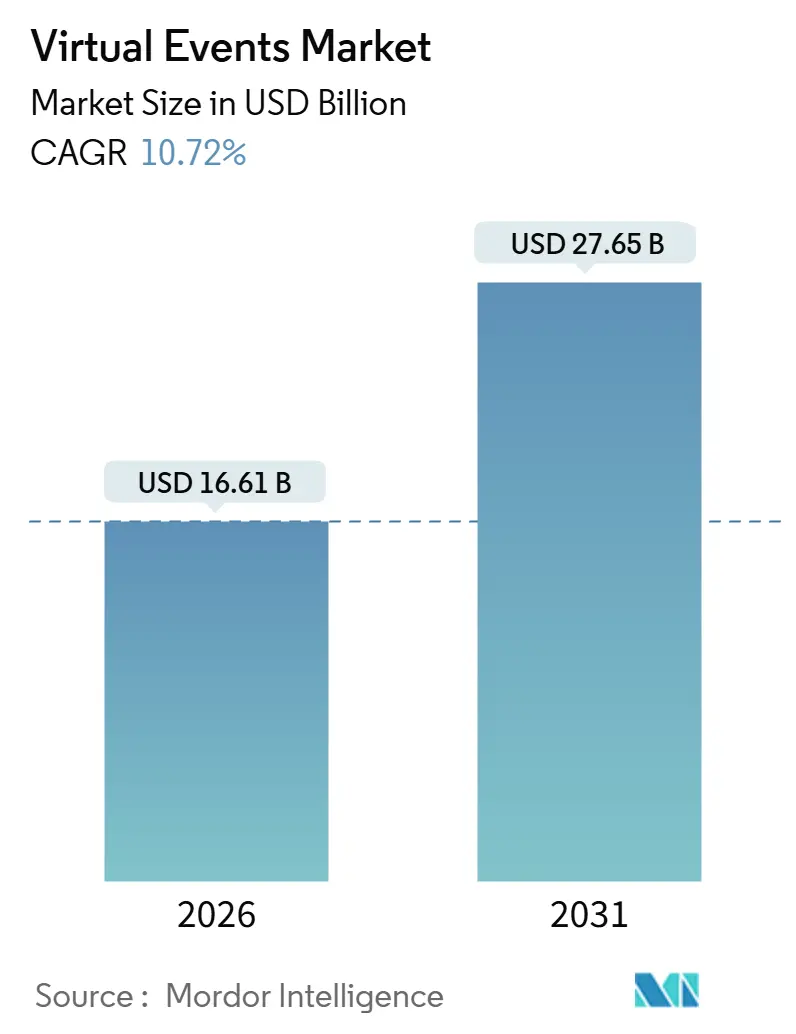
| Market Size (2026) | USD 16.61 Billion |
| Market Size (2031) | USD 27.65 Billion |
| Growth Rate (2026 - 2031) | 10.72% CAGR |
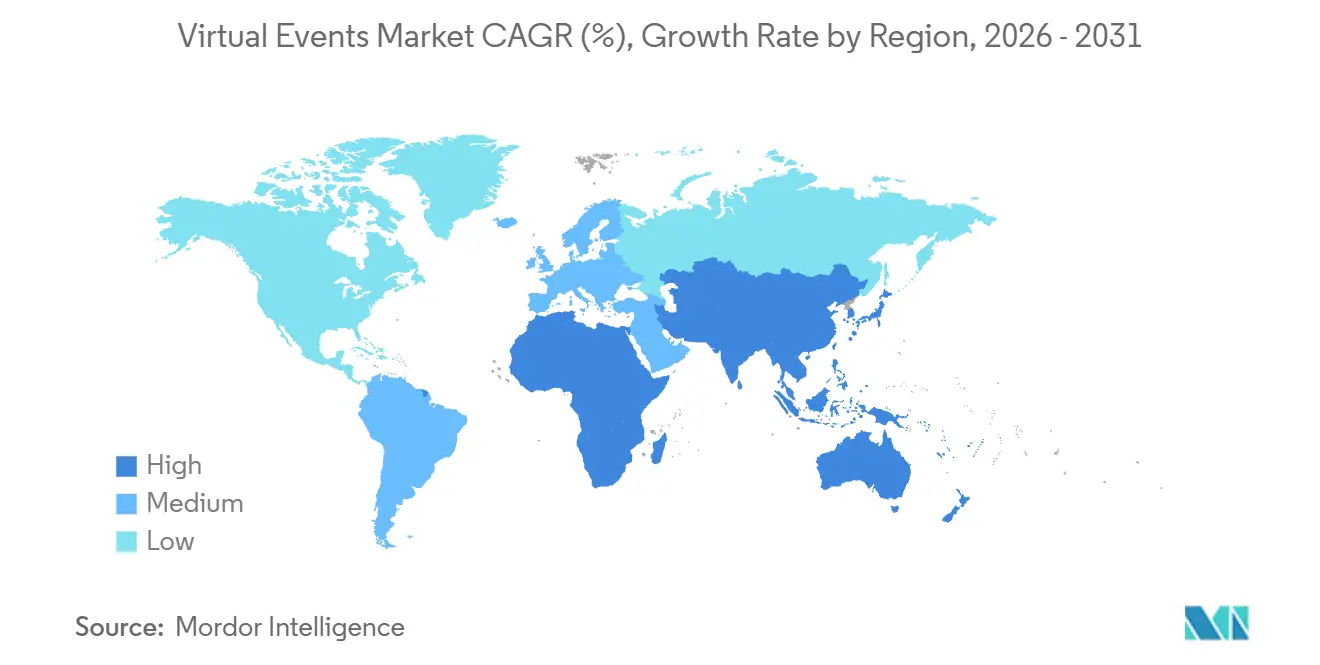
| Fastest Growing Market | Asia Pacific |
| Largest Market | North America |
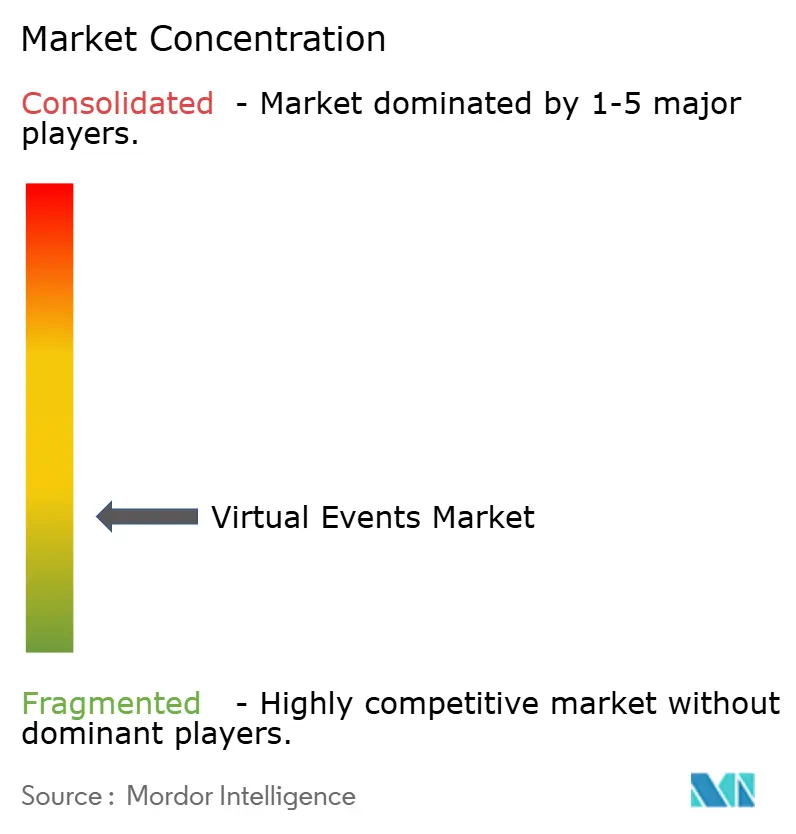
| Market Concentration | Low |
Major Players*Disclaimer: Major Players sorted in no particular order Image © Mordor Intelligence. Reuse requires attribution under CC BY 4.0. | |
Virtual Events Market Analysis by Mordor Intelligence
The virtual events market size stood at USD 16.61 billion in 2026 and is projected to reach USD 27.65 billion by 2031, advancing at a 10.72% CAGR during the forecast period. Corporate procurement teams now benchmark browser-based venues against physical gatherings on total cost of ownership, widening adoption whenever venue rental, travel subsidies, and carbon-offset liabilities inflate in-person budgets. Generative AI is lowering the barriers to real-time interpretation and personalized agendas, while 5G backbones in Asia-Pacific boost high-definition streaming. Platform providers respond by bundling event features inside unified-communications suites, compressing buying cycles and emphasizing API extensibility. Immersive extended-reality (XR) showcases, blockchain-verified credentials, and AI-driven matchmaking round out a product roadmap that seeks to sustain attendee engagement after the novelty of webcams alone has faded.
Key Report Takeaways
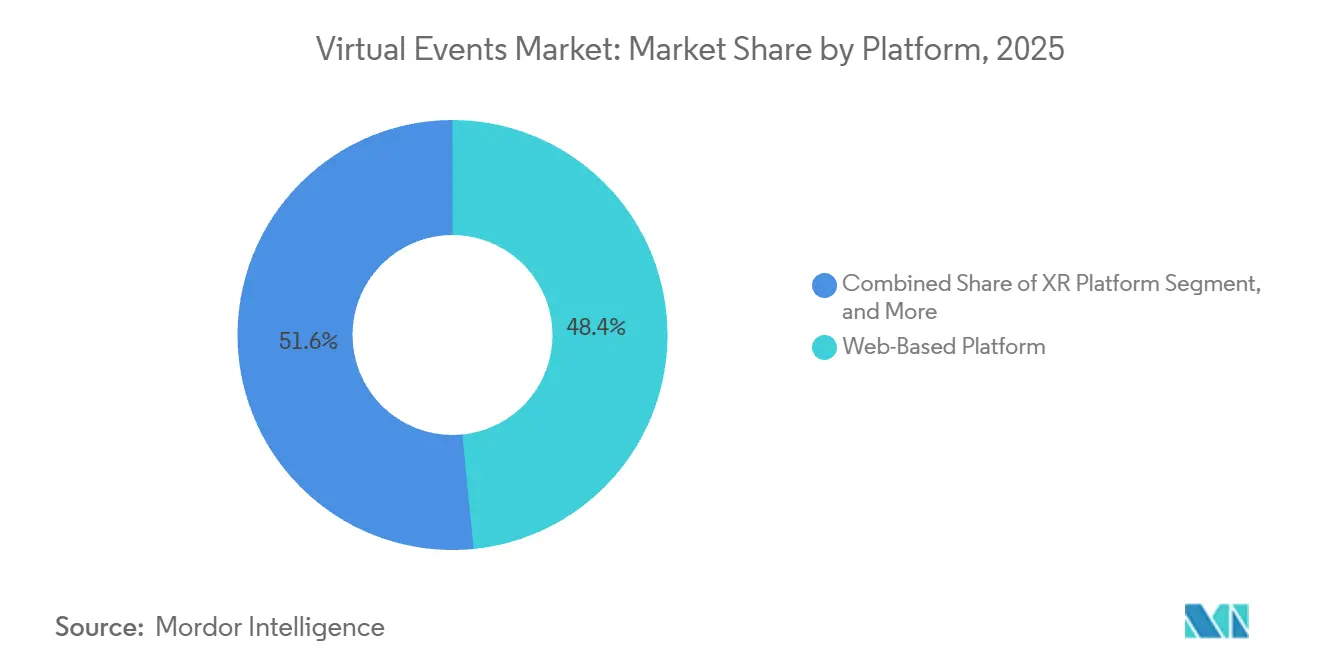
- By platform, web-based solutions secured a 48.43% revenue share of the virtual events market in 2025, whereas XR environments are forecast to expand at an 11.64% CAGR through 2031.
- By service type, communication services led with 38.64% of the virtual events market size in 2025, while marketing and promotion services are poised to grow at an 11.98% CAGR to 2031.
- By application, conferences and summits accounted for 42.64% of virtual events market share in 2025; product launches show the fastest trajectory at a 12.01% CAGR during the outlook period.
- By event type, webinars generated 45.75% of 2025 revenue inside the virtual events market, whereas virtual expos, fairs, and festivals are projected to rise at an 11.43% CAGR.
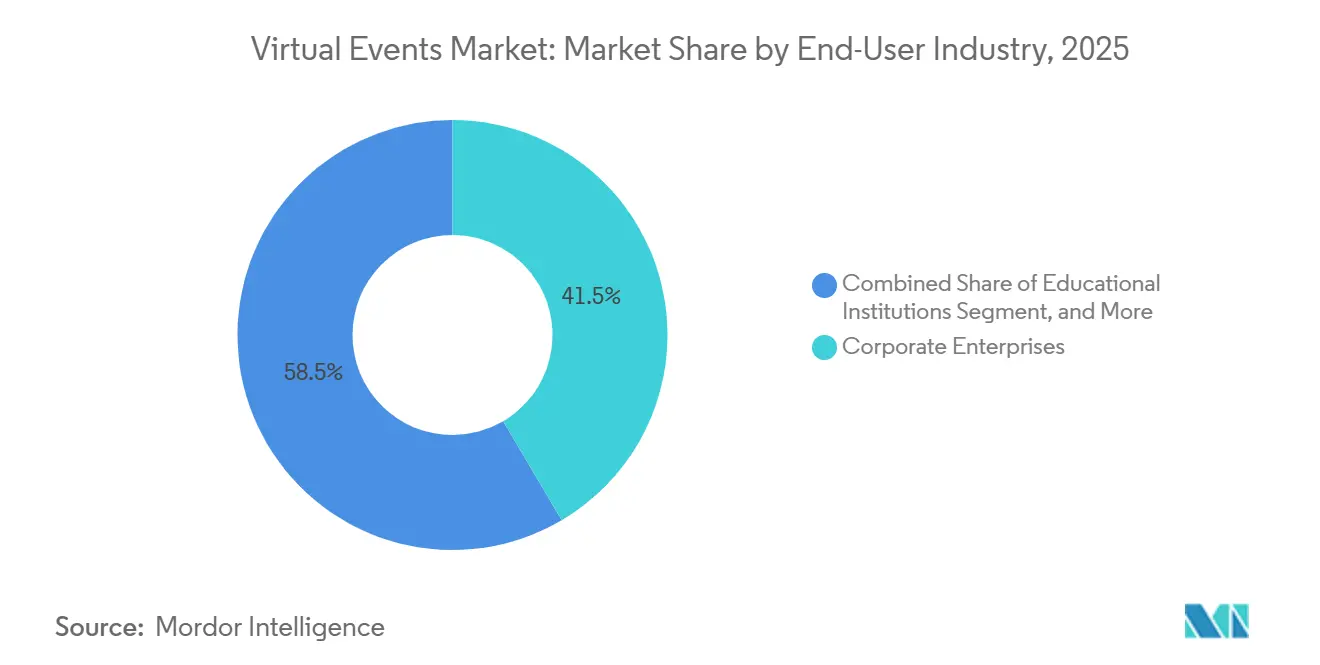
- By end-user industry, corporate enterprises commanded 41.52% demand in 2025, yet educational institutions represent the quickest upswing with an 11.57% CAGR through 2031.
- By revenue source, sponsorship delivered 52.35% of income in 2025; ticket sales are on track to climb at a 12.22% CAGR as tiered-access models mature.
- By geography, North America retained 40.12% share in 2025, whereas Asia-Pacific is accelerating at 12.45% CAGR.
Note: Market size and forecast figures in this report are generated using Mordor Intelligence’s proprietary estimation framework, updated with the latest available data and insights as of January 2026.
Global Virtual Events Market Trends and Insights
Drivers Impact Analysis*
| Driver | (~) % Impact on CAGR Forecast | Geographic Relevance | Impact Timeline |
|---|---|---|---|
| Rapid Adoption of Unified Communications as a Service (UCaaS) and Cloud-Based Collaboration Platforms | +2.8% | Global, with early gains in North America and Europe | Medium term (2-4 years) |
| Expansion of Remote and Hybrid Work Models Globally | +2.1% | Global, spill-over from developed to emerging markets | Long term (≥ 4 years) |
| Cost Savings and Extended Reach Versus Physical Events | +1.9% | Global | Short term (≤ 2 years) |
| Growing Acceptance of Immersive VR and XR Experiences for Audience Engagement | +1.6% | North America and EU, early adoption in Asia-Pacific core | Medium term (2-4 years) |
| Integration of Generative AI for Real-Time Translation and Content Personalization | +1.4% | Global, with regulatory compliance focus in EU | Medium term (2-4 years) |
| Carbon-Neutral Event Mandates Driving Virtual Format Adoption in Fortune 500 ESG Strategies | +1.2% | Global, concentrated in North America and EU | Long term (≥ 4 years) |
| Source: Mordor Intelligence | |||
Rapid Adoption of Unified Communications as a Service and Cloud-Based Collaboration Platforms
Enterprises migrating toward UCaaS bundles increasingly expect event-broadcast functions to sit beside voice, chat, and whiteboard tools, trimming separate webinar licenses and slashing evaluation cycles. Microsoft Teams, Zoom Workplace, and Cisco Webex each report triple-digit growth in monthly active users who launch company town halls without incremental procurement, refocusing competitive differentiation on API depth and third-party integrations. Cloud-native deployment removes server-capacity bottlenecks, letting event managers scale registration portals in hours. The resulting low marginal cost encourages frequent internal briefings and externally facing product showcases, normalizing digital formats for a broadening set of corporate rituals. These dynamics expand the addressable base for the virtual events market.
Expansion of Remote and Hybrid Work Models Globally
Public-sector labor data show telework stabilizing near one-quarter of the employed population in the United States,[1]United States Bureau of Labor Statistics, “American Time Use Survey – 2025 Results,” bls.gov while cross-continent studies highlight similar persistence in Europe and Asia-Pacific. Distributed workforces multiply time-zone conflicts and widen carbon-reporting liabilities, making browser-based gatherings the default solution for quarterly kickoffs and partner briefings. Organizers now design agendas around asynchronous replay, modular tracks, and on-demand libraries, reversing pre-pandemic conventions that assumed uniform attendance windows. As companies integrate flexible work into talent strategies, consistent demand streams into the virtual events market.
Integration of Generative AI for Real-Time Translation and Content Personalization
Breakthroughs in large-language and speech models enable sub-second multilingual captions, eliminating the historic need for human interpreters in every breakout room. Platforms embed voice agents that triage attendee queries, auto-match networking interests, and assemble post-event summaries tailored to job roles. These AI layers elevate perceived value for sponsors and participants, driving higher net-promoter scores and repurchase intentions. Consequently, generative AI shifts virtual events from cost-avoidance utilities toward experience-centric, data-rich engagement channels, fortifying revenue multipliers inside the virtual events market.
Carbon-Neutral Event Mandates Embedded in Fortune 500 ESG Strategies
Regulators in Europe and North America now compel granular Scope 3 disclosures, foregrounding travel-related emissions. Fortune 500 procurement teams incorporate carbon budgets into RFP scoring, nudging event planners toward virtual or hybrid formats that sidestep flights and hotel nights. Case studies from technology leaders show thousands of metric tons of CO₂-equivalent avoided after switching annual conferences online, resonating with investors who link executive compensation to net-zero pathways. These mandates strengthen the long-run growth arc for the virtual events market.[2]European Commission, “Corporate Sustainability Reporting Directive,” ec.europa.eu
Restraints Impact Analysis*
| Restraint | (~) % Impact on CAGR Forecast | Geographic Relevance | Impact Timeline |
|---|---|---|---|
| Data Security and Privacy Concerns in Large-Scale Online Events | -1.4% | Global, heightened in Europe (GDPR) and North America | Short term (≤ 2 years) |
| Limited Audience Engagement and Networking Fatigue | -1.2% | Global | Medium term (2-4 years) |
| Rising Platform Saturation Leading to Vendor Lock-In Risk for Enterprises | -0.8% | North America and Europe | Medium term (2-4 years) |
| Inconsistent Cross-Border Virtual Event Taxation and Compliance Requirements | -0.6% | Global, acute in multi-jurisdictional events | Long term (≥ 4 years) |
| Source: Mordor Intelligence | |||
Data Security and Privacy Concerns in Large-Scale Online Events
Regulators are sharpening scrutiny of attendee data, compelling encryption at rest, role-based access controls, and granular audit logs.[3]National Institute of Standards and Technology, “Privacy Framework Update 2024,” nist.gov Healthcare, financial services, and government agencies demand ISO 27001 or SOC 2 attestations before green-lighting platform contracts, stretching sales cycles. XR environments amplify sensitivity because eye-tracking, spatial movement, and biometric cues can reveal personal attributes, triggering new compliance checkpoints. Smaller associations lacking dedicated privacy officers often postpone virtual expansions, trimming near-term volumes in the virtual events market.
Limited Audience Engagement and Networking Fatigue
Academic findings link extended webcam sessions to cognitive overload and diminished social bonding. Attendees report lower satisfaction with virtual networking than with serendipitous hallway chats, prompting organizers to compress agendas and add gamified leaderboards. While AI-driven matchmaking offers partial relief, production costs climb, and sponsors sometimes question return on investment. These engagement headwinds cap renewal rates for multi-day digital conferences, constraining the upside of the virtual events market in the medium term.
*Our forecasts treat driver/restraint impacts as directional, not additive. The impact forecasts reflect baseline growth, mix effects, and variable interactions.
Segment Analysis
By Platform: Browser Convenience Outpaces Yet Catalyzes XR Adoption
Web-based solutions claimed 48.43% of the virtual events market share in 2025, underscoring how HTML5 and WebRTC deliver frictionless log-on experiences inside corporate firewalls. Enterprises value zero-install access, automatic scaling, and straightforward compliance audits. The dominance of browsers keeps entry costs low, inviting frequent internal updates and external webinars that expand the overall virtual events market size. Yet immersive XR venues are set to grow at an 11.64% CAGR to 2031, powered by multi-vendor headset standards that shrink integration hurdles. Automotive design walk-throughs, surgical simulations, and luxury real-estate tours already showcase the experiential lift of spatial presence. Although headset prices and user comfort remain hurdles, early adopters in manufacturing, healthcare, and education validate the pathway for broader adoption.
The interplay between browser and XR platforms is symbiotic. Browser-based lobbies increasingly route high-value sessions to optional headset environments, melding accessibility with immersion. Cloud orchestration lets organizers spin up parallel 2D and 3D streams, preserving audience reach while experimenting with advanced interactivity. As venture investment pours into photorealistic avatars, gesture recognition, and spatial audio, the virtual events market gains optionality, positioning XR as an additive layer rather than a binary substitute.


By Service Type: Marketing Spend Migrates to Data-Rich Activations
Communication services accounted for 38.64% of revenue in 2025, serving as the backbone of every webinar, town hall, and training module. Bundling UCaaS contracts compresses incremental spend, while data gathered through chats, polls, and Q&A feeds broader analytics stacks, reinforcing platform stickiness. Marketing and promotion services are forecast to compound at 11.98% annually, mirroring a shift from traditional trade shows to sponsored virtual booths that quantify every click and dwell. First-party data captured through gated registration forms becomes even more valuable as browser cookies are phased out, enabling brands to build owned audiences and refine lead-scoring models. Enhanced dashboards visualize asset downloads, booth traffic, and meeting requests in real time, elevating sponsorship packages and boosting the overall size of the virtual events market.
Cross-functional teams now co-design campaigns that weave pre-event email journeys with in-platform quizzes and post-event nurture tracks, linking marketing automation, CRM, and analytics APIs. White-label customization lets sponsors overlay visual identities on lobbies, slide decks, and session replay hubs, amplifying brand recall. The virtuous loop of data-driven insights and measurable ROI keeps advertiser budgets flowing toward digital floor plans, accelerating growth inside the virtual events market.
By Application: Global Launches Trump Logistical Barriers
Conferences and summits delivered 42.64% of aggregate spending in 2025, benefiting from their familiar agenda structure, multi-track depth, and strong sponsor appetite. On-demand replays extend shelf life beyond live days, allowing continual lead harvesting. Product launches are projected to climb at a 12.01% CAGR across 2026-2031 as automakers, smartphone brands, and software vendors premiere offerings for global audiences without coordinating simultaneous press events in multiple cities. High-definition streams, interactive 3D renderings, and immediate preorder links compress marketing funnels and feed social-media amplification, boosting conversion rates. This simultaneity differentiates digital showrooms and locks in greater share of the virtual events market.
Elsewhere, exhibitions replicate expo halls with clickable booths and one-on-one video chats, although exhibitor satisfaction hinges on lead-capture fidelity. Shareholder meetings gain traction after regulators clarified quorum and e-voting procedures, while community forums and awards galas round out the portfolio, each with unique monetization levers. The breadth of use cases safeguards resilience, even as individual formats cycle through hype and fatigue.

By Event Type: Webinars Anchor Lead Flow, Expos Keep Revenue Rolling
Webinars commanded 45.75% of revenue in 2025, prized for low setup cost, tight storytelling, and repurposable assets that feed blogs, podcasts, and gated ebooks. Marketing teams schedule series around product life cycles, using polling to qualify leads that flow into CRM pipelines. Virtual expos, fairs, and festivals are on pace to expand at an 11.43% CAGR, propelled by municipal and association organizers who monetize year-round pavilions rather than single-weekend spectacles. Persistent halls enable content refreshes, sponsor swaps, and month-long appointment calendars that generate incremental tickets and ad inventory. These recurring touchpoints deepen wallet share for the virtual events market.
Hybrid models now stream keynote concerts or film premieres while maintaining in-person satellite gatherings, capturing both global reach and localized community experience. Gamified quests award points for booth visits and quiz completions, driving footfall inside digital aisles. As broadband penetration widens, mobile-first interfaces and adaptive bitrates minimize dropout risk, ensuring broader demographic participation.
By End-User Industry: Campuses and Corporates Advance in Tandem
Corporate enterprises produced 41.52% of the 2025 demand, leveraging quarterly earnings calls, partner academies, and internal town halls to synchronize dispersed teams. Centralized procurement favors platforms that integrate with identity management, learning systems, and analytics dashboards, trimming redundancy. Educational institutions are projected to grow at an 11.57% CAGR, aligning with hybrid lecture halls, virtual open houses, and alumni fundraising galas. University IT leaders rank AI integration and workforce development as strategic imperatives, elevating event infrastructure from tactical stopgap to core digital campus asset. These shifts enlarge addressable revenue for the virtual events market.
Government agencies adopt platforms for public consultations and policy workshops, especially in regions where travel budgets and security restrictions limit physical convening. Healthcare congresses demand HIPAA-compliant streaming, while non-profits deploy low-cost tools for donor engagement. The diversity of sectoral requirements drives modular architectures, enabling vendors to package compliance, certification tracking, or continuing education credits as add-on modules, deepening lifetime value.
By Revenue Source: Tiered Access Monetizes Attention
Sponsorship contributed 52.35% of 2025 income, driven by lead-gen-hungry brands that value real-time dashboards and deterministic attribution. Logo placements, branded networking lounges, and co-hosted sessions command premium rates whenever attendee quality trumps raw volume. Ticket sales, however, are forecast to rise at a 12.22% CAGR through 2031 as organizers adopt tiered models that reserve VIP meet-and-greets, downloadable toolkits, or lifetime replay libraries for paying tiers. Freemium gates broaden funnel reach, while premium upsells lock in revenue, enhancing the scalability of the virtual events market size.
Emerging monetization levers include microtransactions for avatar skins in XR spaces, blockchain-verified certificates for continuing education, and resale markets for transferable passes. Exhibitor fees, advertising slots, and content licensing complete a diversified revenue stack, insulating organizers from volatility in a single channel. Converging income streams fortify margin profiles and fund experimentation with new engagement formats.
Geography Analysis
North America wielded 40.12% of virtual events market share in 2025, backed by robust broadband, high software budgets, and a dense vendor ecosystem. U.S. enterprises rapidly bundle event modules into collaboration suites, while Canada’s financial sector leans on compliant cloud hosting. Mexico’s call-center expansion fuels incremental training demand. A second growth pole emerges in Asia-Pacific, projected to compound at 12.45% annually as 1.9 billion 5G connections unlock low-latency streaming. Governments from India to South Korea bankroll digital-service roadmaps, reinforcing cloud uptake. Diverse language landscapes and rising SME digitalization drive demand for AI subtitles and mobile-first apps, widening the virtual events market.
Europe’s regulatory environment, defined by GDPR, prioritizes encryption and sovereign-cloud options, steering procurement toward platforms with robust data-protection pedigrees. Multilingual conference norms elevate AI translation modules. Germany and France host frequent automotive and pharmaceutical summits, while the United Kingdom’s fintech clusters generate steady webinar cadences. South America trails but shows momentum as Brazil accelerates broadband rollout and Argentina’s export tech hubs court foreign investors online. Development-bank schemes channel grants into virtual civic forums, anchoring public-sector uptake.
The Middle East and Africa remain heterogeneous. Saudi Arabia and the United Arab Emirates fund hyperscale data centers under national digital blueprints, spurring enterprise adoption. African markets face bandwidth bottlenecks, yet mobile internet leads many users to engage via low-bitrate streams, prompting vendors to optimize codecs and offline-synced apps. South Africa and Nigeria pilot hybrid trade shows for mining and fintech, respectively, signaling an upward curve for the regional virtual events market.

Competitive Landscape
The virtual events market is fragmented, populated by UCaaS giants, purpose-built event platforms, and hyperscale cloud providers. Zoom, Microsoft, and Cisco leverage embedded user bases and bundled pricing to entrench share, limiting churn through identity management and IT policy alignment. Pure-play providers such as Cvent, ON24, and Hopin differentiate on sponsor analytics, white-label design, and audience matchmaking granularity. Meanwhile, hyperscalers like Amazon Web Services and Microsoft Azure provide composable building blocks that corporate developers stitch into bespoke portals, winning contracts in regulated sectors that require sovereign control. Vendor strategies coalesce around generative AI feature rollouts, vertical-specific compliance, and international expansion.
Funding flows illustrate competitive heat. Hopin’s USD 150 million Series D backs Asia-Pacific rollouts, Cvent’s Splash acquisition embeds rich microsite templates, and vFairs collaborates with Meta Quest headsets for XR expo halls. Smaller disruptors, Airmeet, Accelevents, BigMarker, court community-driven creators with revenue-share models and rapid feature cadence, often undercutting incumbents on price. Patent filings in sentiment analysis and blockchain credentialing hint at future moat areas, but commercialization timelines remain fluid.
Buyers react by demanding open APIs and single sign-on compatibility to avoid lock-in, widening the addressable market for integration middleware. White-space persists in healthcare, finance, and public sector, where stringent audits deter less-mature vendors. As platforms converge on core streaming and chat, differentiation shifts to data insights, sponsorship ROI, and immersive presence, forcing continuous innovation to sustain share in the virtual events market.
Virtual Events Industry Leaders
Avaya LLC
6Connex Inc.
Alive Events Agency Pty Ltd
vFairs LLC
Zoom Video Communications Inc.
- *Disclaimer: Major Players sorted in no particular order

Recent Industry Developments
- January 2026: Zoom Video Communications expanded its AI Companion to auto-generate meeting summaries and action items inside its Events suite.
- December 2025: Microsoft embedded generative AI translation for live events in Teams Premium, covering 40+ languages.
- November 2025: Cvent acquired Splash for USD 200 million, adding branded microsite and email automation tools.
- October 2025: Cisco launched Webex Hologram, projecting life-size 3D avatars without headsets.


Global Virtual Events Market Report Scope
Virtual events are gatherings, conferences, meetings, or exhibitions held entirely online or in a digital environment. The market for the study encompasses revenue from the sale of various virtual events, including webinars, live-streamed conferences, virtual trade shows, online workshops, networking sessions, and virtual exhibitions.
The Virtual Events Market Report is Segmented by Platform (Web-Based Platform, XR Platform, Cloud Deployment, and On-Premise Deployment), Service Type (Communication Services, Recruitment and Networking, Marketing and Promotion, and Training and Education), Application (Conferences and Summits, Exhibitions/Trade Shows, Product Launches, and Other Applications), Event Type (Webinar, Virtual Expo/Fairs/Festivals, Entertainment and Festivals, Corporate Meetings, and Other Event Types), End-User Industry (Educational Institutions, Corporate Enterprises, Government and Public Sector, and Other End-User Industries), Revenue Source (Sponsorship, Ticket Sale, and Other Revenue Sources), and Geography (North America, South America, Europe, Asia-Pacific, Middle East and Africa). The Market Forecasts are Provided in Terms of Value (USD).
| Web-Based Platform |
| XR Platform |
| Cloud Deployment |
| On-Premise Deployment |
| Communication Services |
| Recruitment and Networking |
| Marketing and Promotion |
| Training and Education |
| Conferences and Summits |
| Exhibitions / Trade Shows |
| Product Launches |
| Other Applications |
| Webinar |
| Virtual Expo / Fairs / Festivals |
| Entertainment and Festivals |
| Corporate Meetings |
| Other Event Types |
| Educational Institutions |
| Corporate Enterprises |
| Government and Public Sector |
| Other End-User Industries |
| Sponsorship |
| Ticket Sale |
| Other Revenue Sources |
| North America | United States | |
| Canada | ||
| Mexico | ||
| South America | Brazil | |
| Argentina | ||
| Rest of South America | ||
| Europe | Germany | |
| France | ||
| United Kingdom | ||
| Italy | ||
| Spain | ||
| Rest of Europe | ||
| Asia-Pacific | China | |
| Japan | ||
| India | ||
| South Korea | ||
| Australia | ||
| Rest of Asia-Pacific | ||
| Middle East and Africa | Middle East | Saudi Arabia |
| United Arab Emirates | ||
| Turkey | ||
| Rest of Middle East | ||
| Africa | South Africa | |
| Egypt | ||
| Nigeria | ||
| Rest of Africa | ||
| By Platform | Web-Based Platform | ||
| XR Platform | |||
| Cloud Deployment | |||
| On-Premise Deployment | |||
| By Service Type | Communication Services | ||
| Recruitment and Networking | |||
| Marketing and Promotion | |||
| Training and Education | |||
| By Application | Conferences and Summits | ||
| Exhibitions / Trade Shows | |||
| Product Launches | |||
| Other Applications | |||
| By Event Type | Webinar | ||
| Virtual Expo / Fairs / Festivals | |||
| Entertainment and Festivals | |||
| Corporate Meetings | |||
| Other Event Types | |||
| By End-User Industry | Educational Institutions | ||
| Corporate Enterprises | |||
| Government and Public Sector | |||
| Other End-User Industries | |||
| By Revenue Source | Sponsorship | ||
| Ticket Sale | |||
| Other Revenue Sources | |||
| By Geography | North America | United States | |
| Canada | |||
| Mexico | |||
| South America | Brazil | ||
| Argentina | |||
| Rest of South America | |||
| Europe | Germany | ||
| France | |||
| United Kingdom | |||
| Italy | |||
| Spain | |||
| Rest of Europe | |||
| Asia-Pacific | China | ||
| Japan | |||
| India | |||
| South Korea | |||
| Australia | |||
| Rest of Asia-Pacific | |||
| Middle East and Africa | Middle East | Saudi Arabia | |
| United Arab Emirates | |||
| Turkey | |||
| Rest of Middle East | |||
| Africa | South Africa | ||
| Egypt | |||
| Nigeria | |||
| Rest of Africa | |||


Key Questions Answered in the Report
What is the current size of the virtual events market?
The virtual events market size reached USD 16.61 billion in 2026 and is on track to surpass USD 27.65 billion by 2031.
Which segment holds the largest virtual events market share?
Web-based platforms led in 2025 with a 48.43% virtual events market share, reflecting widespread browser accessibility.
Which region is growing fastest in virtual events adoption?
Asia-Pacific is forecast to expand at a 12.45% CAGR through 2031, driven by 5G rollouts and government digitalization mandates.
How are companies monetizing virtual events beyond sponsorship?
Organizers now layer tiered ticket sales, premium networking lounges, and on-demand libraries, supporting a 12.22% CAGR in ticket revenue.
What technologies boost engagement in virtual events?
Generative AI for real-time translation, XR environments for immersive demos, and AI matchmaking engines are key engagement drivers.
What is the main restraint facing virtual events platforms?
Heightened data-security and privacy requirements increase compliance costs and slow adoption in regulated industries.
Page last updated on:


