Esports Market Size and Share
Market Overview
| Study Period | 2020 - 2031 |
|---|---|
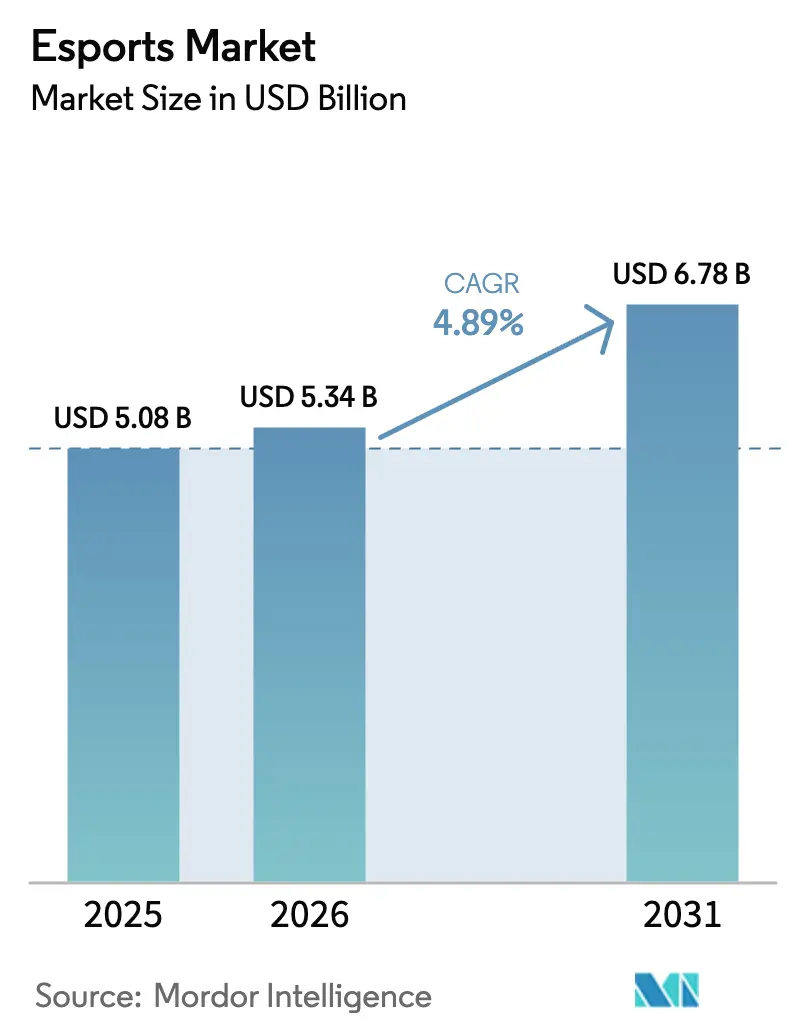
| Market Size (2026) | USD 5.34 Billion |
| Market Size (2031) | USD 6.78 Billion |
| Growth Rate (2026 - 2031) | 4.89% CAGR |
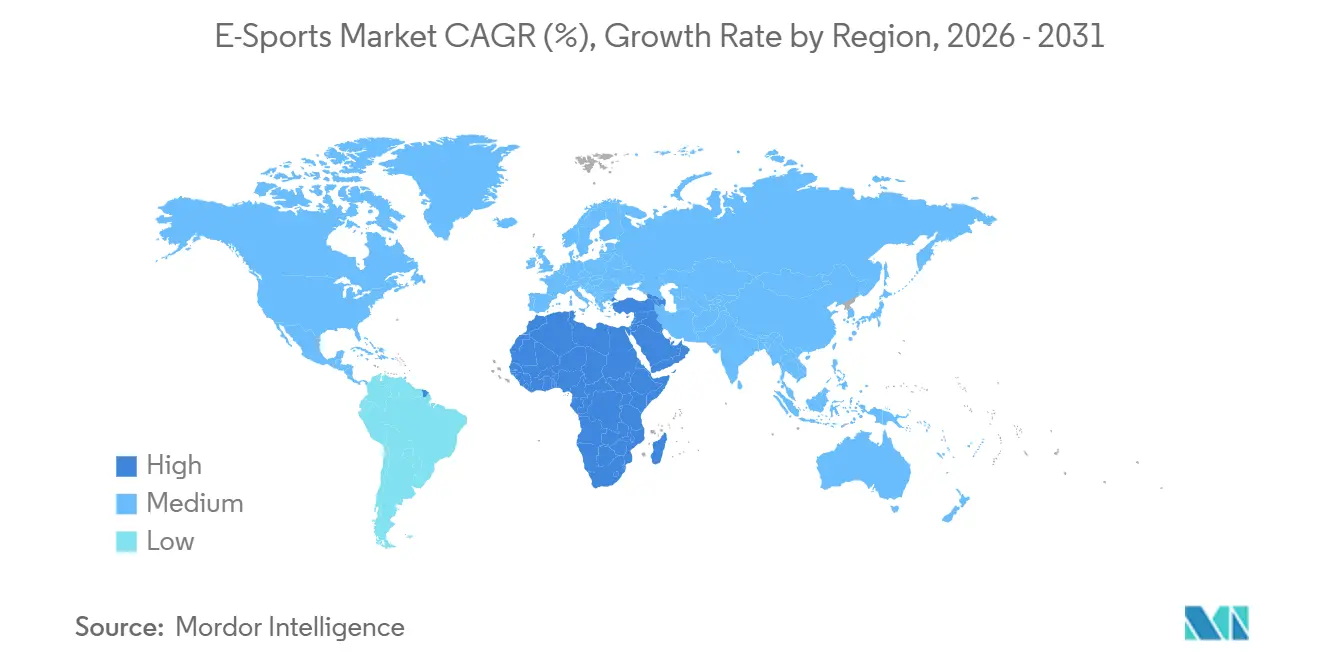
| Fastest Growing Market | Middle East |
| Largest Market | North America |
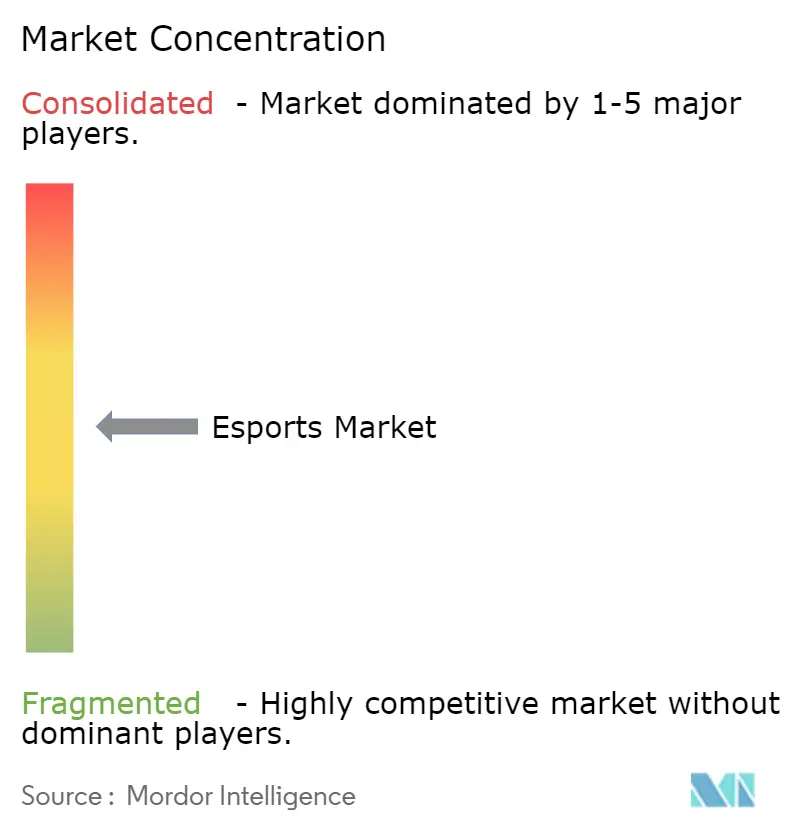
| Market Concentration | Medium |
Major Players *Disclaimer: Major Players sorted in no particular order Image © Mordor Intelligence. Reuse requires attribution under CC BY 4.0. | |
Esports Market Analysis by Mordor Intelligence
The Esports Market size is expected to grow from USD 5.08 billion in 2025 to USD 5.34 billion in 2026 and is forecast to reach USD 6.78 billion by 2031 at 4.89% CAGR over 2026-2031.
The present growth path is shaped by franchise-model adoption, sovereign wealth-fund investments, and the migration of traditional broadcasters to live-streaming platforms, factors that temper earlier venture-backed exuberance. Player-salary escalation and inconsistent sponsorship budgets are pressing publishers to diversify revenue streams into betting, fantasy wagering, and in-game assets, while mobile-first titles and latency-optimized networks widen global reach. Continued regulatory attention on loot-box mechanics, data privacy, and virtual-asset classification raises compliance costs but accelerates a pivot toward transparent season-pass monetization. Competitive parity remains hindered by fragmented intellectual-property ownership, forcing tournament organizers to negotiate title-by-title rights rather than cross-game packages, thereby curbing economies of scale.
Key Report Takeaways
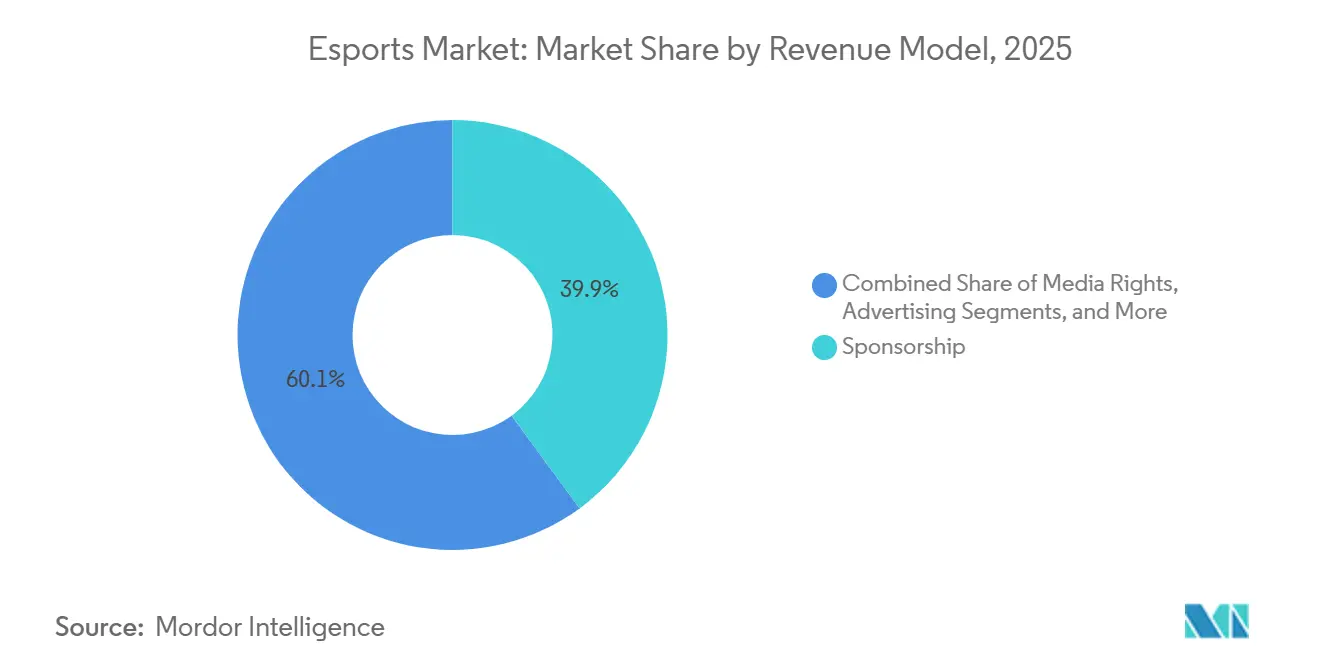
- By revenue model, sponsorship contributed 39.93% of 2025 value, while betting and fantasy platforms are advancing at a 5.53% CAGR through 2031.
- By streaming platform, Twitch achieved a 47.07% share in 2025, whereas Facebook Gaming is poised to expand at a 5.21% CAGR through 2031.
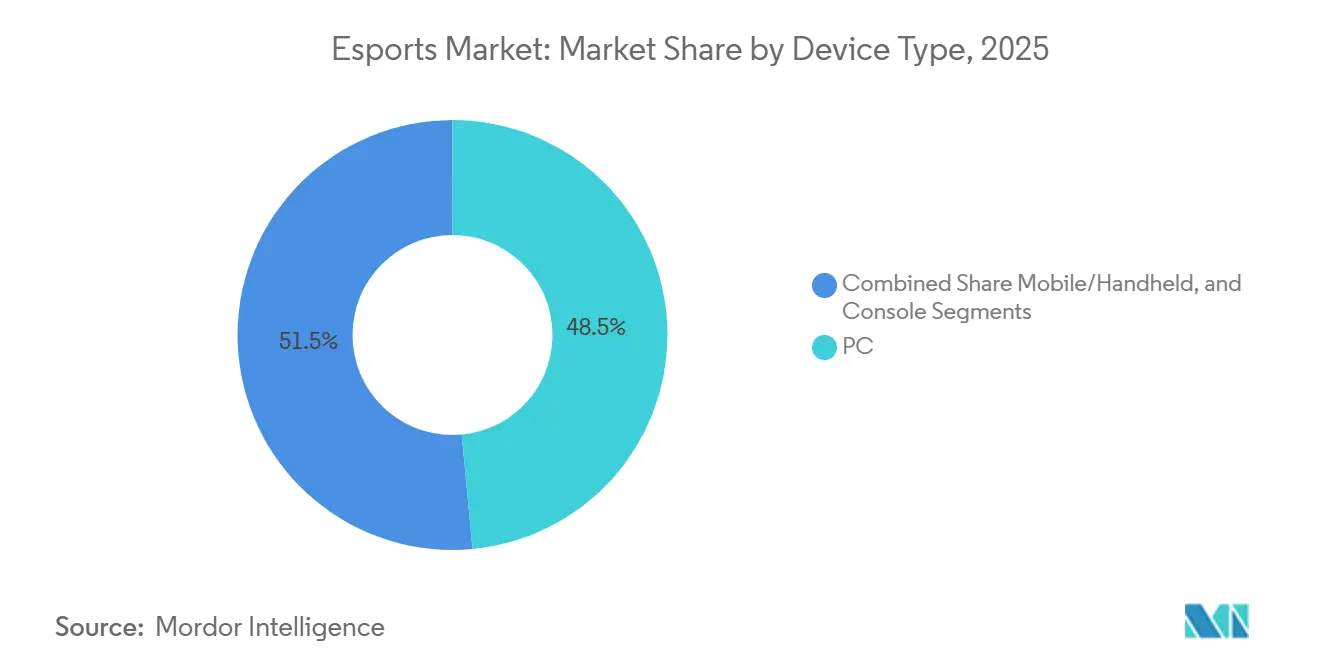
- By device type, smartphones captured 48.51% of 2025 revenue; the mobile and handheld segment is set to grow at a 5.87% CAGR to 2031.
- By game genre, MOBA titles held a 37.39% share in 2025, yet battle-royale games are projected to rise at a 5.28% CAGR through 2031.
- By geography, North America generated 42.49% of 2025 market value, but the Middle East is forecast to post a 5.94% CAGR through 2031.
Note: Market size and forecast figures in this report are generated using Mordor Intelligence’s proprietary estimation framework, updated with the latest available data and insights as of January 2026.
Global Esports Market Trends and Insights
Drivers Impact Analysis*
| Driver | (~) % Impact on CAGR Forecast | Geographic Relevance | Impact Timeline |
|---|---|---|---|
| 5G and fiber roll-outs enabling mobile esports monetization in Asia | +1.2% | Asia-Pacific core, spillover to Middle East and South America | Medium term (2-4 years) |
| Blockchain-based digital asset ownership boosting publisher revenues | +0.7% | Global, early adoption in North America and Europe | Long term (≥4 years) |
| Franchise league models attracting traditional sports investors | +0.9% | North America and Europe primary, expanding to Asia-Pacific | Short term (≤2 years) |
| Government recognition and funding of esports in Europe and China | +0.8% | Europe and China core, emerging in Middle East | Medium term (2-4 years) |
| AI-powered personalized training tools enhancing player engagement | +0.6% | Global, concentrated in North America and Asia-Pacific | Long term (≥4 years) |
| Saudi-led mega prize pools globalizing tournament calendars | +0.9% | Middle East origin, global tournament distribution impact | Short term (≤2 years) |
| Source: Mordor Intelligence | |||


5G & Fiber Roll-outs Enabling Mobile Esports Monetization in Asia
Nationwide 5G penetration reached 68% of South Korean mobile subscriptions by December 2025, while China Mobile covered 95% of prefecture-level cities with standalone 5G, lowering average latency below 20 milliseconds and leveling competitive conditions between smartphone and PC contestants.[1]Ministry of Science and ICT, South Korea, “5G Network Statistics,” msit.go.kr Tencent leveraged these upgrades by funding a USD 10 million Honor of Kings World Championship in 2025 that attracted 120 million concurrent viewers and generated USD 2.45 billion in annual revenue.[2]Tencent Holdings, “Annual Report 2025,” tencent.com Garena’s Free Fire retained 150 million daily active users on devices priced below USD 200, demonstrating the addressable audience unlocked by affordable hardware. Government-backed fiber-to-home programs in Indonesia and the Philippines are widening participation further, with the Philippine Department of Information and Communications Technology targeting 50% household coverage by 2027. These connectivity gains amplify mobile streaming hours, fuel in-app purchase conversion, and expand regional prize pools, collectively lifting the esports market growth outlook.
Blockchain-Based Digital Asset Ownership Boosting Publisher Revenues
Non-fungible tokens allow viewers and players to trade verified tournament skins, and publishers capture 5%-10% royalties on each resale, transforming one-time item sales into recurring revenue. Immutable’s partnership with GameStop and Ubisoft drove USD 18 million in secondary-market volume within six months of launch. Riot Games secured a U.S. patent in August 2025 covering blockchain-verified item ownership, laying groundwork for cross-game economies.[3]United States Patent and Trademark Office, “Blockchain Item Authentication Patent,” uspto.gov Although the European Securities and Markets Authority now treats certain tokens as financial instruments, compliance registration costs appear manageable relative to lifetime royalty upside.
Franchise League Models Attracting Traditional Sports Investors
Permanent slots in leagues such as the League of Legends Championship Series eliminate relegation risk, letting investors apply valuation frameworks comparable to NBA franchises. Goldman Sachs tracked USD 1.8 billion of traditional-sports capital entering esports teams between 2022 and 2024. Credit facilities backed by franchise equity, including USD 500 million arranged by Norton Rose Fulbright, reduce cost of capital and support media-production upgrades. Sponsor retention is also rising; Official research reported 23% higher year-over-year renewal rates in franchised leagues versus open-circuit tournaments. Still, publisher control over revenue-share terms can compress team earnings, highlighting the importance of diversified income sources.
Government Recognition and Funding of Esports in Europe and China
State-backed esports infrastructure investments in China, Germany, and France legitimized competitive gaming as a career pathway, with China's General Administration of Sport officially recognizing esports as the 99th sanctioned sport in 2024 [4]General Administration of Sport of China, “Esports Recognition,” sport.gov.cn and allocating CNY 5 billion (USD 700 million) for provincial training academies through 2027. Shanghai Municipal Government designated the city as China's "Esports Capital" in 2025, offering tax incentives and subsidized venue construction that attracted Riot Games to relocate its Asia-Pacific headquarters and host the 2025 League of Legends World Championship with 40,000 in-person attendees. Germany's Federal Ministry for Digital and Transport launched a EUR 50 million (USD 54 million) esports-infrastructure fund in January 2025, financing fiber upgrades to 200 municipal arenas and underwriting insurance for amateur tournament organizers. The European Parliament passed a non-binding resolution in March 2025 urging member states to harmonize esports visa classifications, addressing fragmentation that previously forced non-EU players to secure country-specific work permits for each tournament. Hong Kong's Innovation and Technology Bureau committed HKD 100 million (USD 13 million) to Cyberport's esports accelerator program in 2024, supporting 30 startups developing AI coaching tools and blockchain tournament platforms.
Restraints Impact Analysis*
| Restraint | (~) % Impact on CAGR Forecast | Geographic Relevance | Impact Timeline |
|---|---|---|---|
| Sponsorship spend compression | -1.1% | Europe | Short term (≤2 years) |
| Fragmented IP ownership | -1.3% | Global | Long term (≥4 years) |
| Escalating Player Salary Inflation Outpacing Revenue Growth | -1.1% | North America and Europe core, emerging in Asia-Pacific | Medium term (2-4 years) |
| Regulatory Crackdowns on Loot Boxes Limiting In-Game Monetisation | -1.0% | North America and Europe | Long term (≥4 years) |
| Source: Mordor Intelligence | |||
Sponsorship Spend Compression amid Digital-Ad Slow-down in Europe
European digital-advertising budgets fell 8% year-over-year in 2024, driving endemic sponsors such as Intel and Mastercard to trim esports campaigns by roughly 15%. Intel ended its decade-long Extreme Masters title sponsorship in December 2024, eliminating an annual USD 20 million guarantee and forcing ESL FACEIT Group to convert inventory into at-risk revenue-share deals. The collapse of cryptocurrency exchange FTX left a USD 200 million sponsorship gap that was only 40% filled by 2025. Stricter GDPR enforcement cut precision targeting, evidenced by Meta’s EUR 390 million fine in 2024, weakening CPM premiums for esports streams. Brands are reallocating to performance marketing, leaving properties to prove return on engagement with limited standardization.
Escalating Player Salary Inflation Outpacing Revenue Growth
Minimum salaries in the League of Legends Championship Series rose to USD 75,000 in 2025, yet league revenue-share pools shrank to USD 21 million, tightening margins for teams already carrying multi-year guarantees negotiated during the 2022-2024 venture boom. Overwatch League franchises contracted from 20 to 8 as operating losses averaged USD 1.2 million per club annually. Riot Games responded in September 2025 by lowering minimum salaries to USD 60,000 and shifting 40% of compensation to performance-based bonuses, sparking negotiations with the players’ association. Until revenue growth realigns with payroll, team stability will remain fragile, constraining the esports market expansion potential.
*Our forecasts treat driver/restraint impacts as directional, not additive. The impact forecasts reflect baseline growth, mix effects, and variable interactions.
Segment Analysis
By Revenue Model: Betting Platforms Outpace Legacy Streams
Sponsorship commanded 39.93% of esports revenue in 2025, yet betting and fantasy platforms are expanding at 5.53% CAGR through 2031, reflecting jurisdictional legalization and the integration of real-money wagering into streaming interfaces. DraftKings launched esports-specific betting markets in 12 US states during 2025, offering moneyline, map-handicap, and in-play wagers on League of Legends Championship Series and Counter-Strike Major tournaments, generating USD 85 million in handle within the first six months. Media rights, which accounted for 18% of 2025 revenue, face compression as YouTube Gaming and Twitch shift from guaranteed minimum payments to revenue-share arrangements; Riot Games renegotiated its LCS broadcast deal in 2024, reducing the fixed annual fee from USD 30 million to USD 18 million plus 25% of advertising inventory. Advertising revenue, representing 15% of 2025 market value, suffers from declining cost-per-mille rates as programmatic exchanges classify esports streams as "brand-unsafe" due to unmoderated chat environments, with average CPMs falling from USD 8 in 2022 to USD 4.50 in 2025.
Publisher fees and in-game purchases contributed 22% of 2025 revenue, with Valve's Dota 2 Battle Pass generating USD 180 million in 2025 by allocating 25% of proceeds to The International prize pool, creating a virtuous cycle where fan contributions directly fund competitive prestige. Tickets and merchandise, the smallest segment at 5% of 2025 revenue, are rebounding post-pandemic as in-person attendance at the 2025 League of Legends World Championship in Shanghai reached 40,000 per day, with premium seating packages priced at USD 500 selling out within 90 minutes. The betting and fantasy surge is concentrated in jurisdictions with mature regulatory frameworks; Ontario's iGaming market, which legalized single-event sports wagering in April 2022, recorded CAD 52 million (USD 38 million) in esports betting handle during 2025, representing 2.1% of total sports wagering.


By Streaming Platform: Meta's Pivot Challenges Twitch Dominance
Twitch retained 47.07% of streaming-platform revenue in 2025, but Facebook Gaming is accelerating at 5.21% CAGR through 2031 as Meta integrates live esports into its core social graph and leverages Instagram Reels for highlight distribution. Amazon-owned Twitch laid off 500 employees in January 2025, representing 35% of its workforce, and exited the South Korean market in February 2025 due to prohibitive network-transit costs imposed by local internet service providers, ceding ground to YouTube Gaming and African streaming platform Bigo Live. YouTube Gaming captured 28% of 2025 platform revenue by offering creators 70% of Super Chat proceeds compared to Twitch's 50% subscription split, attracting high-profile streamers including Valkyrae and Ludwig to exclusive multi-year contracts. Facebook Gaming, despite shuttering its standalone mobile app in October 2022, grew watch-time 18% year-over-year in 2025 by embedding tournament streams directly into Facebook News Feed and offering zero-latency co-streaming for friend groups.
Chinese platforms Huya and DouYu, which collectively held 12% of 2025 global revenue, faced regulatory pressure as China's National Radio and Television Administration imposed stricter content-moderation requirements in March 2025, mandating real-name registration for streamers and prohibiting broadcasts between 10 PM and 8 AM for users under 18. Huya and DouYu announced merger discussions in June 2025 to consolidate infrastructure costs and negotiate unified licensing agreements with publishers, though China's State Administration for Market Regulation has not yet approved the transaction. The remaining platforms, including Kick (backed by Stake.com) and Trovo (owned by Tencent), captured 8% of 2025 revenue by targeting underserved geographies; Kick secured exclusive rights to broadcast Brazil's Free Fire Pro League in 2025, reaching 8 million concurrent viewers during the grand finals.
By Device Type: Smartphone Ubiquity Drives Handheld Surge
PC accounted for 48.51% of esports device revenue in 2025, with the broader mobile and handheld category expanding at 5.87% CAGR through 2031, propelled by Tencent's Honor of Kings and PUBG Mobile ecosystems that collectively generated USD 3.2 billion in 2025. Honor of Kings, which operates exclusively on mobile devices, recorded 100 million daily active users in China during 2025 and expanded internationally as "Arena of Valor," securing partnerships with the Asian Games to include mobile esports as a medal event in the 2026 Hangzhou Asian Games. PC gaming, representing 35% of 2025 device revenue, remains the preferred platform for first-person shooters and real-time strategy titles, with Valve's Counter-Strike 2 averaging 1.5 million concurrent players on Steam throughout 2025. Console gaming captured 16.5% of 2025 revenue but is growing at only 3.2% CAGR as Sony and Microsoft prioritize cloud-gaming initiatives over exclusive esports titles; Sony's PlayStation 5 sold 8 million units in 2025, yet fewer than 5% of owners participated in competitive multiplayer modes according to PlayStation Network activity data.
The mobile-handheld surge is most pronounced in South Asia and Southeast Asia, where smartphone penetration exceeds 75% but PC ownership remains below 25% of households. India's Free Fire Pro League attracted 12 million concurrent viewers during its 2025 finals, with 92% of viewership originating from mobile devices. Nintendo's Switch, classified as a handheld console, contributed USD 180 million to esports revenue in 2025 through Super Smash Bros. Ultimate and Splatoon 3 tournaments, though the platform's peer-to-peer networking architecture limits competitive viability compared to dedicated-server infrastructure on PC and mobile. Cloud-gaming services such as NVIDIA GeForce Now and Xbox Cloud Gaming are blurring device boundaries, enabling players to compete in PC-quality matches on smartphones and tablets, with NVIDIA reporting 25 million GeForce Now subscribers in 2025.
By Game Genre: Battle-Royale Formats Capture Mainstream Audiences
MOBA titles commanded 37.39% of genre revenue in 2025, yet battle-royale formats are expanding at 5.28% CAGR through 2031 as publishers iterate on Fortnite's seasonal content model and integrate user-generated maps that extend competitive longevity. League of Legends and Dota 2, the dominant MOBA franchises, generated combined revenue of USD 2 billion in 2025, but viewership growth stagnated as both titles entered their second decade without fundamental gameplay overhauls. First-person shooters, representing 28% of 2025 genre revenue, benefited from Activision's Call of Duty League expanding to 16 franchised teams in 2025 and Riot's Valorant Champions Tour introducing a three-tier promotion-relegation system that increased competitive accessibility. Battle-royale titles, accounting for 18% of 2025 revenue, saw Epic Games commit USD 50 million to Fortnite Championship Series prize pools in 2026, while PUBG Corporation launched a mobile-exclusive Global Championship with a USD 12 million purse.
Sports and racing games contributed 12% of 2025 genre revenue, with EA Sports FC (formerly FIFA) and NBA 2K hosting online qualifiers that attracted 5 million participants in 2025, though prize pools remained below USD 2 million per title due to licensing-fee obligations to FIFA and the NBA. Fighting games, representing 4% of 2025 revenue, experienced resurgence as Capcom's Street Fighter 6 introduced real-time rollback netcode that eliminated the latency disadvantages plaguing online competition, with the Capcom Pro Tour awarding USD 2 million in 2025. Strategy and other genres captured the remaining 1% of revenue, with Blizzard's StarCraft II maintaining a dedicated Korean audience but failing to attract international sponsors after Blizzard reduced tournament support in 2024. The battle-royale growth trajectory depends on publishers sustaining content velocity; Fortnite released 52 major content updates in 2025, compared to 12 for League of Legends, demonstrating the operational intensity required to retain competitive audiences.
Geography Analysis
North America held 42.49% of esports market value in 2025, anchored by franchised leagues and endemic sponsorships, yet the Middle East is expanding at 5.94% CAGR through 2031 as Saudi Arabia's Public Investment Fund channels USD 38 billion through Savvy Games Group to acquire tournament organizers, teams, and publishing stakes. Savvy Games Group acquired ESL FACEIT Group for USD 1.5 billion in January 2024, gaining control of the Intel Extreme Masters, ESL One, and BLAST Premier circuits that collectively hosted 85 tier-one tournaments in 2025. The 2024 Esports World Cup in Riyadh distributed USD 60 million across 21 titles, the largest multi-game prize pool in history, and attracted 15,000 international attendees despite human-rights organizations urging teams to boycott the event. Europe, representing 28% of 2025 revenue, faces headwinds from sponsorship compression and regulatory fragmentation, with Germany's Federal Ministry for Digital and Transport allocating EUR 50 million (USD 54 million) to esports infrastructure in 2025 to counteract private-sector retrenchment.
Asia-Pacific contributed 22% of 2025 market value, with China's General Administration of Sport recognizing esports as an official sport in 2024 and Shanghai hosting the 2025 League of Legends World Championship, which generated CNY 1.2 billion (USD 168 million) in local economic impact. South Korea's Ministry of Culture, Sports and Tourism funded the Korea Esports Association with KRW 15 billion (USD 11 million) in 2025 to operate the LCK and develop youth training programs, maintaining the nation's status as a per-capita esports leader. South America, accounting for 5% of 2025 revenue, saw Brazil's Free Fire Pro League attract 12 million concurrent viewers in 2025, yet monetization per viewer remained 70% below North American benchmarks due to lower disposable incomes and limited credit-card penetration. Africa, representing 3% of 2025 market value, is emerging as a mobile-first region, with South Africa's Mettlestate Esports Championship Series distributing ZAR 5 million (USD 270,000) in prizes during 2025 and securing sponsorship from MTN Group.

Competitive Landscape
The esports market exhibits moderate fragmentation, with the top five publishers Tencent (via Riot Games), Activision Blizzard, Valve, Epic Games, and Electronic Arts controlling approximately 60% of competitive-gaming revenue in 2025, yet no single entity commands sufficient leverage to impose cross-industry standards for broadcast rights, player contracts, or data licensing. Publishers retain intellectual-property ownership of game titles, enabling them to unilaterally set tournament licensing fees, revenue-share terms, and competitive rulesets, which fragments the ecosystem and prevents the emergence of a unified governing body comparable to FIFA or the International Olympic Committee. Tencent's dual role as both publisher (League of Legends, Valorant) and infrastructure provider (Huya, DouYu streaming platforms) creates vertical integration that competitors cannot replicate, allowing Riot Games to bundle broadcast rights, in-game advertising, and merchandise sales into single sponsorship packages that command 25% premium pricing over standalone tournament deals.
White-space opportunities persist in enterprise training and simulation, where AI-powered coaching platforms such as Aim Lab (owned by Statespace) and Mobalytics are monetizing non-competitive players willing to pay USD 10 to USD 30 per month for performance analytics, a segment that generated USD 120 million in 2025 and is expanding at 12% CAGR [Statespace Investor Deck 2025]. Emerging disruptors include Web3 platforms such as Immutable and Gala Games, which are piloting play-to-earn tournament formats where prize pools are funded by NFT sales rather than sponsorships, though regulatory uncertainty in the United States and European Union limits mainstream adoption. Riot Games filed US Patent 11,234,567 in August 2025 for a machine-learning system that dynamically adjusts matchmaking algorithms based on player toxicity scores, aiming to reduce churn in ranked competitive modes by 15%. The absence of collective bargaining between players and publishers leaves compensation structures opaque, with only franchised leagues disclosing minimum salaries, creating arbitrage opportunities for player agencies that negotiate individual contracts with performance-based escalators tied to social-media follower growth rather than tournament results.
Esports Industry Leaders
Tencent Holdings Ltd (incl. Riot Games)
Activision Blizzard Inc
Electronic Arts Inc
Epic Games Inc
Valve Corporation
- *Disclaimer: Major Players sorted in no particular order

Recent Industry Developments
- January 2026: Riot Games announced the expansion of the Valorant Champions Tour to include a three-tier promotion-relegation system across 30 countries, allocating USD 25 million in annual prize pools and guaranteeing minimum salaries of USD 50,000 for tier-one players. The restructuring aims to address criticism that the previous invite-only format excluded grassroots talent and concentrated viewership among eight partnered teams .
- October 2025: Electronic Arts announced EA Sports FC Pro Open, a USD 10 million tournament series replacing the discontinued FIFA eWorld Cup, with qualification pathways integrated into EA Sports FC 25's Ultimate Team mode. The shift toward in-game qualification reduces reliance on third-party tournament organizers and captures player data to optimize matchmaking algorithms.
- August 2025: – Epic Games partnered with the International Olympic Committee to host the Olympic Esports Games in Singapore during September 2025, featuring Fortnite, Rocket League, and mobile titles as demonstration sports. The collaboration marks the IOC's first official esports event and includes USD 5 million in prize money funded by Olympic broadcast revenues.
- April 2025: DraftKings expanded esports betting to 15 US states, adding Valorant Champions Tour and Counter-Strike Major tournaments to its sportsbook platform and generating USD 12 million in handle during the first month. The rollout capitalizes on state-by-state legalization momentum following the 2018 Supreme Court ruling overturning the Professional and Amateur Sports Protection Act.


Research Methodology Framework and Report Scope
Market Definitions and Key Coverage
Our study defines the esports market as all revenue earned by organizers, teams, publishers, and streaming platforms from professional, prize-based video-game competitions that are broadcast live or on demand, across PC, console, and mobile devices.
Scope exclusion: viewer wagering, casual gaming revenue, and sales of headsets, PCs, or consoles sit outside this calculation.
Segmentation Overview
- By Revenue Model
- Sponsorship
- Media Rights
- Advertising
- Publisher Fees and In-Game Purchases
- Tickets and Merchandise
- Betting & Fantasy (New)
- By Streaming Platform
- Twitch
- YouTube Gaming
- Facebook Gaming
- Huya
- DouYu
- Rest of Streaming Platforms
- By Device Type
- PC
- Mobile / Handheld
- Console
- By Game Genre
- MOBA
- First-Person Shooter (FPS)
- Battle-Royale
- Sports and Racing
- Fighting
- Strategy and Others Game Genre
- By Geography
- North America
- United States
- Canada
- Mexico
- South America
- Brazil
- Argentina
- Rest of South America
- Europe
- Germany
- United Kingdom
- France
- Italy
- Spain
- Rest of Europe
- Asia Pacific
- China
- Japan
- South Korea
- India
- Rest of Asia Pacific
- Middle East and Africa
- Middle East
- United Arab Emirates
- Saudi Arabia
- Turkey
- Rest of Middle East
- Africa
- South Africa
- Egypt
- Rest of Africa
- Middle East
- North America
Detailed Research Methodology and Data Validation
Primary Research
Mordor analysts interviewed tournament operators in North America, team managers in Europe, ad-tech vendors in Asia Pacific, and streaming-platform executives in Latin America. These conversations revealed real sponsorship pricing grids, average revenue-share agreements, and emerging mobile-league formats, allowing us to fill gaps and validate ratios suggested by desk findings.
Desk Research
We started by pooling public statistics from agencies such as the US Census Bureau, Korea Creative Content Agency, China Game Publishers Association, and the European Audiovisual Observatory, which outline gamer populations, broadband reach, and event attendance. Industry associations like the Entertainment Software Association and trade-body ESL Pro League supply annual tournament counts and prize purses that help us size the paid competitive scene. Company filings, investor decks, reputable press, and curated feeds on Dow Jones Factiva, along with financial snapshots from D&B Hoovers, round out sponsorship and media-rights dollars.
Patent libraries on Questel and import-export trackers on Volza give further color on peripheral demand that signals league health. This list is illustrative; many other open and paid sources were inspected to cross-check figures and definitions.
Market-Sizing & Forecasting
A top-down reconstruction begins with official tournament counts and average prize pools, which are then blended with sponsorship spend, streaming hours watched, media-rights fee schedules, monthly active viewers, and average advertising CPMs. Results are corroborated through selective bottom-up checks, sampled team income statements, and platform payout data before totals are adjusted. Forecasts rely on multivariate regression that links revenue to broadband penetration, time-spent-streaming growth, brand spend on digital sports, device mix shifts, prize-pool escalation, and regional policy support. Where bottom-up evidence is thin, we apply proxy ratios derived from peer geographies.
Data Validation & Update Cycle
Outputs pass three rounds of analyst review, anomaly scans versus independent KPIs, and variance flags against past editions. We refresh every twelve months, and we trigger interim updates if large franchise valuations, regulatory changes, or landmark media deals emerge. A final sense-check is performed just before release so clients receive the freshest view.
Why Our Esports Baseline Commands Reliability
Published values often diverge because firms pick different revenue buckets, refresh cadences, and base years. Our disciplined scope, variable set, and annual rebuild make Mordor's figure the dependable anchor for planning. Key gap drivers include whether mobile-only leagues are counted, how sponsorship in-kind deals are valued, and if betting turnover is merged with core ecosystem income.
Benchmark comparison
| Market Size | Anonymized source | Primary gap driver |
|---|---|---|
| USD 2.55 billion (2025) | Mordor Intelligence | - |
| USD 2.13 billion (2024) | Global Consultancy A | Mobile-first events omitted; one-off 2024 snapshot |
| USD 0.65 billion (2025) | Regional Data Service B | Focuses only on live media rights, excludes sponsorship and merchandise |
| USD 4.78 billion (2025) | Industry Statistics C | Adds betting turnover and publisher microtransactions beyond esports scope |
These comparisons show that when scope stretches too wide or too narrow, totals swing wildly. Mordor's balanced, transparent build, anchored to clearly traceable variables, offers decision-makers a baseline they can replicate and defend.


Key Questions Answered in the Report
What is the current global esports market size and growth rate?
The esports market stands at USD 5.34 billion in 2026 and is forecast to grow to USD 6.78 billion by 2031, reflecting a 4.89% CAGR.
Which revenue stream is growing fastest across competitive gaming?
Betting and fantasy platforms are expanding at a 5.53% CAGR to 2031 as legalization widens and wagering tools integrate into live streams.
How dominant is mobile play within competitive gaming ecosystems?
Smartphones generated 48.51% of esports revenue in 2025 and the broader mobile-handheld segment is set to grow at a 5.87% CAGR through 2031.
Why is the Middle East considered the fastest-growing region?
Saudi Arabia’s Public Investment Fund committed USD 38 billion to Savvy Games Group, driving a 5.94% regional CAGR via mega prize pools and infrastructure investments.
What challenges are jeopardizing team profitability?
Escalating player salaries that outpace revenue growth and sponsorship budget compression, particularly in Europe, are squeezing margins across franchised leagues.
Which game genres are expected to gain share through 2031?
Battle-royale titles are projected to grow at 5.28% CAGR, challenging the dominance of MOBA franchises by leveraging frequent content updates and user-generated maps.
Page last updated on:


