Virtual Production Market Size and Share
Market Overview
| Study Period | 2020 - 2031 |
|---|---|
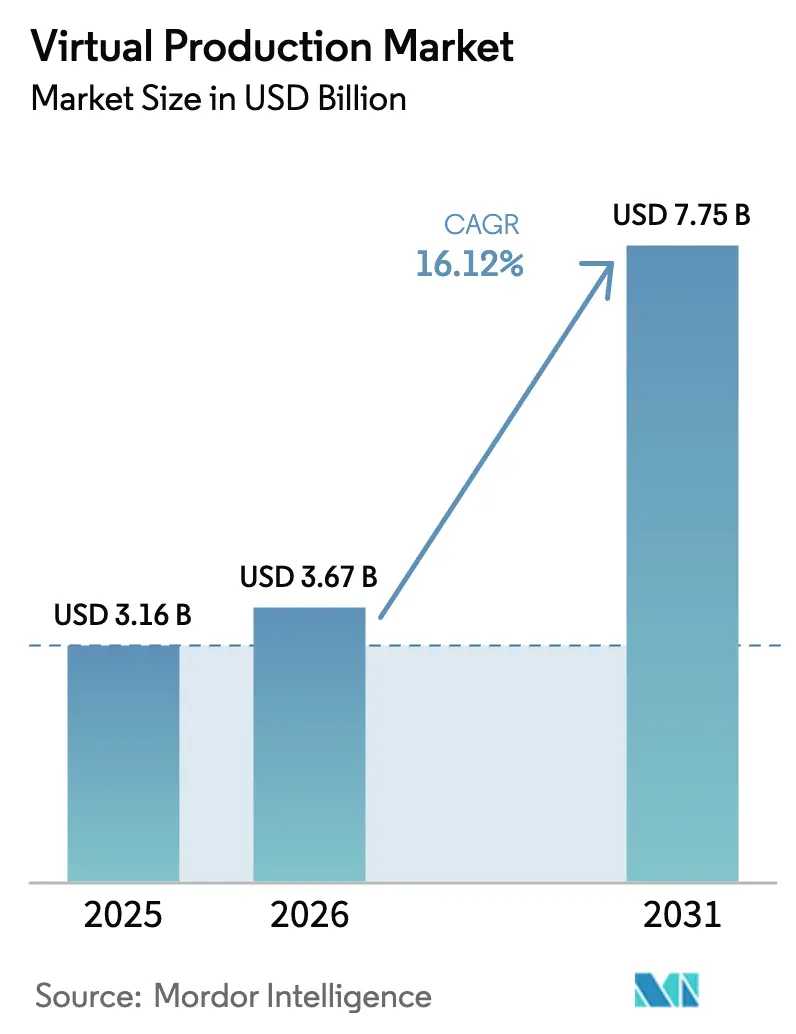
| Market Size (2026) | USD 3.67 Billion |
| Market Size (2031) | USD 7.75 Billion |
| Growth Rate (2026 - 2031) | 16.12% CAGR |
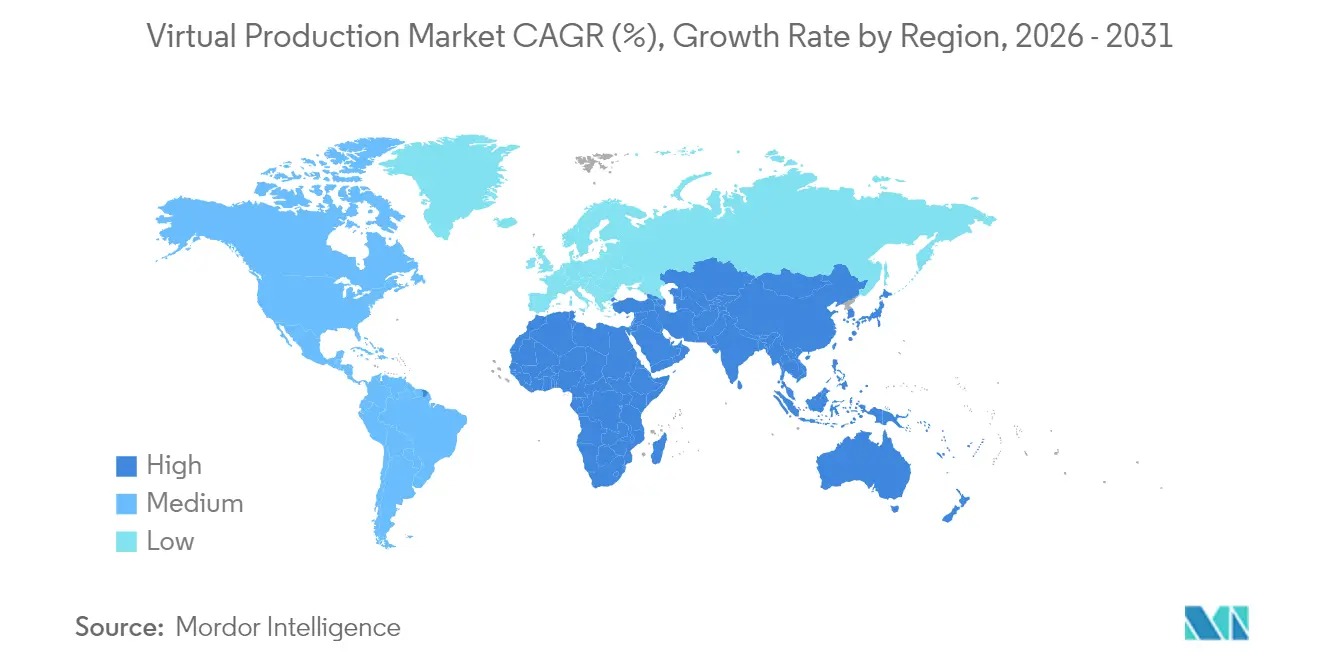
| Fastest Growing Market | Asia Pacific |
| Largest Market | North America |
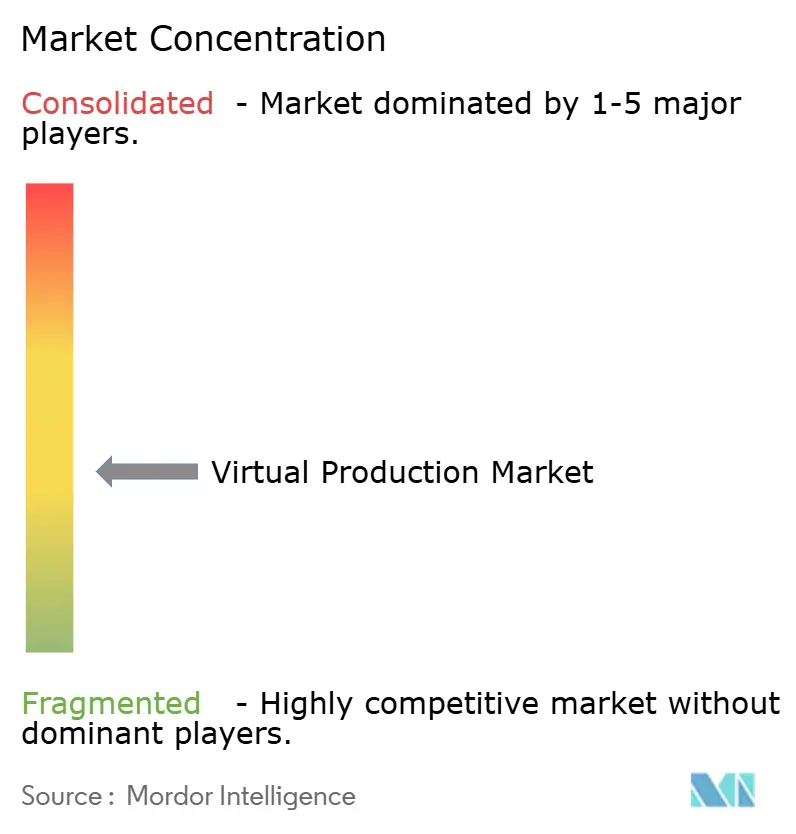
| Market Concentration | Medium |
Major Players *Disclaimer: Major Players sorted in no particular order Image © Mordor Intelligence. Reuse requires attribution under CC BY 4.0. | |
Virtual Production Market Analysis by Mordor Intelligence
The virtual production market size in 2026 is estimated at USD 3.67 billion, growing from 2025 value of USD 3.16 billion with 2031 projections showing USD 7.75 billion, growing at 16.12% CAGR over 2026-2031. Demand is accelerating as studios, broadcasters, and advertisers seek real-time content creation that lowers travel, set-build, and post-production expenses. Software platforms hold a 52% revenue share in 2024, sustained by continuous upgrades in real-time rendering and seamless integration with camera-tracking hardware. LED volume stages, while still smaller in installed base than chromakey, are expanding at more than 30% annually thanks to falling panel prices and rising availability of purpose-built stages. Expansionary tax regimes in Europe, growing cloud collaboration for cross-border projects, and rapid AI adoption for pre-visualization are expanding the addressable opportunity for technology vendors and managed-service firms in the virtual production market. Interoperability gaps among disparate toolchains and a limited pool of skilled LED-volume operators remain the main structural hurdles to near-term scale.
Key Report Takeaways
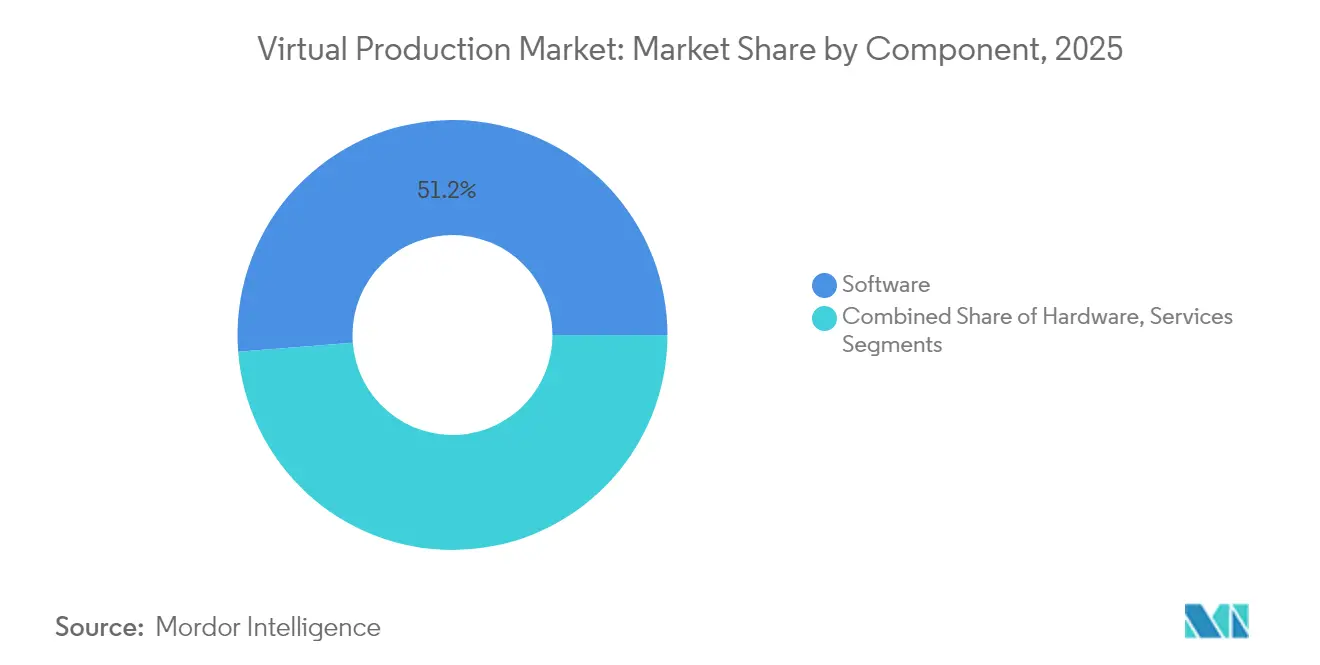
- By component, software led with 51.25% of virtual production market share in 2025, while services are poised to grow at a 20.74% CAGR to 2031.
- By stage type, green screen commanded 45.55% of the virtual production market size in 2025; LED volumes are advancing at a 31.48% CAGR through 2031.
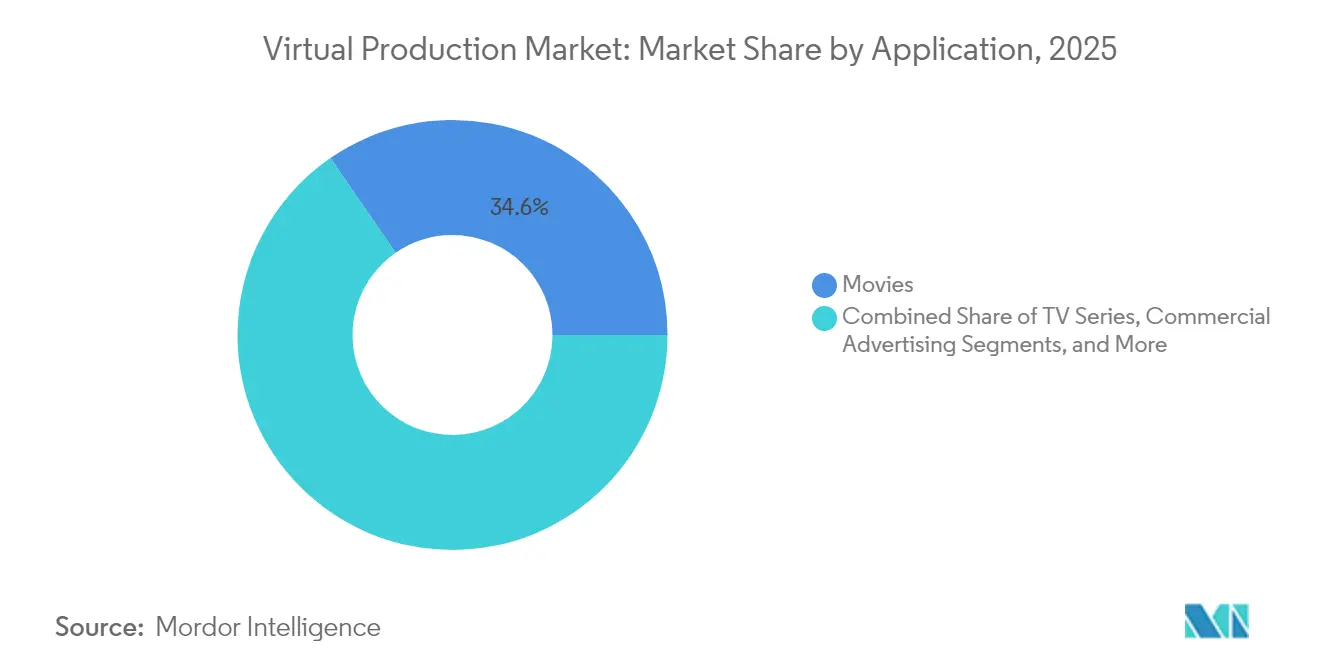
- By application, movies contributed 34.62% revenue share in 2025, whereas live events are projected to record a 28.37% CAGR over 2026-2031.
- By end-user, major film studios captured 37.62% of the virtual production market size in 2025; advertising and marketing agencies are forecast to expand at a 23.42% CAGR.
- By geography, North America maintained 40.55% share of the virtual production market in 2025, while Asia-Pacific is on track for a 19.05% CAGR through 2031.
Note: Market size and forecast figures in this report are generated using Mordor Intelligence’s proprietary estimation framework, updated with the latest available data and insights as of 2026.
Global Virtual Production Market Trends and Insights
Drivers Impact Analysis*
| Driver | (~) % Impact on CAGR Forecast | Geographic Relevance | Impact Timeline |
|---|---|---|---|
| Cost-saving imperative amid constrained production budgets | +3.20% | North America; spillover to Europe | Short term (≤ 2 years) |
| Expansion of European film tax incentives aimed at virtual production infrastructure | +2.50% | United Kingdom, Germany, France | Medium term (2-4 years) |
| Price decline in high-pixel-pitch LED panels manufactured in China | +4.10% | Global; strongest in Asia-Pacific | Short term (≤ 2 years) |
| Cloud-based real-time collaboration demand for cross-border productions | +2.80% | Global | Medium term (2-4 years) |
| Integration of AI-generated environments into real-time engines | +3.70% | North America, Europe, Asia-Pacific | Medium term (2-4 years) |
| Rising demand in Middle-Eastern premium episodic content requiring climate-controlled virtual stages | +1.90% | Middle East (UAE, Saudi Arabia) | Long term (≥ 4 years) |
| Source: Mordor Intelligence | |||
Cost-saving imperative amid tight streaming budgets
Studios facing flattened subscriber growth are prioritizing capital-light workflows that shave both production days and travel outlays. Field studies have documented 20%–50% reductions in greenhouse-gas emissions when productions switch to real-time LED stages, translating to sizable drops in location fees, freight, and overtime labor. [1]Lisa Fitzpatrick, “Green Screen Report Shows Virtual Production Cuts Emissions,” ulster.ac.uk A recent North American feature shot primarily inside a single LED volume cut insurance premiums and compressed its post-production schedule by eliminating complex compositing passes. These tangible savings are encouraging streaming originals to assign a larger share of budgets to the virtual production market. Vendors that bundle software subscriptions with managed-service crews are positioning themselves as turnkey partners for budget-constrained series.
Expansion of European film tax incentives
Targeted incentives are tilting project selection toward territories that underwrite virtual production infrastructure. Ireland’s additional 8% uplift and the United Kingdom’s new 53% credit for independent films now push effective reimbursement rates close to 40% of qualified spend. Producers already report that incentive-linked stages in London, Dublin, and Berlin are booking higher utilisation, an early signal that fiscal tools are driving relocation of shoots. These policies also catalyse private investment in LED stages, virtual-art-department services, and training academies, each reinforcing the growth loop for the virtual production market.
Price decline in high-pixel-pitch LED panels
The average cost per square metre for 1.5-mm-pitch panels manufactured in Shenzhen has fallen by double digits since 2023, bringing total stage-rental rates down for mid-budget shoots. This affordability widens the addressable customer base to independent filmmakers and regional broadcasters that previously relied on chromakey. Hardware innovators such as ams OSRAM are layering micro-LED arrays for finer colour reproduction, giving directors greater on-set lighting fidelity. As high-density panels become commoditised, service providers are scaling multi-location fleets, further enlarging the virtual production market.
Integration of AI-generated environments
Generative-AI toolsets embedded in real-time engines remove days from pre-visualization by auto-populating parallax-correct backgrounds, fog volumes, and surface textures. Research teams at the University of Bristol have demonstrated unified frameworks that let art directors iterate scene variants with natural-language prompts while preserving physically-based lighting. [2]Nantheera Anantrasirichai, “Artificial Intelligence in Creative Industries,” arxiv.org Early adopters report meaningful cuts in key-frame animation and look-dev cycles, redirecting artist time to higher-value creative tasks. While quality-control guardrails are still needed to assure brand accuracy, the productivity gains continue to lure more productions into the virtual production market.
Restraints Impact Analysis*
| Restraint | (~) % Impact on CAGR Forecast | Geographic Relevance | Impact Timeline |
|---|---|---|---|
| Shortage of skilled LED-volume operators in emerging markets | −2.8% | Asia-Pacific; Latin America | Medium term (2-4 years) |
| Color-moiré and refresh-mismatch issues between LED walls and cameras | −1.5% | Global | Short term (≤ 2 years) |
| High retrofit CAPEX for legacy sound-stage power infrastructure | −2.3% | North America; Europe | Medium term (2-4 years) |
| Interoperability challenges due to fragmented technical standards | −3.1% | Global | Medium term (2-4 years) |
| Source: Mordor Intelligence | |||
Shortage of skilled LED-volume operators
Industry surveys reveal that barely a few dozen technicians worldwide possess deep proficiency in LED-volume operation, camera tracking, and colour calibration. Training programmes such as MARS Academy in the United Kingdom and Disguise’s Virtual Production Accelerator are ramping cohorts to bridge the gap. [3]British Cinematographer Editorial Team, “MARS Academy Closes Skills Gap,” britishcinematographer.co.uk Until the talent pool broadens, ambitious studios in India, Brazil, and Indonesia may face delivery delays or premium day-rates, restraining growth in those sub-regions of the virtual production market.
Interoperability challenges from fragmented standards
Virtual production workflows often link LED processors, camera-tracking rigs, and real-time engines from different vendors, creating brittle hand-offs. SMPTE’s Rapid Industry Solutions working group is formalising metadata schemas for lens distortion, focus, and frame synchronisation. [4]Society of Motion Picture and Television Engineers, “Rapid Industry Solutions,” smpte.org Parallel efforts around the OpenUSD scene description aim to simplify asset transport across tools. Until these standards achieve mass adoption, engineering overhead will continue to weigh on budgets and impede seamless scaling of the virtual production market.
*Our forecasts treat driver/restraint impacts as directional, not additive. The impact forecasts reflect baseline growth, mix effects, and variable interactions.
Segment Analysis
By Component: Software Sustains Lead, Services Accelerate
Software platforms anchored 51.25% of revenue in 2025, confirming their status as the primary engine of value capture within the virtual production market. Real-time engines refine global-illumination algorithms quarterly, giving cinematographers instant feedback on volumetric lighting and occlusion. Plugin ecosystems now expose APIs for AI-assisted scene optimisation. Managed-service layers integrate these updates into turnkey pipelines, ensuring predictable performance from pre-viz to final-pixel delivery.
Services, forecast to grow at 20.74% CAGR, are benefiting from acute demand for design, integration, and crew outsourcing. Studios lean on consultants to convert legacy sound stages, balance power loads, and tune colour pipelines. Outsourced talent mitigates the operator shortage and lowers the upfront learning curve. Hardware remains foundational: LED panels, camera-tracking beacons, and synchronised lighting grids underpin real-time workflows. Continued innovation in sensor fusion and low-latency display drivers will keep hardware spending resilient inside the virtual production industry.


By Stage Type: LED Volumes Challenge Chromakey
Green-screen stages accounted for 45.55% of virtual production market share in 2025, sustained by mature pipelines and widespread operator familiarity. For single-camera talk shows and VFX-heavy dramas, chromakey still offers cost-effective flexibility. That said, directors increasingly cite colour-spill clean-up and talent eyeline issues as creative compromises that affect authenticity.
LED volumes are expanding at 31.48% CAGR, set to dominate mid-decade. Falling panel costs, wider availability of curved cylinders and ceiling panels, and better display-camera synchronisation are driving adoption. The virtual production market size for LED stages is projected to eclipse chromakey spend before 2031 as producers prioritise in-camera VFX that reduce post-compositing. Hybrid stages combining partial LED walls with chromakey floors provide an incremental path for studios making their first investments.
By Application: Feature Films Hold Lead, Live Events Surge
Feature films delivered 34.62% revenue in 2025 and remain the marquee showcase for visual-fidelity breakthroughs. Flagship facilities such as the 34,000 sq ft Stage 15 at Amazon MGM Studios deploy 3,000 LED panels to render parallax-correct cityscapes in real time. Such headline projects boost investor confidence and catalyse ancillary tool development across the virtual production market.
Live events and sports broadcasts, projected to grow at 28.37% CAGR, are capitalising on real-time set extensions that respond to scoring updates or audience interaction. Broadcasters value the ability to swap environments between matches without relocating crews, reducing logistics costs and carbon footprints. Episodic series, the second-largest application, exploit the technology to mirror lighting from one episode to the next, safeguarding narrative continuity and budget discipline. Advertising, music videos, and educational content collectively diversify the virtual production industry’s customer mix.
By End-User: Major Studios Invest, Agencies Accelerate
Major film studios control 37.62% of 2025 spend, underpinned by multi-year infrastructure build-outs that shield intellectual property and shorten post-production. Sony Pictures Entertainment’s partnership with Pixomondo to operate its large-format volume highlights the strategic stakes firms place on proprietary capacity.
Advertising and marketing agencies, forecast at 23.42% CAGR, are migrating to LED stages to deliver multi-platform assets in compressed timelines. Rapid environment swaps support multiple products within a single shooting block, unlocking cost-efficiency. TV networks and OTT services, the second-largest cohort, leverage virtual stages for variety shows and episodic drama. Independent creators and academic institutions broaden participation, reflecting democratisation within the virtual production market.
Geography Analysis
North America commanded 40.55% of revenue in 2025, leveraging deep pools of VFX talent and aggressive stage build-outs in Los Angeles, Vancouver, and Atlanta. Streaming studios accelerate demand by insisting on carbon-footprint transparency, pushing suppliers to standardise real-time workflows that deliver measurable savings. Federal and state incentives covering digital-production expenditures further entrench the region’s leadership.
Asia-Pacific is the fastest-expanding sub-region, climbing toward a 19.05% CAGR through 2031. Chinese panel makers drive bill-of-materials deflation, South Korean and Japanese integrators pioneer camera-sensor fusion, and India’s USD 29.4 billion media sector increases its content exports. Early-stage academy programmes in Australia and New Zealand foster specialist operators, enabling regional productions to capture more downstream value inside the virtual production market.
Europe maintains a stronghold through incentive-bankrolled studios in London, Dublin, and Berlin. The virtual production market size inside the United Kingdom is amplified by a 53% expenditure credit for independent features. Eastern European hubs offer cost-competitive alternatives for U.S. and Korean co-productions. Meanwhile, the Middle East and Latin America register emerging clusters: new LED stages in Dubai cater to premium episodic content, while Mexico City’s historic Churubusco Studios hosts Amazon Productions oriented toward Spanish-language subscribers.

Competitive Landscape
The virtual production market is moderately fragmented, with specialist vendors, large media-service groups, and semiconductor firms jostling for share. NEP Group’s acquisition spree of Prysm Collective, Lux Machina, and Halon Entertainment demonstrates a race toward vertical integration that spans pre-viz, stage operation, and final-pixel delivery. This consolidation bundles scarce talent with proprietary pipelines, appealing to studios seeking single-contract accountability.
Technology differentiation revolves around display latency, colour-accuracy, and camera-tracking robustness. Disguise’s workflow alliance with NVIDIA brings GPU-accelerated compositing and AI-assisted set-extension tools to production crews. SMPTE and industry coalitions are addressing metadata interoperability, anticipating demand for plug-and-play setups that lower engineering overhead.
White-space opportunities emerge in mid-tier regional markets where installed capacity lags content demand. LED manufacturers like ROE Visual and Absen partner with local integrators to seed demonstration stages that showcase cost savings to broadcasters. Managed-service providers offering subscription models stand to capture recurring revenue as the virtual production industry scales beyond marquee film projects into multi-language soaps, esports, and corporate events.
Virtual Production Industry Leaders
Epic Games Inc.
Industrial Light and Magic (Lucasfilm Ltd.)
Adobe Inc.
NVIDIA Corporation
Disguise Ltd.
- *Disclaimer: Major Players sorted in no particular order

Recent Industry Developments
- April 2025: Disguise secured GBP 1.2 million (USD 1.63 million) in EU-Innovate UK grants to accelerate R&D in latency-reduction and AI-assisted scene management.
- April 2025: Sony launched the OCELLUS camera-tracking system at NAB 2025, promising sub-pixel positional accuracy for large-format volumes.
- March 2025: The University of Bristol and Lux Machina opened a virtual production stage within the GBP 30 million (USD 40.82 million) MyWorld creative-technologies hub.
- December 2024: Kadokawa Daiei Studio unveiled No.C Stage, integrating Sony Crystal LED panels to cut set waste by 50%.


Global Virtual Production Market Report Scope
Virtual production uses technology to join the digital world with the physical world in real time. It blends traditional filmmaking techniques with modern technology to help creatives achieve their vision.
The virtual production market is segmented by component (hardware, software, services), by applications (tv series, commercial ads, movies, online videos, other applications), by geography (North America, Europe, Asia-Pacific, Latin America, Middle East and Africa). The market sizes and forecasts are provided in terms of value (usd) for all the above segments.
| Hardware | Cameras and Sensors |
| LED Walls and Panels | |
| Motion-Capture and Tracking Systems | |
| Rendering Workstations and Servers | |
| Specialized Networking Equipment | |
| Software | Content-Creation and Scene-Building Tools |
| Real-time Rendering Engines | |
| Virtual Camera and Simul-Cam Systems | |
| Pre-Visualization and Story-boarding Software | |
| VFX and Post-Production Suites | |
| Services | System Integration and Consulting |
| Managed Production Services | |
| Training and Certification | |
| Maintenance and Support |
| LED Volume Stage |
| Green Screen / Chromakey Stage |
| Hybrid Stage (LED + Chromakey) |
| On-Location Mixed-Reality Set-ups |
| Movies |
| TV Series |
| Commercial Advertising |
| Music Videos |
| Others (Live Events and Sports Broadcasts, Online Streaming / OTT Content, Education and Training Content) |
| Major Film Studios |
| TV Broadcasters and OTT Platforms |
| Advertising and Marketing Agencies |
| Live-Event Producers |
| Independent Content Creators and Small Studios |
| Educational Institutions |
| North America | United States |
| Canada | |
| Mexico | |
| South America | Brazil |
| Argentina | |
| Rest of South America | |
| Europe | Germany |
| United Kingdom | |
| France | |
| Italy | |
| Spain | |
| Rest of Europe | |
| Asia-Pacific | China |
| Japan | |
| South Korea | |
| India | |
| Australia | |
| New Zealand | |
| Rest of Asia-Pacific | |
| Middle East and Africa | United Arab Emirates |
| Saudi Arabia | |
| South Africa | |
| Rest of Middle East and Africa |
| By Component | Hardware | Cameras and Sensors |
| LED Walls and Panels | ||
| Motion-Capture and Tracking Systems | ||
| Rendering Workstations and Servers | ||
| Specialized Networking Equipment | ||
| Software | Content-Creation and Scene-Building Tools | |
| Real-time Rendering Engines | ||
| Virtual Camera and Simul-Cam Systems | ||
| Pre-Visualization and Story-boarding Software | ||
| VFX and Post-Production Suites | ||
| Services | System Integration and Consulting | |
| Managed Production Services | ||
| Training and Certification | ||
| Maintenance and Support | ||
| By Stage Type | LED Volume Stage | |
| Green Screen / Chromakey Stage | ||
| Hybrid Stage (LED + Chromakey) | ||
| On-Location Mixed-Reality Set-ups | ||
| By Application | Movies | |
| TV Series | ||
| Commercial Advertising | ||
| Music Videos | ||
| Others (Live Events and Sports Broadcasts, Online Streaming / OTT Content, Education and Training Content) | ||
| By End-User | Major Film Studios | |
| TV Broadcasters and OTT Platforms | ||
| Advertising and Marketing Agencies | ||
| Live-Event Producers | ||
| Independent Content Creators and Small Studios | ||
| Educational Institutions | ||
| By Geography | North America | United States |
| Canada | ||
| Mexico | ||
| South America | Brazil | |
| Argentina | ||
| Rest of South America | ||
| Europe | Germany | |
| United Kingdom | ||
| France | ||
| Italy | ||
| Spain | ||
| Rest of Europe | ||
| Asia-Pacific | China | |
| Japan | ||
| South Korea | ||
| India | ||
| Australia | ||
| New Zealand | ||
| Rest of Asia-Pacific | ||
| Middle East and Africa | United Arab Emirates | |
| Saudi Arabia | ||
| South Africa | ||
| Rest of Middle East and Africa | ||


Key Questions Answered in the Report
What is the current value of the virtual production market?
The market is worth USD 3.67 billion in 2026 and is projected to hit USD 7.75 billion by 2031.
Which component leads revenue generation?
Software platforms capture 51.25% of 2025 revenue, driven by rapid updates in real-time rendering and workflow integration.
How fast are LED volume stages growing?
LED volumes are expanding at a 31.48% CAGR and are expected to surpass chromakey stages before 2031.
Why is Asia-Pacific the fastest-growing region?
Hardware price deflation, rising local content output, and national training programmes together support a 19.05% CAGR for Asia-Pacific through 2031.
What are the main obstacles limiting adoption?
A shortage of skilled LED-volume operators and a lack of unified technical standards are the two most significant restraints on sector expansion.
How do tax incentives influence virtual production investment?
Generous credits in the United Kingdom and Ireland can offset up to 40% of eligible spend, prompting producers to relocate shoots and accelerating regional facility build-outs.
Page last updated on:


