Online Fitness Market Size and Share
Market Overview
| Study Period | 2020 - 2031 |
|---|---|
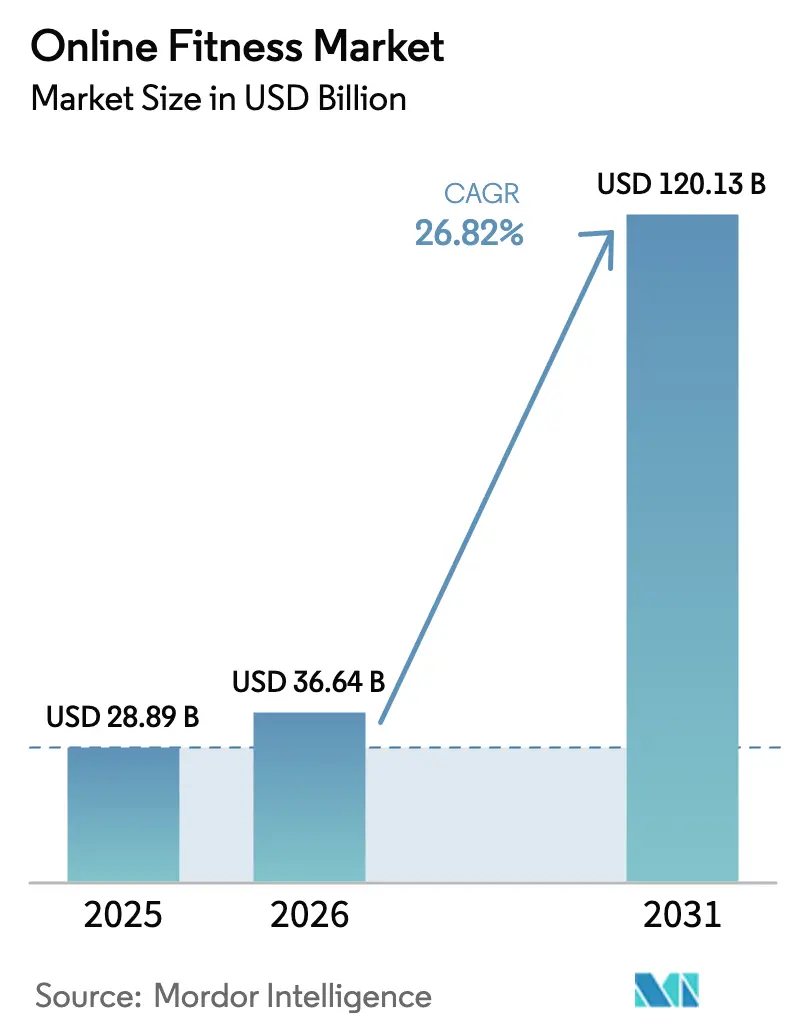
| Market Size (2026) | USD 36.64 Billion |
| Market Size (2031) | USD 120.13 Billion |
| Growth Rate (2026 - 2031) | 26.82% CAGR |
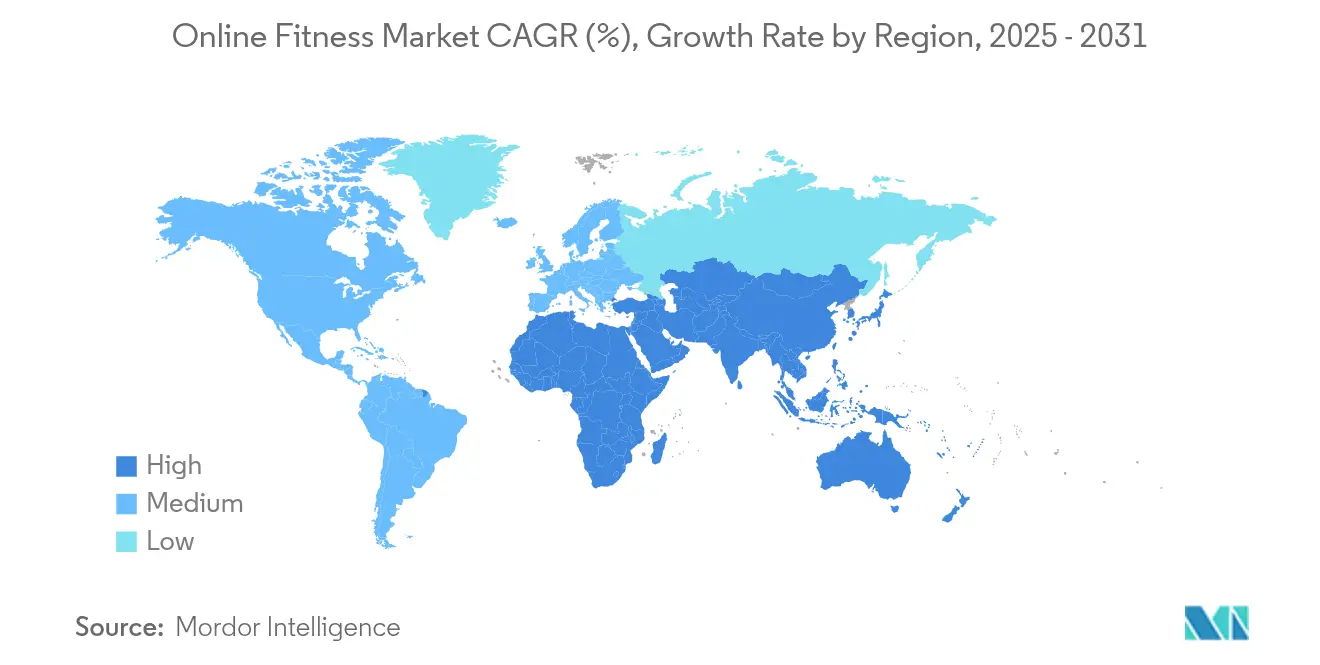
| Fastest Growing Market | Asia Pacific |
| Largest Market | North America |
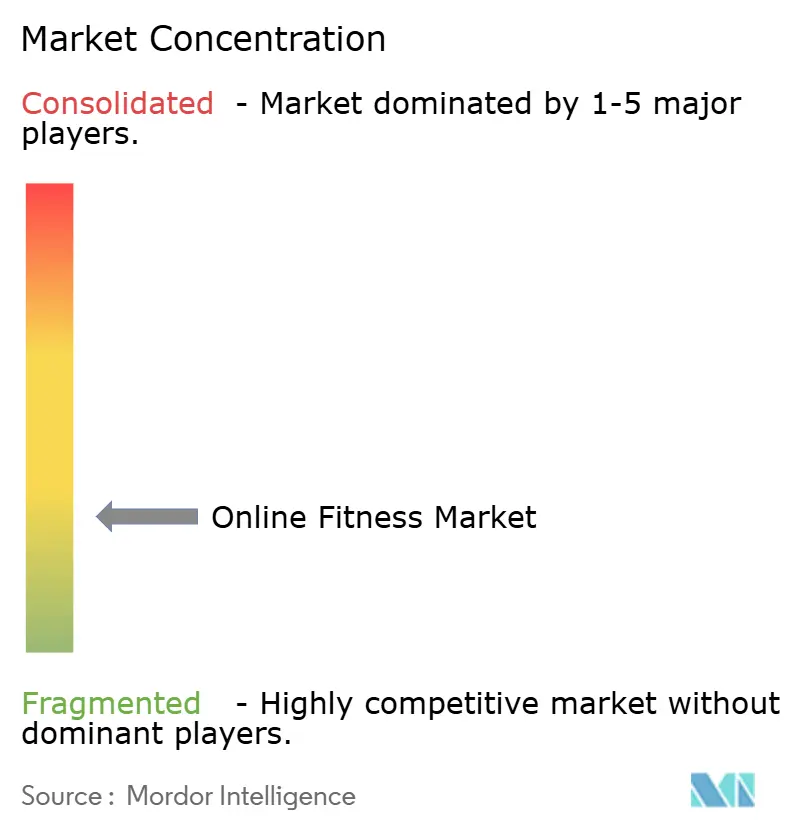
| Market Concentration | Low |
Major Players *Disclaimer: Major Players sorted in no particular order Image © Mordor Intelligence. Reuse requires attribution under CC BY 4.0. | |
Online Fitness Market Analysis by Mordor Intelligence
The online fitness market size was valued at USD 28.89 billion in 2025 and estimated to grow from USD 36.64 billion in 2026 to reach USD 120.13 billion by 2031, at a CAGR of 26.82% during the forecast period (2026-2031). Rapid consumer migration from pandemic-driven necessity toward technology-enabled preference underpins this surge as artificial intelligence, immersive interfaces, and expanded connectivity improve the perceived value of remote exercise. Live streaming continues to command attention because real-time interaction fosters accountability, yet on-demand libraries scale global reach and deepen personalization. Mobile-first experiences prevail as smartphones integrate cameras, motion sensors, and biometric pairing features that replicate in-studio coaching. Meanwhile, hybrid revenue approaches broaden accessibility, and corporate wellness incentives convert employers into high-volume distribution partners. Competitive intensity grows as established brands rationalize costs, newcomers deploy machine-learning differentiation, and strategic mergers reshape supply dynamics.
Key Report Takeaways
- By streaming type, Live content led with 55.35% of online fitness market share in 2025, while the On-Demand format records the fastest 35.59% CAGR through 2031.
- By device, Smartphones captured 48.22% share of the online fitness market in 2025 and expand at a 32.09% CAGR to 2031.
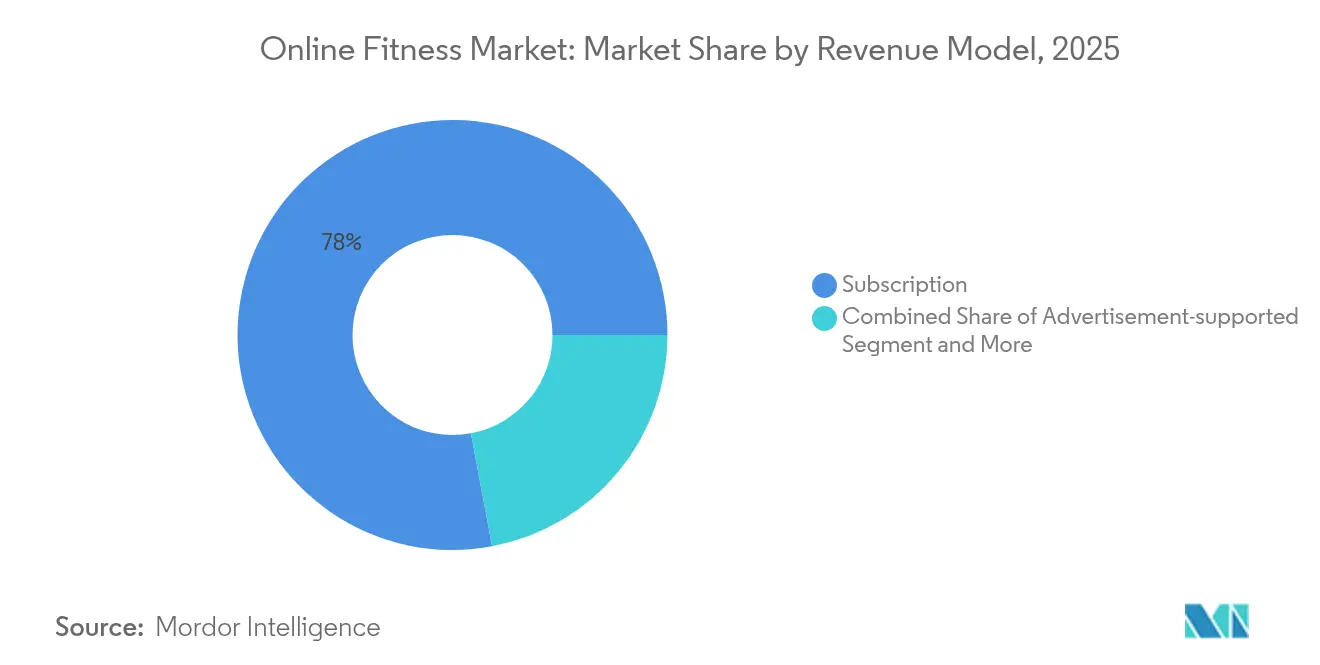
- By revenue model, Subscriptions commanded 77.95% share of the online fitness market in 2025; Hybrid/Freemium models post a 36.68% CAGR over the same horizon.
- By end user, Individual consumers held 63.88% share of the online fitness market size in 2025, whereas Corporate and Insurance-sponsored segments advance at a 31.07% CAGR to 2031.
- By geography, North America represented 41.25% of the online fitness market share in 2025, yet Asia-Pacific shows the highest 30.17% CAGR through 2031.
Note: Market size and forecast figures in this report are generated using Mordor Intelligence’s proprietary estimation framework, updated with the latest available data and insights as of 2026.
Global Online Fitness Market Trends and Insights
Drivers Impact Analysis*
| Driver | (~) % Impact on CAGR Forecast | Geographic Relevance | Impact Timeline |
|---|---|---|---|
| Convenience and anytime-anywhere access | +4.2% | Global | Short term (≤ 2 years) |
| Explosive smartphone and wearable penetration | +6.8% | Asia-Pacific core, spill-over to MEA | Medium term (2-4 years) |
| Corporate and payer wellness incentives | +3.5% | North America and EU | Medium term (2-4 years) |
| AI-curated hyper-personalised workouts | +7.1% | Global | Long term (≥ 4 years) |
| Emergence of 3D/VR metaverse gyms | +2.9% | North America and Asia-Pacific | Long term (≥ 4 years) |
| Integration into health-care provider rehab pathways | +3.8% | Global | Medium term (2-4 years) |
| Convenience and anytime-anywhere access | +4.2% | Global | Short term (≤ 2 years) |
| Source: Mordor Intelligence | |||
AI-Curated “Hyper-Personalised” Workouts
Artificial intelligence now analyzes behavior patterns, biometrics, and historical performance to deliver adaptive programming that updates in real time. Platforms such as Coachify AI reported USD 1.4 million annual recurring revenue in their first year by using computer vision for automated form correction and predictive analytics that suggest optimal workout timing. Personalization counters the sector’s 71% three-month abandonment challenge and sustains engagement through emotion-aware prompts and wearable integrations that continuously adjust intensity.
Corporate and Payer Wellness Incentives
Enterprise wellness spending exceeds USD 117 billion by 2030 as employers fund digital fitness to reduce healthcare costs, unlock productivity, and strengthen retention. Insurers extend preventive-care reimbursement, transforming basic gym stipends into comprehensive digital-health ecosystems integrating nutrition and mental-wellness modules. Wearable distribution has reached 50% of U.S. employees, creating data pipelines that enable targeted interventions and measurable health outcomes.[1]PatentPC, “Global Smartphone Penetration and Wearable Adoption Trends,” patentpc.com
Explosive Smartphone and Wearable Penetration
Global smartphone users surpassed 6.8 billion in 2024 while wearable devices reached 1.1 billion units, driving a surge of sensor-rich workout applications. In the United States, 25% of adults own a smartwatch or fitness tracker, and these devices share real-time biometrics that refine coaching cues and long-term progress tracking.[2]Pew Research Center, “Smartwatch and Fitness Tracker Ownership in the United States,” pewresearch.org
Integration into Health-Care Provider Rehab Pathways
Hospitals integrate digital exercise prescriptions for musculoskeletal recovery and chronic-disease management. Physitrack surpasses 3 million downloads, and Hinge Health studies show lower pain scores and reduced surgery intent among tele-physio users. Mixed reimbursement now supports remote therapy in numerous jurisdictions, expanding reach to rural communities where in-person physical therapy remains scarce.[3]Health Club Management, “Purpose Brands Appoints New Chief Executive,” healthclubmanagement.com
Restraints Impact Analysis*
| Restraint | (~) % Impact on CAGR Forecast | Geographic Relevance | Impact Timeline |
|---|---|---|---|
| High churn and low long-term adherence | -5.8% | Global | Short term (≤ 2 years) |
| Bandwidth / connectivity issues in emerging markets | -3.2% | Asia-Pacific emerging, Africa, Latin America | Medium term (2-4 years) |
| Rising privacy concerns around biometric data | -2.1% | North America and EU | Short term (≤ 2 years) |
| Uptake plateau in post-pandemic cohorts | -1.9% | Global | Short term (≤ 2 years) |
| Source: Mordor Intelligence | |||
High Churn and Low Long-Term Adherence
Retention remains the sector’s costliest hurdle, as 71% of users quit within three months and only 40% continue past day one. Top performers reach 47.5% 30-day retention by embedding gamification, social leaderboards, and adaptive motivation triggers. Platforms report workout completion above 70% correlating with 43% higher lifetime value, making behavioral design a strategic imperative.
Bandwidth and Connectivity Issues in Emerging Markets
Streaming quality dips in regions with unstable networks, discouraging uptake among lower-income populations. Research in Southeast Asia and Latin America shows bandwidth shortfalls and limited digital literacy narrowing adoption gaps. Investments like Airtel’s 100 Tbps 2Africa Pearls cable materially improve capacity, yet last-mile constraints persist, so platforms optimize by offering offline downloads and adaptive bitrate streaming.
*Our forecasts treat driver/restraint impacts as directional, not additive. The impact forecasts reflect baseline growth, mix effects, and variable interactions.
Segment Analysis
By Streaming Type: Audience Engagement Dynamics
Live sessions held 55.35% of 2025 revenue by fostering immediacy, social accountability, and instructor feedback that mirror studio energy. Subscriber retention metrics consistently outperform pre-recorded formats because communal workouts create habit loops. Yet on-demand libraries accelerate at 35.59% CAGR as global audiences favor schedule flexibility, language options, and AI-based curation. Platforms blend both streams, offering lower-latency infrastructure for live broadcasts and algorithmic search for evergreen catalogues. Investment in multicamera delivery and low-buffer networks protects user experience, erecting barriers for new entrants. The combined approach anchors users in community while supplying endless variety, reinforcing engagement that underpins recurring revenue in the online fitness market.
Hybrid distribution further blurs boundaries as platforms schedule marquee live challenges and simultaneously populate on-demand modules that incorporate interactive features such as automated form cues. Emerging studios adopt cloud-based production tools that reduce capital expenditure, enabling boutique instructors to reach international markets. Monetization extends to micro-transactions around specialized masterclasses, providing incremental upside. Content localization, subtitle integration, and regional music licensing ensure relevance across cultures, underpinning adoption in high-growth Asia-Pacific segments of the online fitness market.


By Device Type: Mobile-First Scale and Multiscreen Continuity
Smartphones dominated 48.22% of streaming revenue in 2025 and grow at 32.09% CAGR because nearly every adult user already carries the required hardware. The camera supports computer-vision posture analysis while accelerometers record movement for real-time feedback. Paired wearables supply heart-rate data, enabling dashboards that replicate traditional coaching metrics. Smart-TV usage rises as households outfit living rooms with larger screens that heighten immersion and foster family participation, though penetration lags smartphone ubiquity. Tablets carve out a middle ground, favored for portability and enhanced visibility during yoga and Pilates.
Developers now design fluid session-handoff, allowing commuters to preview classes on phones and resume on big screens at home, reinforcing ecosystem lock-in across the online fitness market. Screen-agnostic frameworks minimize development complexities, while voice assistants streamline navigation for novice participants. Hardware convergence widens addressable demographics, welcoming users who lack discretionary spend for connected fitness gear yet still seek guided routines.
By Revenue Model: Balancing Predictability and Reach
Subscriptions supplied 77.95% of top-line revenue in 2025, offering forecastable cash flows that finance content production and platform enhancement across the online fitness market. Churn mitigation dictates continuous feature releases, community challenges, and loyalty rewards. Freemium tiers disrupt acquisition economics by removing paywalls, then upselling personalized coaching, advanced analytics, and community privileges. Growth at 36.68% CAGR in hybrid models highlights user appetite for trial before commitment.
Corporate sponsorships and insurance rebates add B2B2C funnels, lowering effective price points for end users and diversifying revenue concentration risk. Advertisement-supported variants remain niche because immersive workouts cannot tolerate mid-session interruptions, though select partnerships with health food or sports apparel brands deliver contextually aligned placements.
By End User: Evolving Buyer Personas
Individual consumers contributed 63.88% of 2025 receipts, anchoring platform scale and driving algorithm training data for personalized recommendations. Engagement thrives on social challenges, progression badges, and flexible class lengths that accommodate varied schedules. Corporate and payer cohorts, while smaller, register 31.07% CAGR because employers increasingly tie wellness metrics to medical-cost management. Wearable distribution programs capture biometric data that feeds into analytics dashboards, demonstrating ROI to HR departments.
Studios and professional gyms extend in-person programming online, protecting customer relationships and expanding geographic reach. Educational institutions adopt digital conditioning modules to augment physical-education curricula and varsity training. These initiatives diversify the user base, de-risking reliance on a single demographic and embedding the online fitness market within broader health ecosystems.
Geography Analysis
North America retained leadership with 41.25% of 2025 revenue, supported by high disposable income, premium pricing tolerance, and widespread broadband. Platforms collaborate with healthcare providers to integrate tele-rehab protocols, leveraging favorable reimbursement frameworks. Privacy regulation remains stringent, yet mature compliance capabilities give established brands a competitive moat. Corporate wellness adoption is mainstream; over half of Fortune 500 employers subsidize connected fitness subscriptions, sustaining predictable demand.
Asia-Pacific propels overall growth, recording 30.17% CAGR through 2031. Smartphone penetration exceeds 1.1 billion units, and rising urban affluence boosts health spending. Local champions such as Keep expanded from 20 million to 300 million monthly users by deploying culturally relevant content, vernacular coaches, and flexible micro-payment models. Submarine cable investments and 5G rollout reduce latency, unlocking high-definition streaming even in second-tier cities. Nonetheless, digital-literacy disparities constrain rural uptake, prompting lightweight app versions that function offline and compress video streams, ensuring the online fitness market serves broad income strata.
Europe, the Middle East, and Africa present a mosaic of infrastructure maturity and regulatory frameworks. Western European consumers prioritize data security and transparent consents, aligning with GDPR requirements. Middle Eastern markets demonstrate rising gym culture and disposable income, supporting premium VR-enabled offerings. Africa shows long-run potential; mobile-first strategies thrive where fixed-line broadband remains scarce. International platforms partner with telecom operators to bundle affordable subscription packages, stimulating adoption while addressing bandwidth sensitivity in the online fitness market.

Competitive Landscape
The sector remains fragmented as no single brand exceeds a 10% global revenue share, allowing agile challengers to flourish. The 2025 merger of Orangetheory and Self Esteem Brands created Purpose Brands, a USD 3.5 billion enterprise with 7,000 sites that now leverages omnichannel distribution to blend studio classes with proprietary streaming. Peloton works to stabilize revenue after a 9% year-over-year decline to USD 674 million by cutting operational costs and refreshing content. AI-first entrants such as Coachify AI capture niche communities through adaptive programming that recalibrates intensity and exercise selection in real time.
Strategic alliances intensify: Precor’s agreement to embed Nike Strength classes into cardio equipment embeds content directly onto commercial gym floors, blurring digital-physical boundaries. Hardware makers integrate third-party platforms, expanding addressable bases without building expensive content studios. Venture funding gravitates toward startups developing computer vision form correction and VR immersion, signaling investor conviction in experiential differentiation. Retention remains the key battleground inside the online fitness market; leaders deploy social features, adaptive challenges, and loyalty rewards to counter high churn.
Online Fitness Industry Leaders
Peloton Interactive
Apple Inc.
ClassPass
Fitbit
Les Mills International
- *Disclaimer: Major Players sorted in no particular order

Recent Industry Developments
- June 2025: Purpose Brands, born from the Orangetheory and Self Esteem Brands merger, appointed Tom Leverton as CEO and targets 10,000 locations within five years Health Club Management.
- April 2025: Flykitt introduced Flykitt Fit, a mobile-first guided-workout service for travelers and commuters Fitt Insider.
- March 2025: Airtel activated its 2Africa Pearls submarine cable offering 100 Tbps capacity, improving connectivity for Indian enterprises Network World.
- February 2025: Peloton posted Q2 2025 revenue of USD 674 million and named Peter Stern as CEO, focusing on cost optimization CNBC.


Research Methodology Framework and Report Scope
Market Definitions and Key Coverage
Our study defines the online fitness market as all fee-generating, internet-delivered fitness experiences, live-streamed classes, on-demand workouts, app-based training plans, and corporate wellness portals, consumed via smartphones, smart-TVs, laptops, or wearables.
Scope exclusion: Connected hardware sales and stand-alone nutrition apps are kept outside the value pool, so revenue reflects content and service access only.
Segmentation Overview
- By Streaming Type
- Live
- On-Demand
- By Device Type
- Smart TVs
- Smartphones
- Laptops and Desktops
- Tablets and Others
- By Revenue Model
- Subscription
- Advertisement-supported
- Hybrid / Freemium
- By End User
- Individuals
- Professional Gyms and Studios
- Corporate and Insurance-sponsored
- Educational / Sports Institutes
- By Geography
- North America
- United States
- Canada
- Mexico
- South America
- Brazil
- Argentina
- Rest of South America
- Europe
- United Kingdom
- Germany
- France
- Italy
- Spain
- Russia
- Rest of Europe
- Asia-Pacific
- China
- India
- Japan
- South Korea
- Australia and New Zealand
- Southeast Asia
- Rest of Asia-Pacific
- Middle East and Africa
- Middle East
- Saudi Arabia
- United Arab Emirates
- Turkey
- Rest of Middle East
- Africa
- South Africa
- Nigeria
- Kenya
- Rest of Africa
- Middle East
- North America
Detailed Research Methodology and Data Validation
Primary Research
Mordor analysts interviewed studio owners in the United States, HR heads running Asia-Pacific wellness programs, insurers in Europe, and app developers across Latin America. Dialogues validated pay-point thresholds, typical class completion rates, and regional content preferences that secondary data often mask.
Desk Research
We began with trade statistics and lifestyle surveys from agencies such as the WHO, CDC, Eurostat, and India's MoHFW to size addressable health-aware populations. Consumer spend benchmarks were pulled from credit-card datasets and industry association factsheets, while patent filings on AI-driven coaching were screened through Questel. Company 10-Ks, investor decks, and mainstream press provided pricing ladders and churn ratios that desk inputs alone could not reveal.
Subscription counts from app-store rankings, shipment logs for VR headsets (Volza), and workout video upload volumes rounded out demand signals. These sources are illustrative, not exhaustive; many additional references informed data checks and narrative clarity.
Market-Sizing & Forecasting
A top-down model converts population-level fitness engagement and broadband penetration into a paying-user pool, which is then stress-tested through sampled ASP x subscriber roll-ups from leading platforms. Key variables include smartphone install base growth, average session minutes, corporate wellness stipend uptake, 5G coverage, and churn curves. Forecasts employ multivariate regression with scenario analysis, letting us flex price and retention assumptions while anchoring volumes on consensus demographic shifts. Bottom-up checks from supplier revenue were used to close data gaps where disclosure was partial.
Data Validation & Update Cycle
Outputs pass two analyst reviews, variance thresholds trigger re-contacts, and models are refreshed every twelve months or sooner if major funding or regulatory shocks occur. A final pre-publication sweep ensures clients receive the latest view.
Why Our Online Fitness Baseline Commands Reliability
Published numbers often differ because firms pick unique service scopes, currencies, and update cadences before scaling today's users into tomorrow's revenue.
Key gap drivers include whether hardware sales are bundled, if free-tier users are monetized through ad impressions, currency conversion timing, and the rigor with which churn is factored into lifetime value.
Benchmark comparison
| Market Size | Anonymized source | Primary gap driver |
|---|---|---|
| USD 28.89 B (2025) | Mordor Intelligence | - |
| USD 25.22 B (2024) | Global Consultancy A | excludes corporate wellness portals; assumes uniform ARPU across regions |
| USD 14.90 B (2022) | Industry Association B | older base year and no adjustment for post-pandemic retention rebound |
In short, Mordor's disciplined scope, annually refreshed inputs, and dual-path validation produce a balanced baseline that decision-makers can trace back to clear variables and repeatable steps.


Key Questions Answered in the Report
What is the current valuation of the online fitness market?
The online fitness market is valued at USD 36.64 billion in 2026.
How fast is the online fitness market expected to grow?
The market is forecast to expand at a 26.82% CAGR, reaching USD 120.13 billion by 2031.
Which streaming format is expanding the quickest?
On-Demand content shows the highest growth at a 35.59% CAGR through 2031.
Why are corporate wellness programs important for market growth?
Employers subsidize subscriptions to control medical costs and improve productivity, driving a 31.07% CAGR in corporate and insurance-sponsored users.
Page last updated on:


