Virtual Extensible LAN Market Size and Share
Market Overview
| Study Period | 2019 - 2030 |
|---|---|
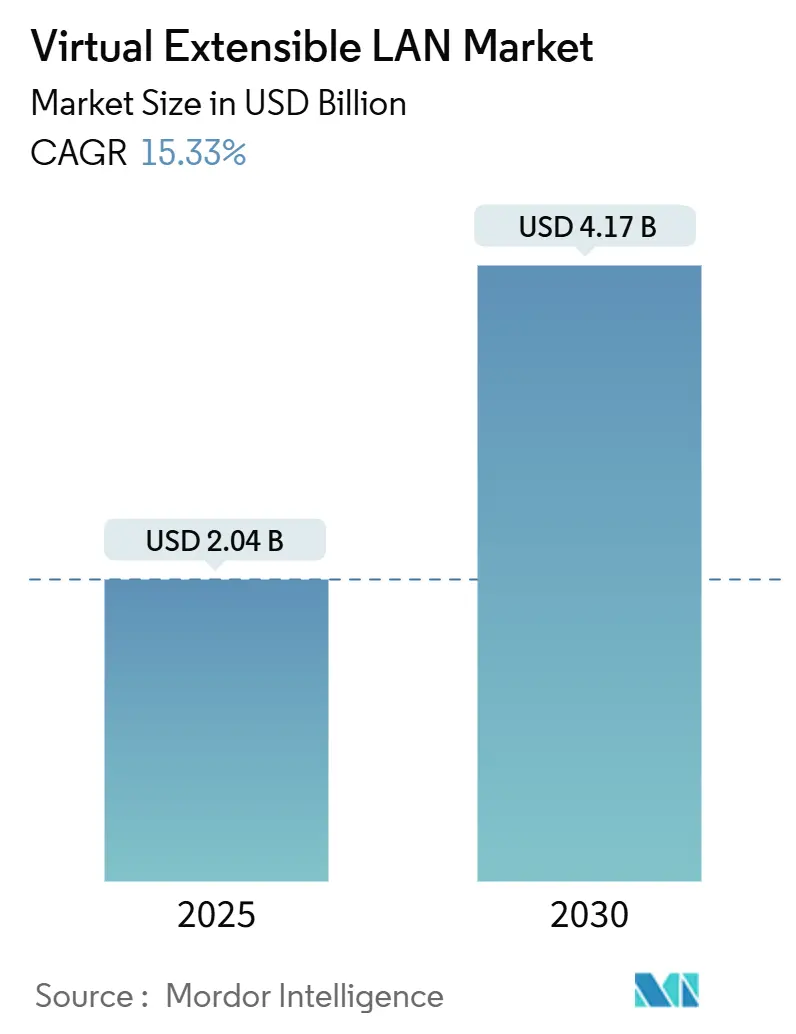
| Market Size (2025) | USD 2.04 Billion |
| Market Size (2030) | USD 4.17 Billion |
| Growth Rate (2025 - 2030) | 15.33% CAGR |
| Fastest Growing Market | Asia Pacific |
| Largest Market | North America |
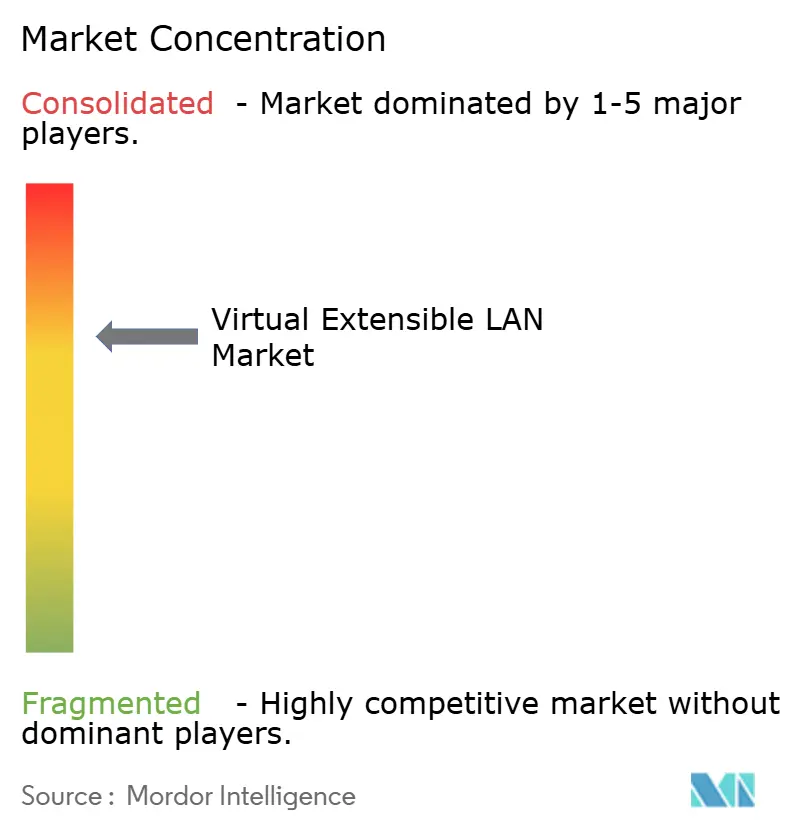
| Market Concentration | Medium |
Major Players *Disclaimer: Major Players sorted in no particular order Image © Mordor Intelligence. Reuse requires attribution under CC BY 4.0. | |
Virtual Extensible LAN Market Analysis by Mordor Intelligence
The Virtual Extensible LAN market size stands at USD 2.04 billion in 2025 and is forecast to reach USD 4.17 billion by 2030, reflecting a 15.33% CAGR. Rapid AI/ML workload growth, hybrid-cloud migrations, and 400/800 GbE fabric upgrades continue to widen the technology’s footprint across data-center, campus, and service-provider domains. Vendor focus on zero-trust segmentation, coupled with government mandates for encrypted multi-tenant overlays, sustains long-term demand. Telecom open-BNG rollouts and FTTH expansion bring new subscriber-isolation use cases, while industrial Ethernet’s move toward Time-Sensitive Networking (TSN) unlock opportunities in manufacturing automation. Competitive intensity remains moderate; incumbents emphasize control-plane automation and multi-cloud orchestration to counter white-box and open-source alternatives.
Key Report Takeaways
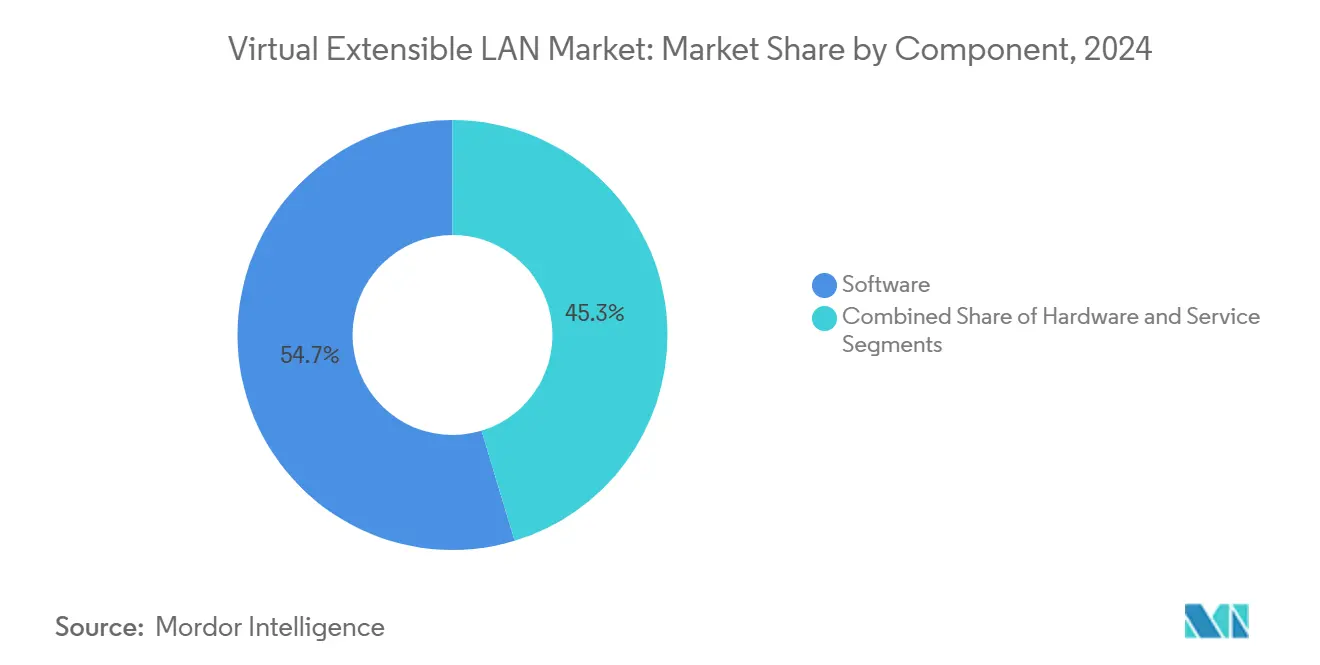
- By component, software captured 54.68% of the Virtual Extensible LAN market share in 2024, while services are advancing at a 15.89% CAGR to 2030.
- By deployment mode, cloud-based models held 58.73% of the Virtual Extensible LAN market size in 2024 and are projected to expand at a 15.97% CAGR through 2030.
- By organization size, large enterprises accounted for 69.71% of demand in 2024; SMEs recorded the fastest growth at 16.43% CAGR to 2030.
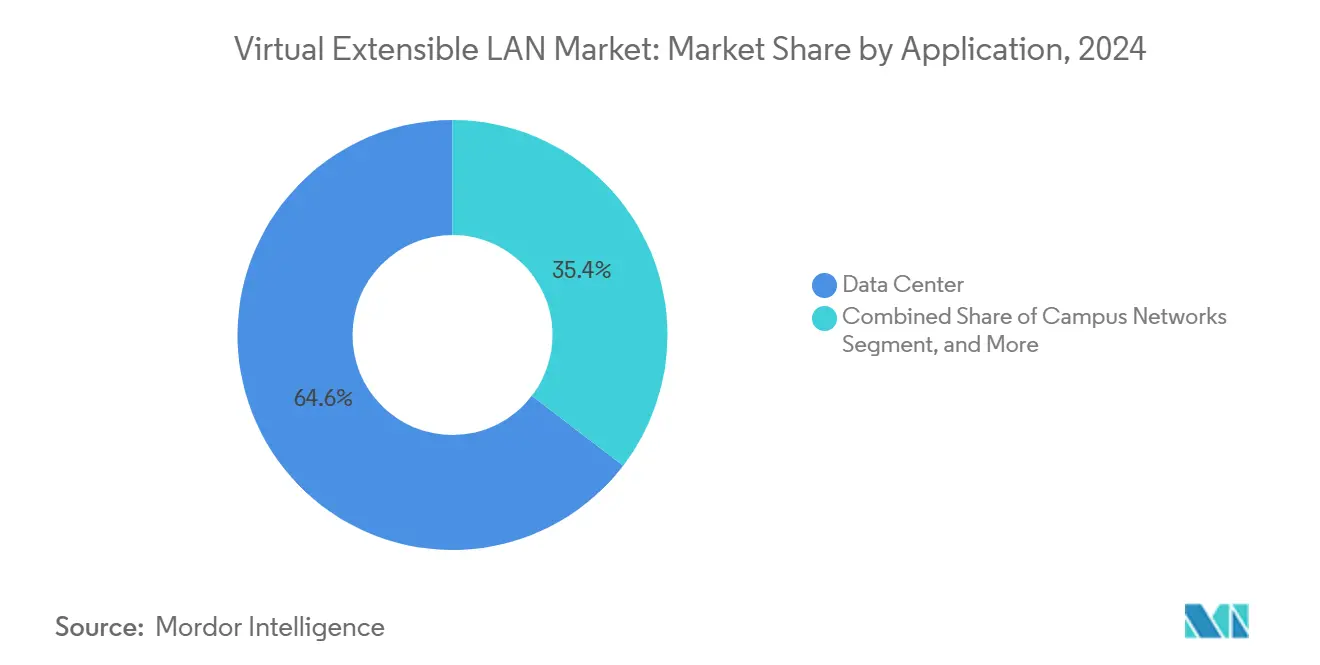
- By application, data centers commanded 64.59% of the Virtual Extensible LAN market size in 2024, whereas campus networks are growing at a 15.41% CAGR through 2030.
- By end-user vertical, IT and telecom retained a 39.81% share in 2024; BFSI is forecast to expand at a 15.68% CAGR to 2030.
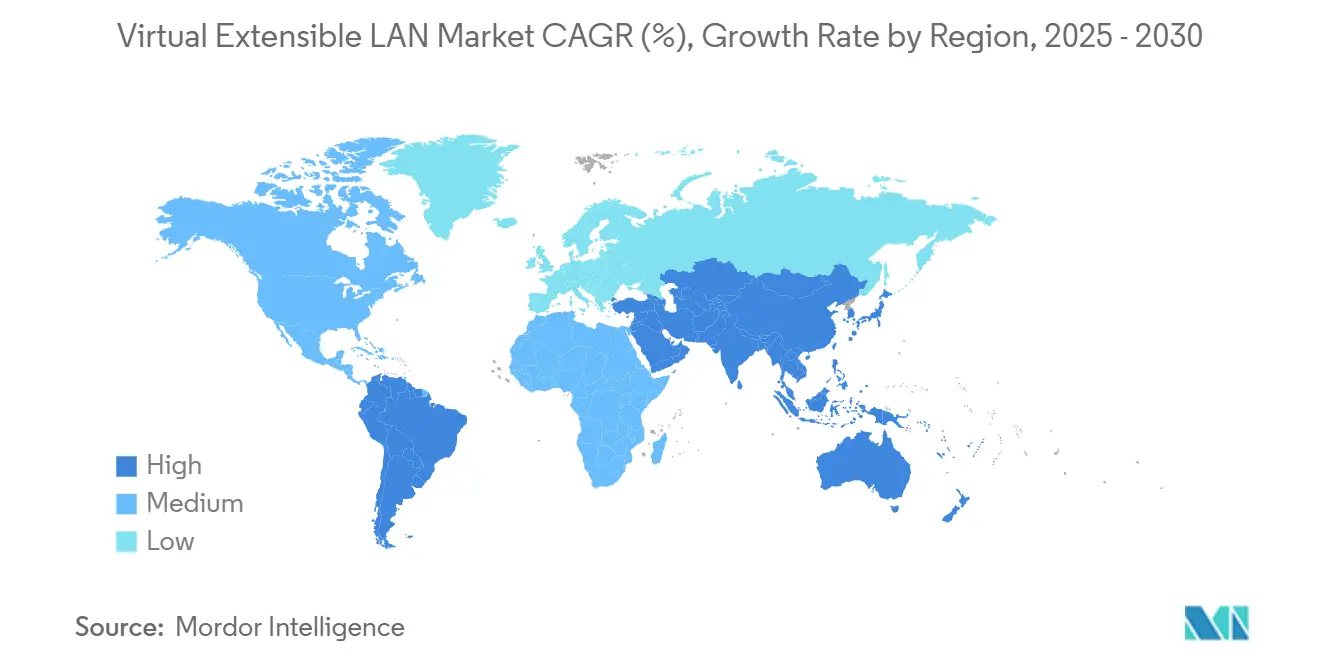
- By geography, North America led with 34.32% revenue share in 2024; Asia-Pacific is the fastest-growing region, rising at a 15.57% CAGR through 2030.
Global Virtual Extensible LAN Market Trends and Insights
Drivers Impact Analysis*
| Driver | (~) % Impact on CAGR Forecast | Geographic Relevance | Impact Timeline |
|---|---|---|---|
| Surge in multi-site DCI traffic volume post-AI/ML workload adoption | +3.2% | Global, concentrated in North America and Asia-Pacific | Medium term (2-4 years) |
| Rapid enterprise shift to overlay SDN for hybrid cloud migrations | +2.8% | North America and EU, expanding to Asia-Pacific | Short term (≤ 2 years) |
| Accelerated 400/800 GbE switch port shipments driving VXLAN refresh | +2.1% | Global, led by hyperscale data centers | Medium term (2-4 years) |
| Growing adoption of TSN in industrial Ethernet requiring L2-over-L3 segmentation | +1.9% | Asia-Pacific manufacturing hubs, Germany industrial corridors | Long term (≥ 4 years) |
| VXLAN-EVPN mandates in government zero-trust architectures | +1.7% | North America federal agencies, EU defense sectors | Medium term (2-4 years) |
| Telecom open-BNG and FTTH deployments adopting VXLAN for subscriber isolation | +1.6% | Asia-Pacific service providers, European fiber networks | Long term (≥ 4 years) |
| Source: Mordor Intelligence | |||
Surge in Multi-Site DCI Traffic Post-AI/ML Adoption
AI training clusters generate east-west traffic that exceeds 80% of total data-center bandwidth, a profile that stresses legacy VLAN designs. VXLAN overlays support 16.7 million virtual networks and maintain deterministic throughput across wide-area links, enabling geographically dispersed GPU farms to synchronize models efficiently. [1]NVIDIA Corp., “NVIDIA Completes Acquisition of Cumulus Networks,” nvidia.com U.S. retailers piloting edge inference rely on VXLAN micro-segmentation to secure distributed AI workloads without sacrificing centralized governance.
Rapid Enterprise Pivot to Overlay SDN for Hybrid Cloud
Hybrid-cloud migration often demands seamless L2 extension without re-architecting core IP routing. VXLAN’s decoupling of logical and physical topologies allows workloads to move among on-premises and public-cloud sites while preserving IP and MAC identities. [2]VMware, “Extending Network Virtualization to the Hybrid Cloud with NSX,” vmware.com European financial institutions cite smoother GDPR compliance via policy-driven workload placement across federated domains.
Accelerated 400/800 GbE Switch-Port Shipments
Broadcom Trident4 and Jericho2c silicon perform line-rate VXLAN encapsulation, shrinking provisioning time by up to 60% relative to software-only approaches. [3]Broadcom Inc., “Jericho2c and Trident4: Next-Generation Data-Center Switch ASICs,” broadcom.com Hyperscalers exploit 800 GbE uplinks to aggregate multiple overlays on fewer cables, lowering rack-to-rack latency and power budgets.
TSN Adoption in Industrial Ethernet
Industry 4.0 production lines depend on microsecond-level determinism. VXLAN, combined with IEEE 802.1Qbv scheduling, transports both control and best-effort traffic over converged infrastructure, keeping robotics and SCADA flows isolated yet synchronized. German automotive plants report reduced downtime during line re-configuration owing to overlay programmability.
Restraints Impact Analysis*
| Restraint | (~) % Impact on CAGR Forecast | Geographic Relevance | Impact Timeline |
|---|---|---|---|
| Complexity of large-scale VXLAN-EVPN control-plane design | -2.4% | Global, particularly affecting mid-market enterprises | Short term (≤ 2 years) |
| High CAPEX for 400 GbE capable spine-leaf fabrics | -1.8% | Cost-sensitive markets in Asia-Pacific and emerging economies | Medium term (2-4 years) |
| MAC table explosion risk in AI training clusters | -1.5% | North America and Asia-Pacific AI/ML deployment centers | Medium term (2-4 years) |
| Deterministic-latency gaps hindering ultra-low-latency trading adoption | -1.2% | Financial centers in New York, London, Tokyo, Singapore | Short term (≤ 2 years) |
| Source: Mordor Intelligence | |||
Complexity of Large-Scale VXLAN-EVPN Control-Plane Design
Enterprises scaling beyond a single site struggle with BGP-EVPN route-reflector hierarchies and convergence tuning. Skill shortages lead to extended roll-outs and greater dependence on managed services, adding operational expense. Interoperability gaps between vendor implementations heighten troubleshooting complexity during maintenance windows.
High CAPEX for 400 GbE Spine-Leaf Fabrics
A medium-scale fabric upgrade can surpass USD 10 million in hardware, optics, and structured cabling. Budget constraints postpone adoption for cost-sensitive operators even when performance gains are evident. Rising electricity prices further strain ROI models, particularly in emerging markets.
*Our forecasts treat driver/restraint impacts as directional, not additive. The impact forecasts reflect baseline growth, mix effects, and variable interactions.
Segment Analysis
By Component: Software Dominance Amid Services Uptick
Software platforms retained a 54.68% share of the Virtual Extensible LAN market in 2024 as enterprises favored agile update cycles and hardware-agnostic deployment. Professional-services revenue is rising at a 15.89% CAGR to 2030 as organizations outsource design, automation, and compliance auditing.
Vendor roadmaps emphasize AI-assisted configuration and intent-based policy engines that demystify EVPN route propagation. Large enterprises continue blending software licenses with consulting packages, whereas SMEs lean toward fully managed subscriptions that mask underlying complexity. The shift enhances recurring revenue for vendors and MSPs alike.


By Deployment Mode: Cloud-Based Models Accelerate Adoption
Cloud-based options accounted for 58.73% of the Virtual Extensible LAN market share in 2024 and exhibit a 15.97% CAGR through 2030. OPEX-centric consumption aligns with DevOps release cycles and sidesteps capital spending hurdles.
Financial services and federal customers still retain on-premises fabric elements to satisfy data sovereignty mandates, but increasingly leverage SaaS-based controllers for global policy orchestration. Vendors now bundle API-driven overlays with marketplace licensing, catalyzing uptake in developer-led environments.
By Organization Size: SME Momentum Signals Democratization
Large enterprises generated 69.71% of 2024 revenue, yet SMEs posted the highest CAGR at 16.43% to 2030. Low-touch deployment wizards, templated compliance profiles, and MSP offerings reduce entry barriers.
SMEs commonly deploy overlays to segment IoT traffic from core business systems in a single step, avoiding forklift upgrades. For multinationals, overlays remain key to multi-tenant isolation across dozens of campuses, disaster-recovery sites, and public-cloud regions.
By Application: Campus Networks Emerge Beyond Data Centers
Data-center environments still represent 64.59% of the Virtual Extensible LAN market size, but campus networks are expanding fastest at 15.41% CAGR. Unified overlay fabrics let IT teams enforce zero-trust micro-segmentation from wired to Wi-Fi edge while retaining centralized visibility.
Service-provider deployments track steady demand as open-BNG projects and 5G core modernization adopt VXLAN for subscriber isolation. Edge computing nodes increasingly use overlays to dispatch AI inference workloads close to users while maintaining policy consistency with central sites.
By End-User Vertical: BFSI Registers Highest Growth
IT and telecom held 39.81% revenue share in 2024. BFSI, however, is projected to grow at a 15.68% CAGR on the back of regulatory audit trails, latency-sensitive trading, and zero-trust mandates.
Government agencies press ahead with classified-network segmentation standards built around EVPN overlays, whereas manufacturing focuses on TSN-enabled robotics in Industry 4.0 plants. Healthcare deployments concentrate on HIPAA-driven patient-data isolation and tele-health scalability.
Geography Analysis
North America contributed 34.32% of 2024 revenue owing to early hybrid-cloud adoption and federal zero-trust directives that reference VXLAN-EVPN as a micro-segmentation baseline. U.S. hyperscalers drive 400 GbE refresh cycles that spill over into enterprise best practices, while Canadian operators prioritize data-sovereignty controls when extending overlays across borders.
Asia-Pacific is the fastest-growing territory with a 15.57% CAGR through 2030. Chinese smart-city pilots integrate VXLAN into converged metro fabrics to segregate utility, surveillance, and consumer traffic. Japanese precision-manufacturing firms deploy TSN-compatible overlays that safeguard deterministic robotics operations. Southeast-Asian telcos leverage VXLAN for subscriber isolation as fiber rollouts accelerate.
Europe maintains steady uptake guided by GDPR and industrial-automation imperatives. German auto-makers use converged overlays to transport both OT and IT traffic without duplicating infrastructure. U.K. financial centers value deterministic-latency overlays for algorithmic trading, while Nordic public clouds promote carbon-efficient fabrics that couple VXLAN segmentation with renewable-energy datacenters.

Competitive Landscape
The Virtual Extensible LAN market remains moderately concentrated. Cisco, VMware, and Arista anchor portfolios with integrated SDN controllers, analytics, and threat-containment add-ins. Cisco’s USD 610 million Viptela acquisition and VMware’s USD 1.26 billion Nicira purchase set consolidation precedents.
Juniper’s 128 Technology integration extends session-smart routing into overlay fabrics, emphasizing deterministic path selection. Extreme Networks and Dell Technologies differentiate via fabric-wide automation targeting mid-market users. Hewlett Packard Enterprise’s Aruba unit embeds cloud-native management to unify wired, wireless, and WAN domains.
Open-source projects-coupled with white-box hardware-exert pricing pressure, yet their adoption remains niche due to support and compliance gaps. Strategic partnerships between vendors and hyperscale clouds dictate new go-to-market models, bundling overlay controllers as marketplace-deployable services that ease hybrid integration.
Virtual Extensible LAN Industry Leaders
Cisco Systems, Inc.
Arista Networks, Inc.
Juniper Networks, Inc.
VMware, Inc.
Huawei Technologies Co., Ltd.
- *Disclaimer: Major Players sorted in no particular order

Recent Industry Developments
- August 2025: Juniper Networks finalized the integration of 128 Technology’s SD-WAN stack with VXLAN capabilities to deliver session-aware overlays across campus and branch environments.
- June 2025: Cato Networks secured USD 359 million Series G financing to expand its SASE platform’s VXLAN-based segmentation at enterprise edge sites.
- May 2025: Motorola Solutions acquired Silvus Technologies to infuse VXLAN micro-segmentation into tactical communications for defense customers.
- April 2025: FatPipe Networks completed an IPO aimed at scaling SD-WAN offerings that embed VXLAN tunneling for hybrid-cloud workloads.


Global Virtual Extensible LAN Market Report Scope
| Hardware |
| Software |
| Services |
| On-premises |
| Cloud-based |
| Large Enterprises |
| Small and Medium-sized Enterprises (SMEs) |
| Data Center |
| Campus Networks |
| Service-Provider Networks |
| Remote / Edge Sites |
| IT and Telecommunications |
| Banking, Financial Services and Insurance (BFSI) |
| Government and Defense |
| Healthcare |
| Retail and E-commerce |
| Manufacturing |
| North America | United States | |
| Canada | ||
| Mexico | ||
| Europe | Germany | |
| United Kingdom | ||
| France | ||
| Russia | ||
| Rest of Europe | ||
| Asia-Pacific | China | |
| Japan | ||
| India | ||
| South Korea | ||
| Australia | ||
| Rest of Asia-Pacific | ||
| Middle East and Africa | Middle East | Saudi Arabia |
| United Arab Emirates | ||
| Rest of Middle East | ||
| Africa | South Africa | |
| Egypt | ||
| Rest of Africa | ||
| South America | Brazil | |
| Argentina | ||
| Rest of South America | ||
| By Component | Hardware | ||
| Software | |||
| Services | |||
| By Deployment Mode | On-premises | ||
| Cloud-based | |||
| By Organization Size | Large Enterprises | ||
| Small and Medium-sized Enterprises (SMEs) | |||
| By Application | Data Center | ||
| Campus Networks | |||
| Service-Provider Networks | |||
| Remote / Edge Sites | |||
| By End-User Vertical | IT and Telecommunications | ||
| Banking, Financial Services and Insurance (BFSI) | |||
| Government and Defense | |||
| Healthcare | |||
| Retail and E-commerce | |||
| Manufacturing | |||
| By Geography | North America | United States | |
| Canada | |||
| Mexico | |||
| Europe | Germany | ||
| United Kingdom | |||
| France | |||
| Russia | |||
| Rest of Europe | |||
| Asia-Pacific | China | ||
| Japan | |||
| India | |||
| South Korea | |||
| Australia | |||
| Rest of Asia-Pacific | |||
| Middle East and Africa | Middle East | Saudi Arabia | |
| United Arab Emirates | |||
| Rest of Middle East | |||
| Africa | South Africa | ||
| Egypt | |||
| Rest of Africa | |||
| South America | Brazil | ||
| Argentina | |||
| Rest of South America | |||


Key Questions Answered in the Report
How large is the Virtual Extensible LAN market in 2025?
The Virtual Extensible LAN market size is valued at USD 2.04 billion in 2025.
What CAGR is expected for Virtual Extensible LAN solutions through 2030?
The market is projected to expand at a 15.33% CAGR from 2025 to 2030.
Which region is growing fastest for VXLAN deployments?
Asia-Pacific leads growth with a 15.57% CAGR driven by manufacturing automation and telco virtualization projects.
Which application segment shows the highest momentum beyond data centers?
Campus-network deployments record the fastest growth, advancing at a 15.41% CAGR through 2030.
Why are services revenue accelerating in this space?
Rising VXLAN complexity prompts enterprises to engage managed-services providers, resulting in a 15.89% CAGR for services.
What is a primary restraint inhibiting wider adoption?
High CAPEX for 400 GbE-ready spine-leaf fabrics limits deployments in budget-constrained markets.
Page last updated on:


