Software-Defined Wide Area Network Market Size and Share
Market Overview
| Study Period | 2020 - 2031 |
|---|---|
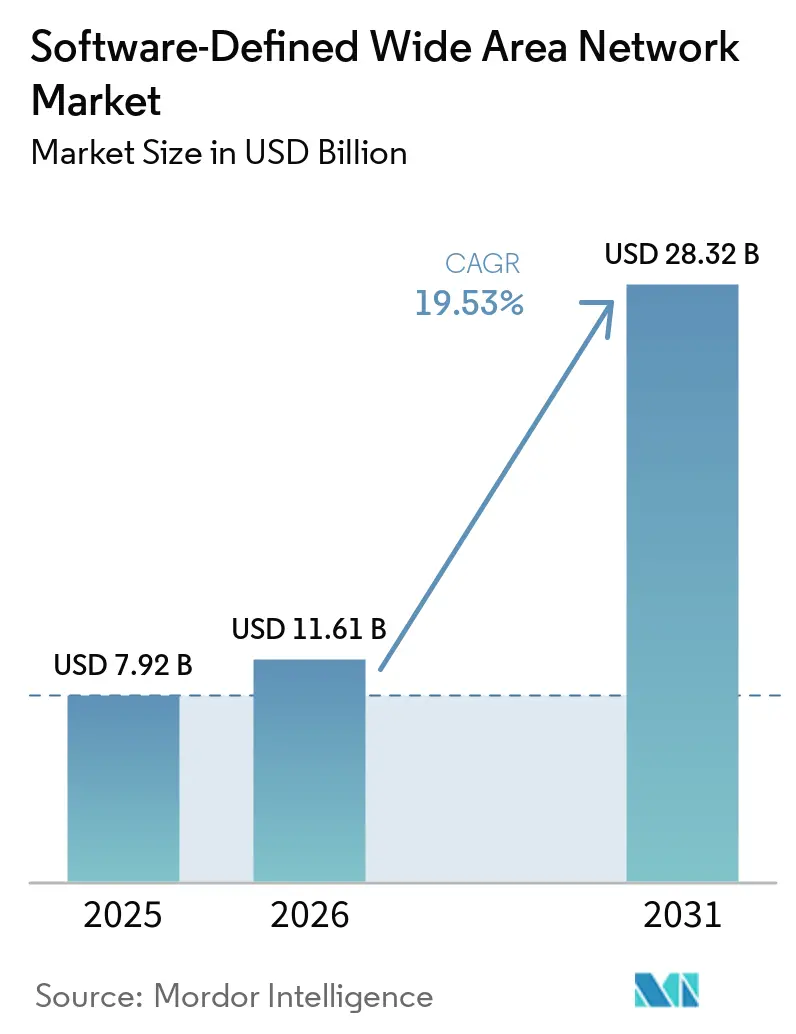
| Market Size (2026) | USD 11.61 Billion |
| Market Size (2031) | USD 28.32 Billion |
| Growth Rate (2026 - 2031) | 19.53% CAGR |
| Fastest Growing Market | Asia Pacific |
| Largest Market | North America |
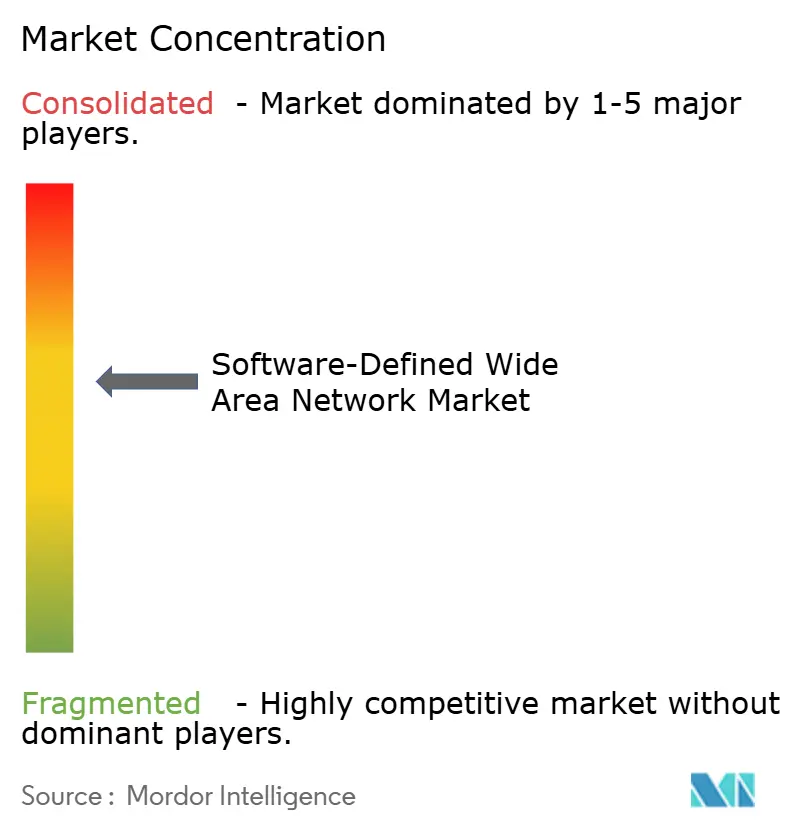
| Market Concentration | Medium |
Major Players *Disclaimer: Major Players sorted in no particular order Image © Mordor Intelligence. Reuse requires attribution under CC BY 4.0. | |
Software-Defined Wide Area Network Market Analysis by Mordor Intelligence
The Software-Defined Wide Area Network Market size is expected to grow from USD 7.92 billion in 2025 to USD 11.61 billion in 2026 and is forecast to reach USD 28.32 billion by 2031 at 19.53% CAGR over 2026-2031.
The acceleration reflects enterprises retiring MPLS circuits in favor of software-defined overlays that flexibly steer traffic across broadband, 5G, and direct internet access paths. Bandwidth can now scale in hours rather than months, supporting cloud-centric application architectures, real-time collaboration suites, and hybrid work patterns that demand low-latency links to every edge location. Early SASE adoption in North America, government-funded digital infrastructure in Asia-Pacific, and GDPR-driven data-sovereignty requirements in Europe shape regional growth trajectories. Competition remains moderate, with incumbents augmenting product lines through acquisitions while cloud-native specialists differentiate on AI-powered route optimization and zero-touch provisioning.
Key Report Takeaways
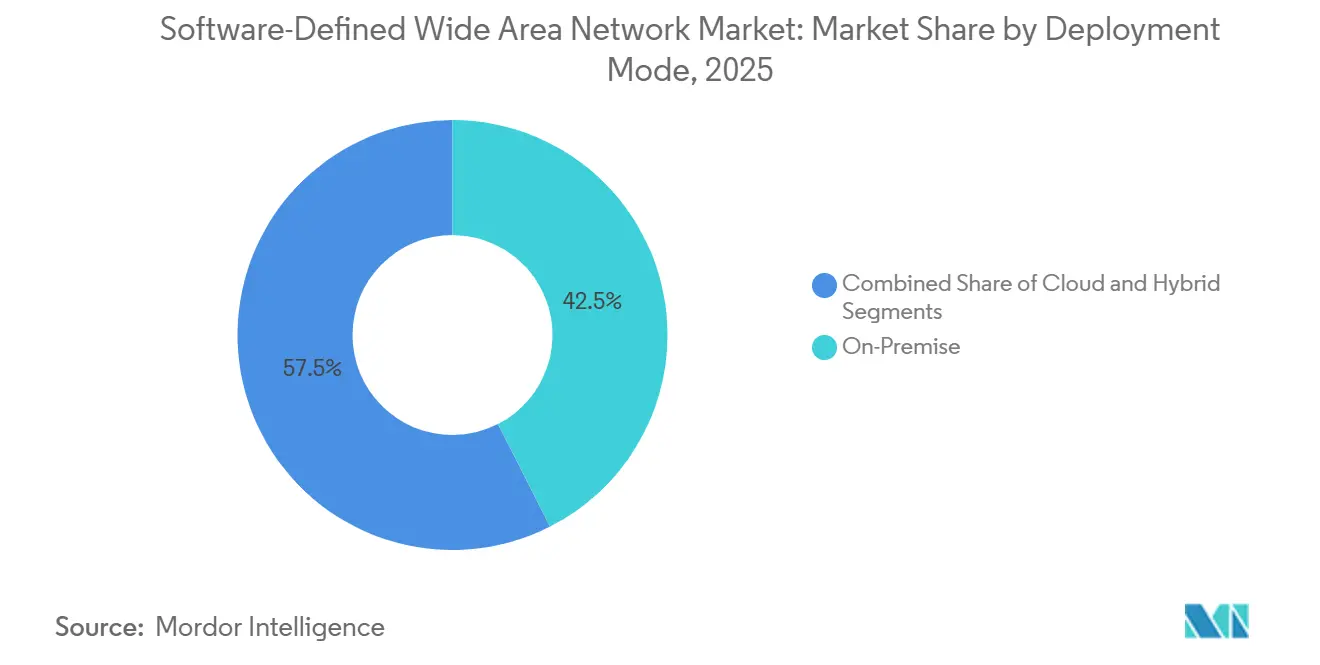
- By deployment mode, on-premises configurations led with a 42.50% revenue share in 2025 in the software-defined wide area network market, while cloud deployments are forecast to grow at a 25.50% CAGR from 2026 to 2031.
- By component, solutions accounted for 54.60% of the 2025 total, whereas services are projected to register a 21.16% CAGR through 2031.
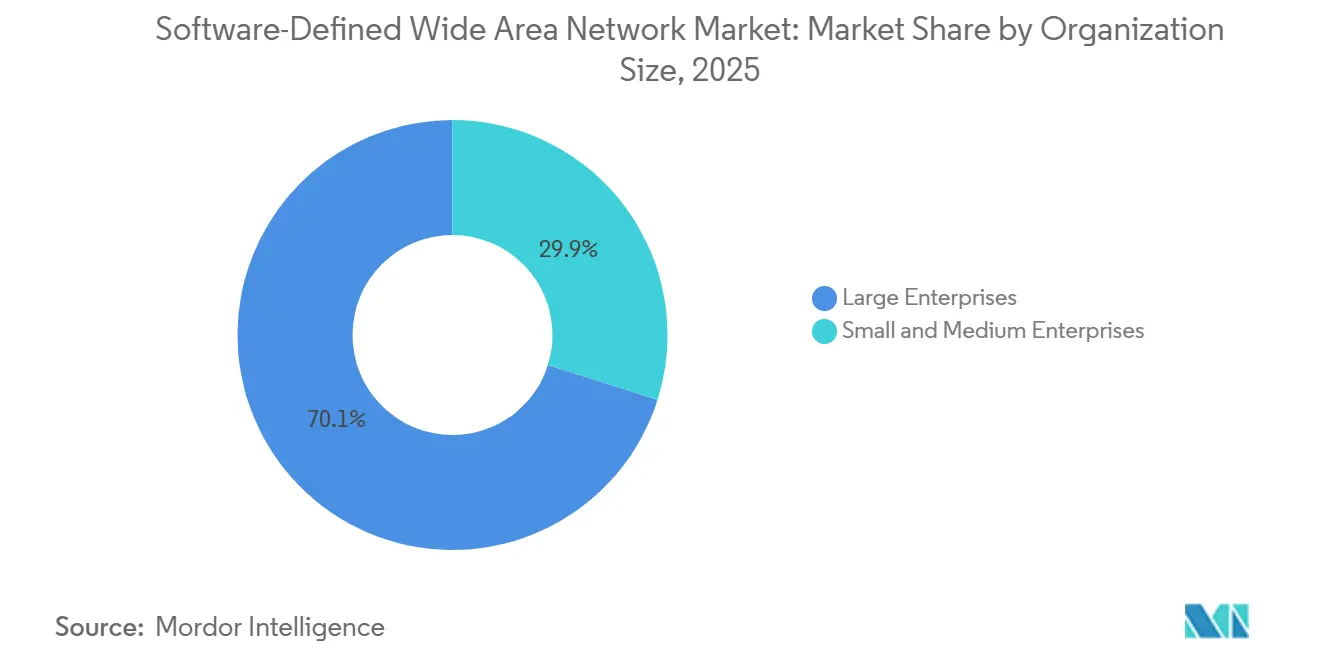
- By organization size, large enterprises accounted for 70.14% of 2025 spending, yet small and medium enterprises are expected to grow at a 20.15% CAGR between 2026 and 2031.
- By end-user industry, IT and telecom captured 25.99% of the revenue share in 2025, while retail and consumer services are poised to expand at a 28.40% CAGR to 2031.
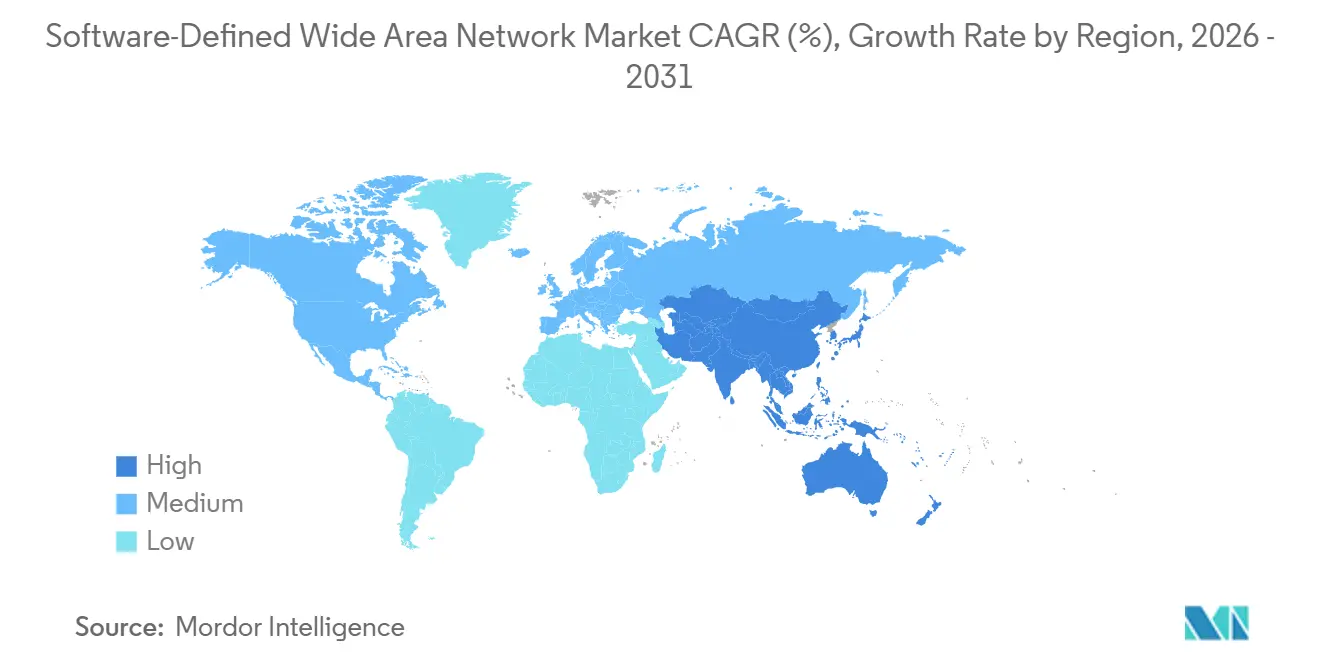
- By geography, North America accounted for 41.20% of the 2025 SD-WAN market share, whereas Asia-Pacific is anticipated to grow the fastest at a 29.90% CAGR through 2031.
Note: Market size and forecast figures in this report are generated using Mordor Intelligence’s proprietary estimation framework, updated with the latest available data and insights as of January 2026.
Global Software-Defined Wide Area Network Market Trends and Insights
Drivers Impact Analysis*
| Driver | (~) % Impact on CAGR Forecast | Geographic Relevance | Impact Timeline |
|---|---|---|---|
| Cloud-Centric Application Explosion | +5.2% | Global, strongest in North America and Asia-Pacific | Medium term (2-4 years) |
| Hybrid/Remote-Work-Driven WAN Agility | +4.8% | Global, particularly North America and Europe | Short term (≤2 years) |
| MPLS Cost-Out and Bandwidth Optimization | +3.9% | Global, emphasis in Asia-Pacific and South America | Medium term (2-4 years) |
| 5G Network Slicing and SD-WAN Convergence | +3.1% | Asia-Pacific core, spillover to Middle East and North America | Long term (≥4 years) |
| AI-Driven Self-Healing Route Optimization | +1.8% | North America and Europe early adopters, expanding globally | Medium term (2-4 years) |
| ESG-Linked Carbon-Aware Routing Demand | +0.7% | Europe and North America | Long term (≥4 years) |
| Source: Mordor Intelligence | |||
Cloud-centric Application Explosion
Nearly 65% of enterprise workloads had shifted to public or hybrid cloud platforms by 2025, exposing the latency penalties of hub-and-spoke WAN topologies. SD-WAN overlays enable direct internet breakout at branch locations, shaving seconds off application response times for Microsoft 365, Dynamics 365, and other SaaS suites. Azure ExpressRoute ports integrated with SD-WAN gateways grew 43% year over year, illustrating demand for deterministic cloud paths. Multi-cloud strategies spanning Amazon Web Services, Google Cloud, and Oracle Cloud intensify the need for dynamic path steering. Enterprises report up to 40% faster page loads after deployment, turning network performance into a competitive differentiator.
Hybrid/Remote-work–driven WAN Agility
Remote employees working three or more days off-site stabilized at 38% in 2025, cementing hybrid work as a permanent operating model. SD-WAN platforms equipped with integrated firewalls, intrusion prevention, and secure web gateways enforce uniform security posture from headquarters to home offices. Cisco recorded 31% growth in Meraki SD-WAN subscriptions during 2025 as customers consolidated point tools into unified policies[1]Source: Cisco Systems, “Annual Report 2025,” CISCO.COM. Zero-trust frameworks that continuously verify user identity, device posture, and application context further amplify adoption, especially in financial services with stringent latency and compliance needs.
MPLS Cost-out and Bandwidth Optimisation
Global MPLS pricing averaged USD 450 per Mbps per month for international links in 2025, contrasting sharply with USD 12 per Mbps for broadband internet. Hybrid transport designs use SD-WAN to reserve MPLS for mission-critical traffic while shifting bulk data transfers to lower-cost circuits, trimming total WAN outlays by 30-50%. Verizon’s managed SD-WAN bookings climbed 27% even as legacy private-line revenue fell 12%. The cost delta is most compelling in emerging markets, where MPLS premiums eclipse 200%, spurring retail chains to dual-home stores on broadband pairs that auto-failover in outages.
5G Network Slicing and SD-WAN Convergence
By late 2025, 47 countries had launched 5G standalone cores capable of network slicing. SD-WAN controllers increasingly consume slice APIs to guarantee latency for industrial automation, tele-surgery, and autonomous vehicles. AT&T’s Network Edge platform combined 5G slicing with SD-WAN at 150 enterprise sites, enabling augmented-reality training and real-time inventory views. China Mobile logged 8,200 private 5G networks, many meshed by SD-WAN gateways to cloud analytics. The union of deterministic wireless slices and application-aware overlays closes gaps in best-effort internet transport.
Restraints Impact Analysis*
| Restraint | (~) % Impact on CAGR Forecast | Geographic Relevance | Impact Timeline |
|---|---|---|---|
| Data-Plane Security and Control-Plane Attacks | -2.3% | Global, heightened in North America and Europe | Short term (≤2 years) |
| Shortage of SD-WAN Architecture Talent | -1.7% | Global, acute in Asia-Pacific and South America | Medium term (2-4 years) |
| Proprietary Overlay Lock-In Risks | -1.1% | Global multi-vendor environments | Medium term (2-4 years) |
| CPE Supply-Chain Bottlenecks | -0.8% | Global, tied to semiconductor availability | Short term (≤2 years) |
| Source: Mordor Intelligence | |||
Data-Plane Security and Control-Plane Attack Surface
Cloud-hosted SD-WAN controllers centralize orchestration, creating high-value targets. A March 2025 advisory from the U.S. Cybersecurity and Infrastructure Security Agency warned that compromised controllers could reroute traffic, disable encryption, or inject malicious advertisements. Proof-of-concept exploits demonstrated at Black Hat exposed misconfigured APIs granting attackers topology maps and keys. Regulated sectors such as healthcare and defense slowed rollouts pending FedRAMP and HIPAA audits, while adopters segment control-plane traffic and require multi-factor authentication, extending deployment timelines.
Shortage of SD-WAN Architecture Talent
The industry faced roughly 85,000 unfilled SD-WAN engineering roles worldwide in 2025. Traditional routing curricula lag the software-defined shift, forcing enterprises to rely on vendor professional services. Fortinet certified 12,000 engineers on its platform, yet demand still eclipsed supply. Skills gaps extend to telemetry analytics required for ongoing optimization, pushing SMEs toward managed services that trade flexibility for simplicity. The shortage is expected to persist through 2027, tempering adoption among mid-market organizations.
*Our forecasts treat driver/restraint impacts as directional, not additive. The impact forecasts reflect baseline growth, mix effects, and variable interactions.
Segment Analysis
By Deployment Mode: Hybrid Models Bridge Compliance and Agility
On-premises deployments held the largest 2025 position, capturing 42.50% of the SD-WAN market. Heavily regulated entities valued appliance-based control planes residing in owned data centers, aligning with GDPR and HIPAA sovereignty rules. Conversely, cloud deployments are forecast to climb at a 25.50% CAGR, propelled by mid-sized enterprises sidestepping capital purchases. The SD-WAN market size for cloud implementations is projected to expand from USD 4.94 billion in 2026 to USD 15.4 billion by 2031, underscoring the pivot toward consumption economics.
Hybrid architecture blends on-premises sovereignty with cloud scalability. VMware reported that 58% of 2025 adopters chose hybrid designs, citing performance-critical workloads that remain on-site while remote branches leverage SaaS-based orchestration[2]. As SASE convergence accelerates, cloud-native controllers infuse security services, nudging even conservative sectors toward hybrid adoption. The SD-WAN market repeatedly illustrates that deployment flexibility, rather than hardware ownership, now dictates architecture decisions.


By Component: Services Climb as Complexity Mounts
Solutions retained a 54.60% revenue share in 2025, spanning virtual appliances, perpetual licenses, and orchestration consoles. However, mounting integration demands are shifting budgets toward services, expected to post a 21.16% CAGR. Deloitte surveys showed 47% of enterprises outsourcing at least partial SD-WAN operations, driven by scarce internal expertise.
Professional services cover assessments, design, and proofs of concept, whereas managed services wrap transport, security, and monitoring into predictable OPEX. System integrators such as Accenture and Tata Consultancy Services now run multi-vendor SD-WAN centers of excellence, reducing overlay lock-in fears. As AI-based analytics mature, service providers differentiate by automating policy recommendations, reinforcing the gradual tilt of the SD-WAN market toward lifecycle partnerships.
By Organization Size: Simplified Consoles Unlock SME Demand
Large enterprises generated 70.14% of 2025 spending, reflecting thousands of branch sites and complex compliance mandates. Yet SMEs represent the fastest-growing cohort, advancing at a 20.15% CAGR through 2031. Feature-rich cloud consoles hide underlying routing complexity, enabling retailers, clinics, and franchises to deploy SD-WAN in days. Cisco Meraki added 22,000 SME customers in 2025, with typical rollouts covering eight sites.
The SD-WAN market size for SMEs is forecast to rise from USD 3.25 billion in 2026 to USD 8.15 billion by 2031. Bundled offerings that combine SD-WAN, firewall, and unified threat management lower procurement friction. Meanwhile, large enterprises continue to dominate absolute revenue thanks to requirements for multi-vendor interoperability, mainframe integration, and granular analytics that command premium pricing.
By End-User Industry: Retail Digitization Fuels Out-Sized Growth
IT and telecom firms commanded 25.99% of 2025 spending, leveraging SD-WAN to backhaul mobile network traffic, interconnect data centers, and deliver managed connectivity products. Retail and consumer services, though smaller today, are set to grow at a 28.40% CAGR as stores digitize customer journeys. Walmart deployed SD-WAN across 4,700 U.S. outlets, cutting network operating costs 35% while boosting application performance.
Healthcare, BFSI, manufacturing, and transport each exhibit vertical-specific drivers such as regulatory mandates, latency-sensitive trading systems, or industrial IoT telemetry. Collectively, these sectors highlight how the SD-WAN market adapts to diverse performance and compliance imperatives, reinforcing a horizontal technology adopted for vertical outcomes.
Geography Analysis
North America controlled 41.20% of 2025 revenue owing to early cloud adoption, abundant broadband, and aggressive SASE experimentation. The U.S. Federal Communications Commission reported that 92% of business addresses accessed gigabit internet in 2025, allowing overlays to aggregate low-cost circuits for MPLS-grade reliability[3]Source: U.S. Federal Communications Commission, “Broadband Deployment Report 2025,” FCC.GOV . Financial services hubs in New York and Charlotte, healthcare systems in Boston and Houston, and technology clusters in Silicon Valley collectively drove demand for consolidated network-security stacks. Canadian enterprises confront vast geographic dispersion, while Mexican manufacturers along the U.S. border lean on SD-WAN to support Industry 4.0 initiatives.
Asia-Pacific is forecast to post the fastest expansion at a 29.90% CAGR to 2031, propelled by India’s USD 1.2 billion Digital India program, China’s intelligent manufacturing push, and ASEAN’s e-commerce boom. Standalone 5G cores rolling out across Japan, South Korea, and Australia fuel network slicing pilots that dovetail with SD-WAN orchestration. Emerging markets from Indonesia to Vietnam capitalize on SD-WAN to bypass expensive MPLS footprints and support cross-border digital trade.
Europe’s trajectory is shaped by GDPR data-residency mandates that favor hybrid architectures keeping sensitive payloads on-premises. Germany’s automotive giants link factories with engineering centers, while U.K. banks integrate SD-WAN and zero-trust to protect high-value trading flows. French and German operators launched bundled managed services in 2025, targeting mid-market firms lacking network personnel. Middle Eastern governments, notably Saudi Arabia and the United Arab Emirates, embed SD-WAN in national digital strategies, whereas South Africa and Nigeria anchor African adoption. In South America, Brazil and Argentina modernize frame relay estates via SD-WAN overlays to sustain e-commerce and hybrid work.

Competitive Landscape
The top five suppliers captured roughly 58% of 2025 revenue, indicating moderate concentration. Incumbent infrastructure vendors extend router portfolios with acquired SD-WAN code, while pure-play cloud natives market simplified deployment and AI-enabled troubleshooting. Strategic moves include vertical integration of security stacks to form SASE platforms and partnership bundles between vendors and telecom operators offering managed connectivity.
Standardization is reshaping the SD-WAN market. IETF RFC 9182, published in May 2025, codified control-plane protocols that foster multi-vendor interoperability. Vendors now compete on analytics, automation, and third-party integrations rather than proprietary tunnels. AT&T, Verizon, and global carriers bundle overlays with 5G transport under SLA-backed subscriptions, challenging license-centric business models. AI-driven self-healing, zero-touch provisioning, and natural-language troubleshooting further distinguish emergent players.
Consolidation persists: Cisco acquired Isovalent in January 2026 to embed eBPF observability into its SD-WAN fabric, while Palo Alto Networks launched Prisma SD-WAN 3.0 with AI-based experience management in December 2025. Such moves underscore a race toward holistic edge-to-cloud platforms that converge networking, security, and observability under consumption pricing.
Software-Defined Wide Area Network Industry Leaders
Cisco Systems
Fortinet
VMware (Broadcom)
HPE Aruba
Versa Networks
- *Disclaimer: Major Players sorted in no particular order

Recent Industry Developments
- January 2026: Cisco Systems acquired Isovalent for USD 650 million to embed eBPF observability and microsegmentation into its SD-WAN suite.
- December 2025: Palo Alto Networks released Prisma SD-WAN 3.0, adding AI-based digital experience management.
- November 2025: Fortinet reported 38% year-over-year SD-WAN billings growth, signing 9,200 new customers.
- October 2025: VMware and Amazon Web Services integrated VMware SD-WAN with AWS Verified Access for VPN-less zero-trust.


Research Methodology Framework and Report Scope
Market Definitions and Key Coverage
Our study defines the Software-Defined Wide Area Network (SD-WAN) market as all revenues generated from purpose-built hardware, virtual appliances, and subscription licenses that apply software-defined networking principles to manage and optimize enterprise WAN traffic across multiple connectivity types. The scope follows traffic orchestration, policy control, analytics, and integrated security functions that ship with vendor or service-provider SD-WAN offerings.
Scope exclusion: Stand-alone secure access service edge (SASE) bundles sold without an SD-WAN core are not counted.
Segmentation Overview
- By Deployment Mode
- Premise
- Cloud
- Hybrid
- By Component
- Solutions
- Services
- By Organization Size
- Large Enterprises
- Small and Medium Enterprises
- By End-User Industry
- Healthcare
- BFSI
- Retail and Consumer Services
- Manufacturing
- Transport and Logistics
- IT and Telecom
- Others End-User Industry
- By Geography
- North America
- United States
- Canada
- Mexico
- Europe
- Germany
- United Kingdom
- France
- Italy
- Spain
- Russia
- Rest of Europe
- Asia-Pacific
- China
- Japan
- India
- South Korea
- Australia
- Rest of Asia-Pacific
- Middle East
- Saudi Arabia
- United Arab Emirates
- Turkey
- Rest of Middle East
- Africa
- South Africa
- Nigeria
- Rest of Africa
- South America
- Brazil
- Argentina
- Rest of South America
- North America
Detailed Research Methodology and Data Validation
Primary Research
Mordor researchers interviewed SD-WAN product managers, managed-service providers, and network architects across North America, Europe, and fast-growing Asia Pacific. Conversations probed average site counts, license price bands, migration timelines, and expected refresh cycles, letting us stress-test secondary findings and refine cost-down assumptions.
Desk Research
Analysts began with public datasets, such as the U.S. FCC broadband pricing tables, Eurostat ICT enterprise surveys, and ASEAN telecom statistics, which reveal branch connectivity trends. Industry bodies, including MEF, ONUG, and the Broadband Forum, supply adoption benchmarks and certification counts. Company 10-Ks and investor decks clarify vendor revenue splits, while patent databases like Questel hint at innovation pacing. News archives from Dow Jones Factiva track contract wins that validate geographic rollout. The sources listed illustrate our desk work and are not exhaustive; many additional materials informed data collection and gap checks.
Market-Sizing & Forecasting
A top-down model starts with the global pool of enterprise branches by vertical, applies connectivity-mix shares and SD-WAN penetration rates, and then multiplies by verified average selling prices. Select bottom-up checks, supplier revenue roll-ups and channel ASP×volume samples, calibrate totals. Key model inputs include: MPLS-to-internet substitution ratios, cloud application spending, average branch bandwidth, hybrid-work adoption, and security overlay attach rates. Forecasts employ multivariate regression that weights GDP growth, SaaS traffic expansion, and price erosion, with scenarios validated in expert calls. Where supplier data lagged, we bridged gaps through regional channel checks before finalizing numbers.
Data Validation & Update Cycle
Outputs undergo variance scans against historic vendor filings and tariff data. An analyst peer reviews anomalies, followed by managerial sign-off. The dataset refreshes yearly; material events, major M&A or regulatory shifts, trigger interim updates and client notifications.
Why Mordor's SD WAN Baseline Earns Network-Planning Confidence
Published figures often diverge because firms pick different revenue buckets, price-drop curves, and update cadences.
Key gap drivers include whether services income is counted, the year chosen as the base, and how aggressively future branch counts are assumed to fall as cloud edges proliferate. Mordor's scope captures vendor and provider SD-WAN revenues only, uses verified 2025 pricing corridors, and refreshes annually, while others may mix in managed SASE fees or rely on older data snapshots.
Benchmark comparison
| Market Size | Anonymized source | Primary gap driver |
|---|---|---|
| USD 9.33 B (2025) | Mordor Intelligence | - |
| USD 6.46 B (2024) | Global Consultancy A | Excludes services revenue; older base year |
| USD 3.50 B (2022) | Trade Journal B | Uses pre-pandemic branch count; limited geography |
| USD 8.86 B (2024) | Regional Consultancy C | Adds managed SASE, inflating totals |
In sum, the disciplined variable selection, dual-path validation, and timely refresh cycle give Mordor's baseline a balanced middle ground that decision-makers can trace back to clear assumptions and replicate with confidence.


Key Questions Answered in the Report
What current value does the SD-WAN market represent?
The SD-WAN market size reached USD 11.61 billion in 2026 and is forecast to climb to USD 28.32 billion by 2031.
Which region is expanding the fastest?
Asia-Pacific is projected to grow at a 29.90% CAGR through 2031, spurred by government digital agendas, cloud adoption, and 5G deployment.
How are enterprises reducing WAN costs?
Organizations hybridize transport, reserving MPLS for critical traffic while shifting bulk data to low-cost broadband, cutting WAN expenses by 30-50%.
Why is retail adopting SD-WAN rapidly?
Retailers need resilient, scalable connectivity for cloud-based point-of-sale, real-time inventory, and in-store analytics, driving a 28.40% CAGR to 2031.
What deployment model is gaining momentum?
Cloud and hybrid SD-WAN deployments are surging, with cloud modes expected to expand at 25.50% CAGR as customers favor consumption-based services.
What role does 5G play in SD-WAN evolution?
5G network slicing integrates with SD-WAN controllers to guarantee latency and bandwidth for industrial automation, AR/VR training, and other real-time uses.
Page last updated on:


