Heterogeneous Networks Market Size and Share
Market Overview
| Study Period | 2019 - 2030 |
|---|---|
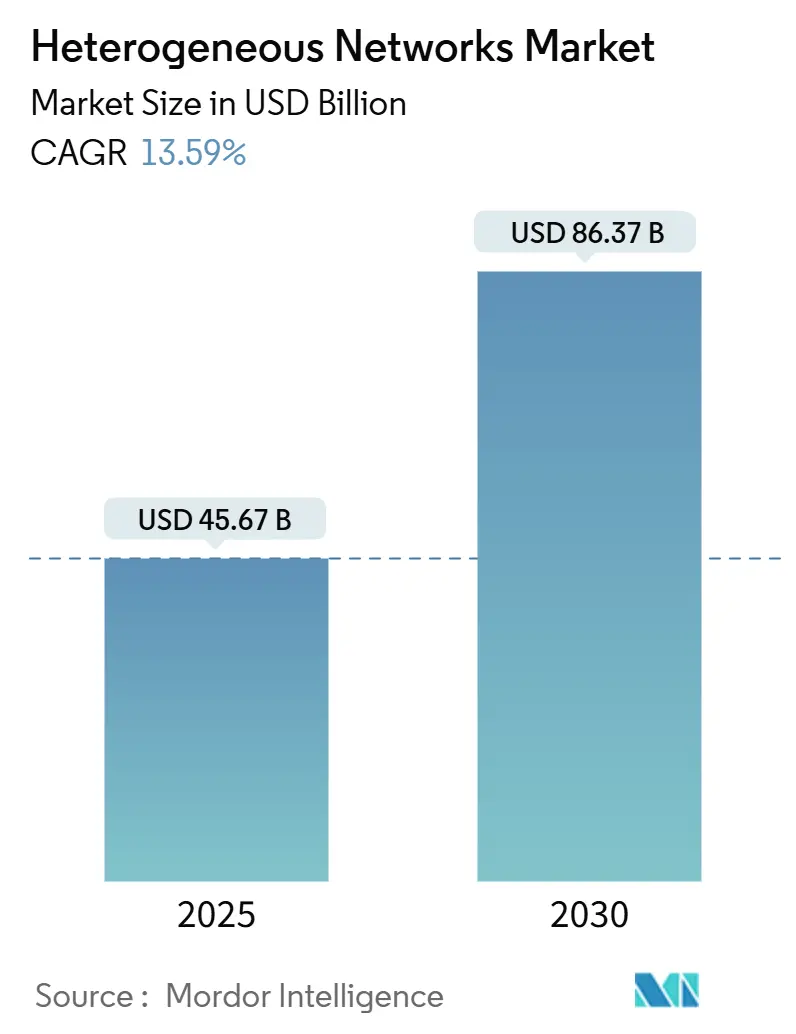
| Market Size (2025) | USD 45.67 Billion |
| Market Size (2030) | USD 86.37 Billion |
| Growth Rate (2025 - 2030) | 13.59% CAGR |
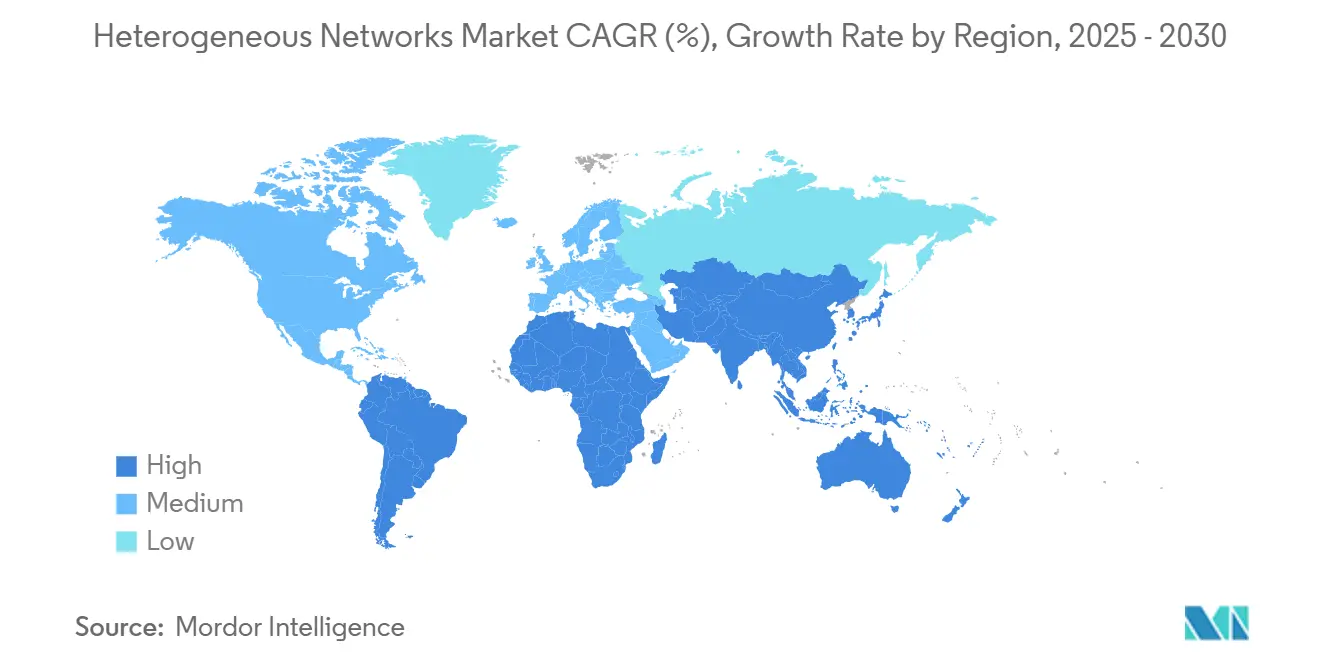
| Fastest Growing Market | Middle East |
| Largest Market | Asia Pacific |
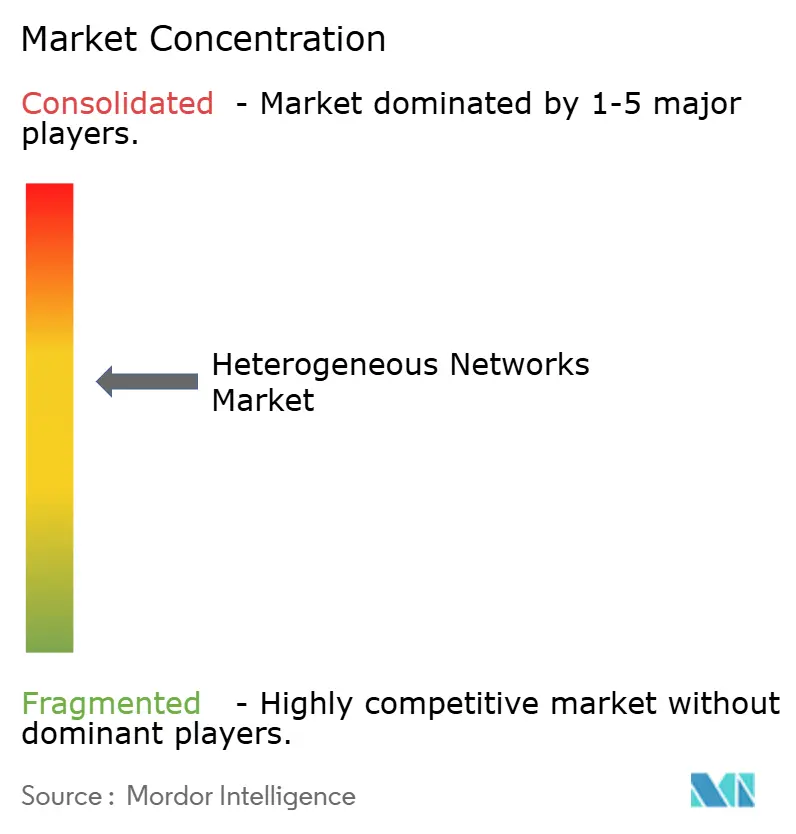
| Market Concentration | Medium |
Major Players *Disclaimer: Major Players sorted in no particular order Image © Mordor Intelligence. Reuse requires attribution under CC BY 4.0. | |
Heterogeneous Networks Market Analysis by Mordor Intelligence
The heterogeneous networks market size is valued at USD 45.67 billion in 2025 and is projected to reach USD 86.37 billion by 2030, advancing at a 13.59% CAGR, underscoring the sector’s strong momentum as operators converge 5G, Wi-Fi 6/7, and small-cell architectures to meet booming data-traffic demands. Intensifying spectrum scarcity, the push for enterprise digitalization, and regulatory support for streamlined small-cell permitting accelerate commercial adoption, while open-standard initiatives erode vendor lock-in and invite a broader supplier base. Hardware dominates current capital outlays, yet managed services outpace other components as operators seek expertise for deploying and optimizing multi-layer networks. Asia-Pacific commands the largest revenue contribution because of aggressive 5G rollout programs, whereas the Middle East shows the fastest growth trajectory, buoyed by smart-city investments. Competitive intensity heightens as open RAN and neutral-host models lower entry barriers and create new opportunities for software-centric vendors.
Key Report Takeaways
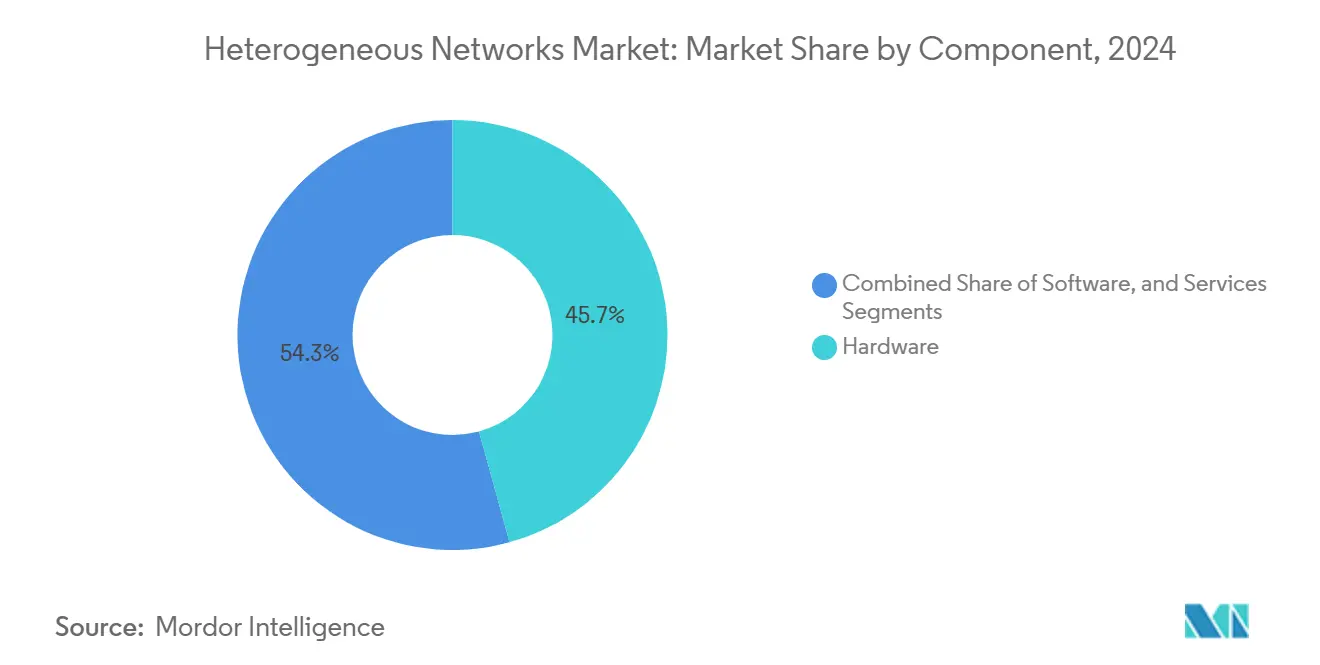
- By component, hardware led with 45.73% revenue share in 2024; services are forecast to expand at a 14.89% CAGR to 2030.
- By cell type, small cells held 37.86% of the heterogeneous networks market share in 2024, while carrier Wi-Fi hotspots record the highest projected CAGR at 13.97% through 2030.
- By radio-access technology, 5G NR commanded 49.74% share of the heterogeneous networks market size in 2024 and is advancing at a 14.13% CAGR through 2030.
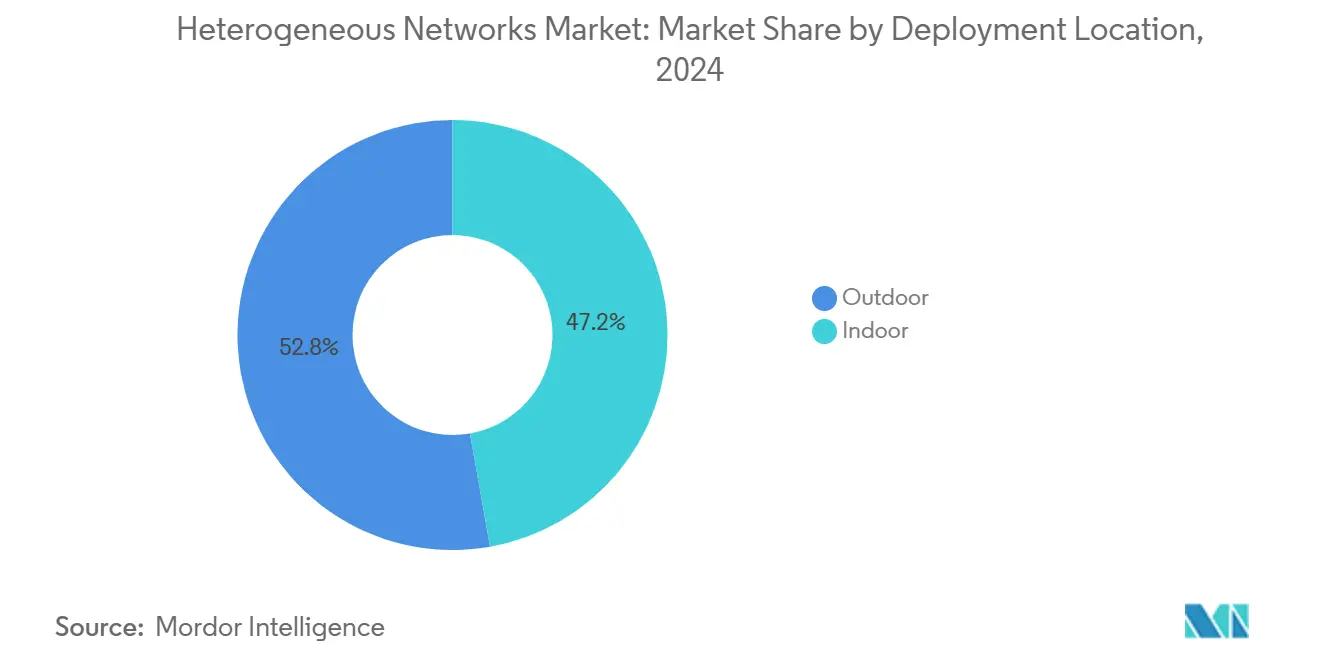
- By deployment location, outdoor installations accounted for 52.79% of the heterogeneous networks market size in 2024; indoor deployments are forecast to expand at a 15.34% CAGR to 2030.
- By end-user, mobile network operators occupied 56.97% of the heterogeneous networks market share in 2024, whereas enterprises and campus networks are set to grow at a 13.96% CAGR through 2030.
- By geography, Asia-Pacific led with 33.61% revenue share in 2024; the Middle East is projected to register a 13.85% CAGR between 2025 and 2030.
Global Heterogeneous Networks Market Trends and Insights
Drivers Impact Analysis*
| Driver | (~) % Impact on CAGR Forecast | Geographic Relevance | Impact Timeline |
|---|---|---|---|
| Exploding 5G mobile-data traffic density requirements | +2.8% | Global, with Asia-Pacific and North America leading | Medium term (2-4 years) |
| Rapid small-cell roll-outs by mobile network operators | +2.1% | Global, concentrated in urban centers | Short term (≤ 2 years) |
| Carrier Wi-Fi off-loading to de-congest macro networks | +1.9% | Global, with emphasis on dense urban markets | Short term (≤ 2 years) |
| Enterprise private-network demand in Industry 4.0 facilities | +1.7% | North America, Europe, Asia-Pacific manufacturing hubs | Medium term (2-4 years) |
| AI-based SON orchestration enabling multi-layer optimisation | +1.4% | Global, early adoption in developed markets | Long term (≥ 4 years) |
| Open-RAN standards lowering vendor lock-in barriers | +1.2% | Global, with regulatory support in US and Europe | Long term (≥ 4 years) |
| Source: Mordor Intelligence | |||
Exploding 5G Mobile-Data Traffic Density Requirements
Mobile operators confront surging traffic from UHD video, augmented-reality services, and industrial IoT devices that overwhelm legacy macro networks. Dense heterogeneous layers of macro, micro, and pico cells sustain gigabit-class throughput, ensuring quality-of-service in crowded city centers. EE’s rapid densification program illustrates how small cells mitigate congestion and bolster spectrum efficiency.[1]Federal Communications Commission, “Accelerating Wireless Broadband Deployment,” FCC, fcc.gov Network slicing further raises bandwidth expectations, reinforcing the imperative for multi-tier architectures. As consumption scales, the reinvestment loop intensifies, solidifying continuous infrastructure upgrades.
Rapid Small-Cell Roll-Outs by Mobile Network Operators
Small cells provide cost-effective capacity gains where macro towers face siting or zoning hurdles. Streamlined municipal permitting shortens deployment cycles from months to weeks, while leveraging street furniture and utility poles lowers site-acquisition costs. The Small Cell Forum projects sustained double-digit growth in global installations, reflecting operator confidence in densification economics.[2]Small Cell Forum, “Global Small Cell Deployments,” Small Cell Forum, smallcellforum.org AI-enabled coordination minimizes interference across overlapping cells, reducing opex. The approach offers faster returns on investment compared with spectrum refarming or additional macro sites.
Carrier Wi-Fi Off-Loading to De-Congest Macro Networks
Carrier-grade Wi-Fi 6E and Wi-Fi 7 solutions migrate high-volume traffic away from licensed bands, freeing cellular resources for latency-sensitive applications. AT&T’s venue-based Wi-Fi deployments exemplify how unlicensed spectrum lowers capacity costs while preserving user experience.[3]AT&T Corp., “Carrier Wi-Fi Solutions for Enterprise Customers,” AT&T, att.com Authentication platforms enable seamless roaming between Wi-Fi and 5G, aided by 3GPP ATSSS standards. Operators monetize Wi-Fi through enterprise agreements and advertising, turning a congestion-relief tool into a revenue stream. Densified Wi-Fi complements indoor coverage where small-cell economics may be less favorable.
Enterprise Private-Network Demand in Industry 4.0 Facilities
Manufacturers, logistics hubs, and healthcare campuses adopt private heterogeneous networks to guarantee sub-10 ms latency and robust security for automation, quality control, and AR maintenance use cases. CBRS shared spectrum in the United States enables do-it-yourself deployments, while operators bundle turnkey managed options. UScellular’s industrial private-network portfolio underscores demand for dedicated connectivity that integrates 5G small cells with Wi-Fi 6 access points. Edge-computing nodes process machine-vision feeds on-site, minimizing backhaul latency. Private networks cut downtime and improve predictive-maintenance accuracy, strengthening ROI for capital-intensive factories.
Restraints Impact Analysis*
| Restraint | (~) % Impact on CAGR Forecast | Geographic Relevance | Impact Timeline |
|---|---|---|---|
| High capex/opex for dense multi-layer deployments | -1.8% | Global, particularly in developed markets | Short term (≤ 2 years) |
| Spectrum-layer interference and planning complexity | -1.2% | Global, acute in dense urban areas | Medium term (2-4 years) |
| Municipal site-acquisition and street-furniture bottlenecks | -0.9% | North America and Europe primarily | Short term (≤ 2 years) |
| Expanded cyber-threat surface across heterogeneous nodes | -0.7% | Global, with regulatory focus in EU and US | Long term (≥ 4 years) |
| Source: Mordor Intelligence | |||
High Capex/Opex for Dense Multi-Layer Deployments
Site leasing, power, and backhaul fees mount rapidly when hundreds of small cells supplement each macro sector. Operators juggle shareholder return expectations against the imperative to sustain network quality, often shifting to network-as-a-service or neutral-host models to lighten balance sheets. Rural or low-ARPU zones struggle to clear investment hurdles, prolonging coverage gaps. Vendors answer with integrated radios, software-defined fronthaul, and shared infrastructure agreements to curb costs. Yet without clear monetization paths, capex pressure tempers rollout velocity in price-sensitive markets.
Spectrum-Layer Interference and Planning Complexity
Co-channel and adjacent-band interference intensify when macro, small-cell, and Wi-Fi layers overlap in dense cityscapes. Sophisticated predictive-analysis tools and AI-driven SON algorithms are essential to tune power levels, select channels, and orchestrate handovers in real time. The learning curve and cost of such tools slow adoption for smaller carriers. Failure to manage interference erodes user experience, invites churn, and raises regulatory scrutiny. Operators must balance rapid deployment with meticulous RF planning, a time-consuming constraint in fast-moving competitive landscapes.
*Our forecasts treat driver/restraint impacts as directional, not additive. The impact forecasts reflect baseline growth, mix effects, and variable interactions.
Segment Analysis
By Component: Services Surge Amid Hardware Dominance
Hardware contributed 45.73% revenue in 2024, reflecting essential investments in radios, antennas, and power systems that underpin heterogeneous architectures. Services, however, are on track for a 14.89% CAGR as operators outsource design, deployment, and optimization to control rising complexity and opex. The heterogeneous networks market, therefore, exhibits a pivot toward recurring revenue models as managed-service contracts offset sluggish hardware margins. Software platforms, buoyed by AI-driven SON and cloud-native core functions, create new monetization layers for vendors that blend orchestration, analytics, and security.
Operators increasingly value turnkey packages that collapse multivendor integration risk and accelerate time-to-market for new coverage zones. Nokia’s portfolio expansion toward integration and lifecycle services confirms demand for expertise that spans radios to edge compute nodes. As private-network uptake climbs, enterprises likewise seek managed offerings to avoid building networking skill sets in-house. The resultant services outperformance positions integrators and neutral-host specialists as pivotal ecosystem players within the heterogeneous networks market.


By Cell Type: Small Cells Lead Dense Urban Evolution
Small cells captured a 37.86% slice of 2024 revenue, cementing their role as capacity workhorses for crowded metro areas. Their compact form factor and modest power draw allow placement on lampposts and building façades where macro towers cannot secure permits, aligning rollout with urban densification priorities. Carrier-grade Wi-Fi hotspots, while smaller in absolute value, are forecast for a 13.97% CAGR as operators embrace Wi-Fi 6E and upcoming Wi-Fi 7 to offload bulk traffic without incurring spectrum fees.
Macrocell investments persist, yet focus on coverage extensions along transportation corridors and rural fringes rather than core cities. Distributed-antenna systems (DAS) serve stadiums and airports, often integrating Wi-Fi access points to deliver seamless user experiences. Femto and pico cells gain traction in enterprise environments requiring private access control. Together, these modalities reinforce the heterogeneous networks market, which thrives on the complementary interplay of diverse cell categories.
By Radio-Access Technology: 5G NR Dominance Meets Wi-Fi Acceleration
5G NR owned 49.74% revenue share in 2024 as operators leveraged standalone and non-standalone deployments to unlock low-latency services and network slicing. The technology’s flexible numerology and spectral efficiency allow operators to reclaim bandwidth without adding spectrum, amplifying cost-effectiveness. Wi-Fi 6/6E/7, meanwhile, is primed for a 14.13% CAGR through 2030, propelled by enterprise demand for deterministic latency and 6 GHz spectrum access rights.
LTE remains relevant in emerging markets where 5G device uptake lags, ensuring continuous service for vast subscriber bases. Convergence frameworks such as 3GPP ATSSS foster transparent traffic steering between cellular and Wi-Fi, giving subscribers consistent quality. This synergy highlights an era in which heterogeneous networks market expansion hinges less on “either-or” technology bets and more on fluid orchestration across licensed and unlicensed domains.
By Deployment Location: Indoor Growth Accelerates Enterprise Adoption
Outdoor sites supplied 52.79% of 2024 revenue thanks to macro and micro installations that secure blanket metropolitan coverage. Yet indoor deployments are forecast to climb at a 15.34% CAGR as factories, hospitals, and campuses demand controllable, low-latency coverage shielded from exterior interference. The heterogeneous networks market size tied to indoor rollouts will therefore rise sharply, reshaping vendor go-to-market tactics toward venue-specific solutions.
Shared-spectrum frameworks such as CBRS lower barriers for enterprises to self-provision on-premise small cells. Edge-compute servers colocated with indoor radios enable real-time analytics that traditional macro connections cannot support. Neutral-host providers further simplify building-owner decisions by aggregating multi-operator traffic on common infrastructure. Collectively, these factors propel indoor viability and enhance overall network resiliency.
By End-User: Enterprise Networks Drive Private Connectivity Revolution
Mobile network operators dominated demand at 56.97% in 2024, yet enterprise and campus networks will post a 13.96% CAGR, reshaping value distribution across the supply chain. Manufacturers exploit deterministic connectivity to automate production lines, while universities deploy campus-wide 5G and Wi-Fi 6E mesh to support research and immersive learning.
Neutral-host providers, though nascent, carve a niche in transport hubs and commercial real estate by pooling operator traffic through software-defined antennas, thereby reducing duplicative equipment. Smart-city authorities leverage heterogeneous layers for public-safety video analytics, connected street lighting, and traffic optimization. These stakeholders collectively diversify revenue sources and dilute traditional carrier hegemony within the heterogeneous networks industry.
Geography Analysis
Asia-Pacific’s heterogeneous networks market share leadership results from synchronized public-policy support, dense urbanization, and strong manufacturing footprints. China alone exceeded 3 million 5G base stations by 2024, and operators supplement those macrocells with extensive small-cell grids in tier-one cities to address spectrum-efficiency constraints. Japan’s automotive and electronics sectors pioneer private-network prototypes integrating 5G and Wi-Fi 6E, broadening vendor opportunities in indoor orchestration. India’s operators struggle with ARPU compression yet deploy small cells in prime business districts to keep pace with smartphone penetration growth. Collectively, the synergy of policy, population, and industrial demand cements Asia-Pacific’s position as the core engine of global heterogeneous expansion.
The Middle East records the steepest future trajectory as the UAE, Saudi Arabia, and Qatar fast-track Vision-aligned digital-infrastructure budgets. UAE’s 5G-Advanced launch demonstrates early adoption of carrier-aggregated millimeter-wave and sub-6 GHz layers that require dense microcell placement. Saudi Arabia’s NEOM smart-city blueprint stipulates an integrated terrestrial and non-terrestrial network fabric, spurring investment across radio, fiber backhaul, and edge cloud. Energy-sector operators in the Gulf deploy private 5G to automate remote-site monitoring, showcasing heterogeneous value beyond metropolitan footprints. These initiatives, coupled with streamlined spectrum licensing, propel the Middle East toward double-digit growth through 2030.
North America sustains moderate growth underpinned by enterprise private-network activity. The FCC’s infrastructure order trims local-permit timelines, encouraging operators to densify 5G in suburban corridors previously unattractive for macro upgrades. CBRS shared-spectrum licensing empowers universities, ports, and logistics centers to implement campus-wide small-cell grids, validating neutral-host economics. In Europe, regulatory incentives for open-RAN adoption and cybersecurity mandates reshape procurement, ensuring a gradual but steady build-out across member states. Latin America and Africa remain emerging prospects with piecemeal rollouts focused on high-ARPU urban centers, constrained by macroeconomic volatility yet buoyed by multilateral funding programs that target digital inclusion.

Competitive Landscape
Traditional infrastructure vendors-Ericsson, Nokia, and Huawei-retain scale advantages in R&D and global supply chains, yet confront rising competition from open-RAN specialists and software-centric integrators. Strategic shifts emphasize cloud-native RAN, AI-based orchestration, and service-centric revenue streams over pure hardware margin. Ericsson’s SEK 67.9 billion Q3 2024 revenue illustrates resilient demand for multiband radios, but the firm increasingly bundles lifecycle services to lock in recurring income.
Neutral-host providers such as American Tower and Boingo accelerate indoor and transportation-hub deployments, leveraging shared infrastructure models that appeal to cost-sensitive operators expanding 5G footprints. Open-RAN champions Parallel Wireless and Mavenir secure multi-operator small-cell awards, helped by government initiatives that favor diversified supply chains. Semiconductor shortages in 2024 spurred vendor commitments like GlobalFoundries’ USD 16 billion fab expansion, enhancing component security for small-cell and Wi-Fi-6E radios.
Software vendors differentiate through AI-driven SON, real-time analytics, and security overlays, expanding the ecosystem beyond traditional telecom equipment makers. Telcos increasingly adopt DevOps practices, forging partnerships with hyperscale cloud providers to co-create edge-native network functions. This evolving mix yields a moderately concentrated yet dynamic heterogeneous networks market where top-five vendors hold roughly 55% combined share, enabling mid-tier innovators to capture niche demand without confronting insurmountable entry barriers.
Heterogeneous Networks Industry Leaders
Telefonaktiebolaget LM Ericsson
Nokia Corporation
Huawei Technologies Co., Ltd.
ZTE Corporation
Samsung Electronics Co., Ltd.
- *Disclaimer: Major Players sorted in no particular order

Recent Industry Developments
- January 2025: NVIDIA and T-Mobile partnered to develop AI-native 6G architectures integrating terrestrial and satellite layers for real-time heterogeneous optimization.
- December 2024: Vodafone and Three finished their USD 11 billion United Kingdom network consolidation, forming Europe’s largest heterogeneous footprint.
- November 2024: HPE closed a USD 14 billion takeover of Juniper Networks, creating a unified portfolio spanning carrier and enterprise heterogeneous solutions.
- October 2024: Ericsson and Dell Technologies aligned to accelerate Cloud RAN across small-cell and macro environments.


Global Heterogeneous Networks Market Report Scope
| Hardware |
| Software |
| Services |
| Macrocell |
| Small Cell |
| Femto |
| Pico |
| Micro |
| Distributed Antenna System (DAS) |
| Carrier Wi-Fi Hotspot |
| 5G NR |
| 4G/LTE |
| 3G and Earlier |
| Wi-Fi 6/6E/7 |
| Indoor |
| Outdoor |
| Mobile Network Operators (MNOs) |
| Neutral-Host Providers |
| Enterprises and Campus Networks |
| Smart-City Authorities |
| North America | United States | |
| Canada | ||
| Mexico | ||
| Europe | Germany | |
| United Kingdom | ||
| France | ||
| Russia | ||
| Rest of Europe | ||
| Asia-Pacific | China | |
| Japan | ||
| India | ||
| South Korea | ||
| Australia | ||
| Rest of Asia-Pacific | ||
| Middle East and Africa | Middle East | Saudi Arabia |
| United Arab Emirates | ||
| Rest of Middle East | ||
| Africa | South Africa | |
| Egypt | ||
| Rest of Africa | ||
| South America | Brazil | |
| Argentina | ||
| Rest of South America | ||
| By Component | Hardware | ||
| Software | |||
| Services | |||
| By Cell Type | Macrocell | ||
| Small Cell | |||
| Femto | |||
| Pico | |||
| Micro | |||
| Distributed Antenna System (DAS) | |||
| Carrier Wi-Fi Hotspot | |||
| By Radio-Access Technology | 5G NR | ||
| 4G/LTE | |||
| 3G and Earlier | |||
| Wi-Fi 6/6E/7 | |||
| By Deployment Location | Indoor | ||
| Outdoor | |||
| By End-user | Mobile Network Operators (MNOs) | ||
| Neutral-Host Providers | |||
| Enterprises and Campus Networks | |||
| Smart-City Authorities | |||
| By Geography | North America | United States | |
| Canada | |||
| Mexico | |||
| Europe | Germany | ||
| United Kingdom | |||
| France | |||
| Russia | |||
| Rest of Europe | |||
| Asia-Pacific | China | ||
| Japan | |||
| India | |||
| South Korea | |||
| Australia | |||
| Rest of Asia-Pacific | |||
| Middle East and Africa | Middle East | Saudi Arabia | |
| United Arab Emirates | |||
| Rest of Middle East | |||
| Africa | South Africa | ||
| Egypt | |||
| Rest of Africa | |||
| South America | Brazil | ||
| Argentina | |||
| Rest of South America | |||


Key Questions Answered in the Report
What is the projected value of the heterogeneous networks market by 2030?
The sector is forecast to reach USD 86.37 billion by 2030, expanding at a 13.59% CAGR.
Which region currently leads in heterogeneous network deployments?
Asia-Pacific holds 33.61% revenue share thanks to aggressive 5G rollouts and enterprise private-network uptake.
Which cell type holds the largest share of spending?
Small cells account for 37.86% of 2024 revenue because they efficiently relieve macro-network congestion in dense areas.
Why are enterprises adopting private heterogeneous networks?
They require guaranteed bandwidth, low latency, and enhanced security for Industry 4.0 applications, benefits that private 5G and Wi-Fi 6E networks provide.
What role do open-RAN standards play in this sector?
Open-RAN specifications reduce vendor lock-in by enabling interoperable components, expanding supplier diversity and lowering infrastructure costs.
How is indoor deployment growth trending?
Indoor installations are set to rise at a 15.34% CAGR through 2030 as factories, hospitals, and campuses demand dedicated high-performance coverage.
Page last updated on:


