
Technology, Media and Telecom
5th MayPricing Strategy for Semiconductor Components
3 Min Read
The Physical Internet Market Report is Segmented by Type (Logistic Nodes and Logistic Network), Component (Solution and Services), Enterprise Size (SMEs and Large Enterprises), End-User (Retail and E-Commerce, Manufacturing, Healthcare, Aerospace and Defense, Automotive, and Other End-Users), and Geography.
Market Overview
| Study Period | 2020 - 2031 |
|---|---|
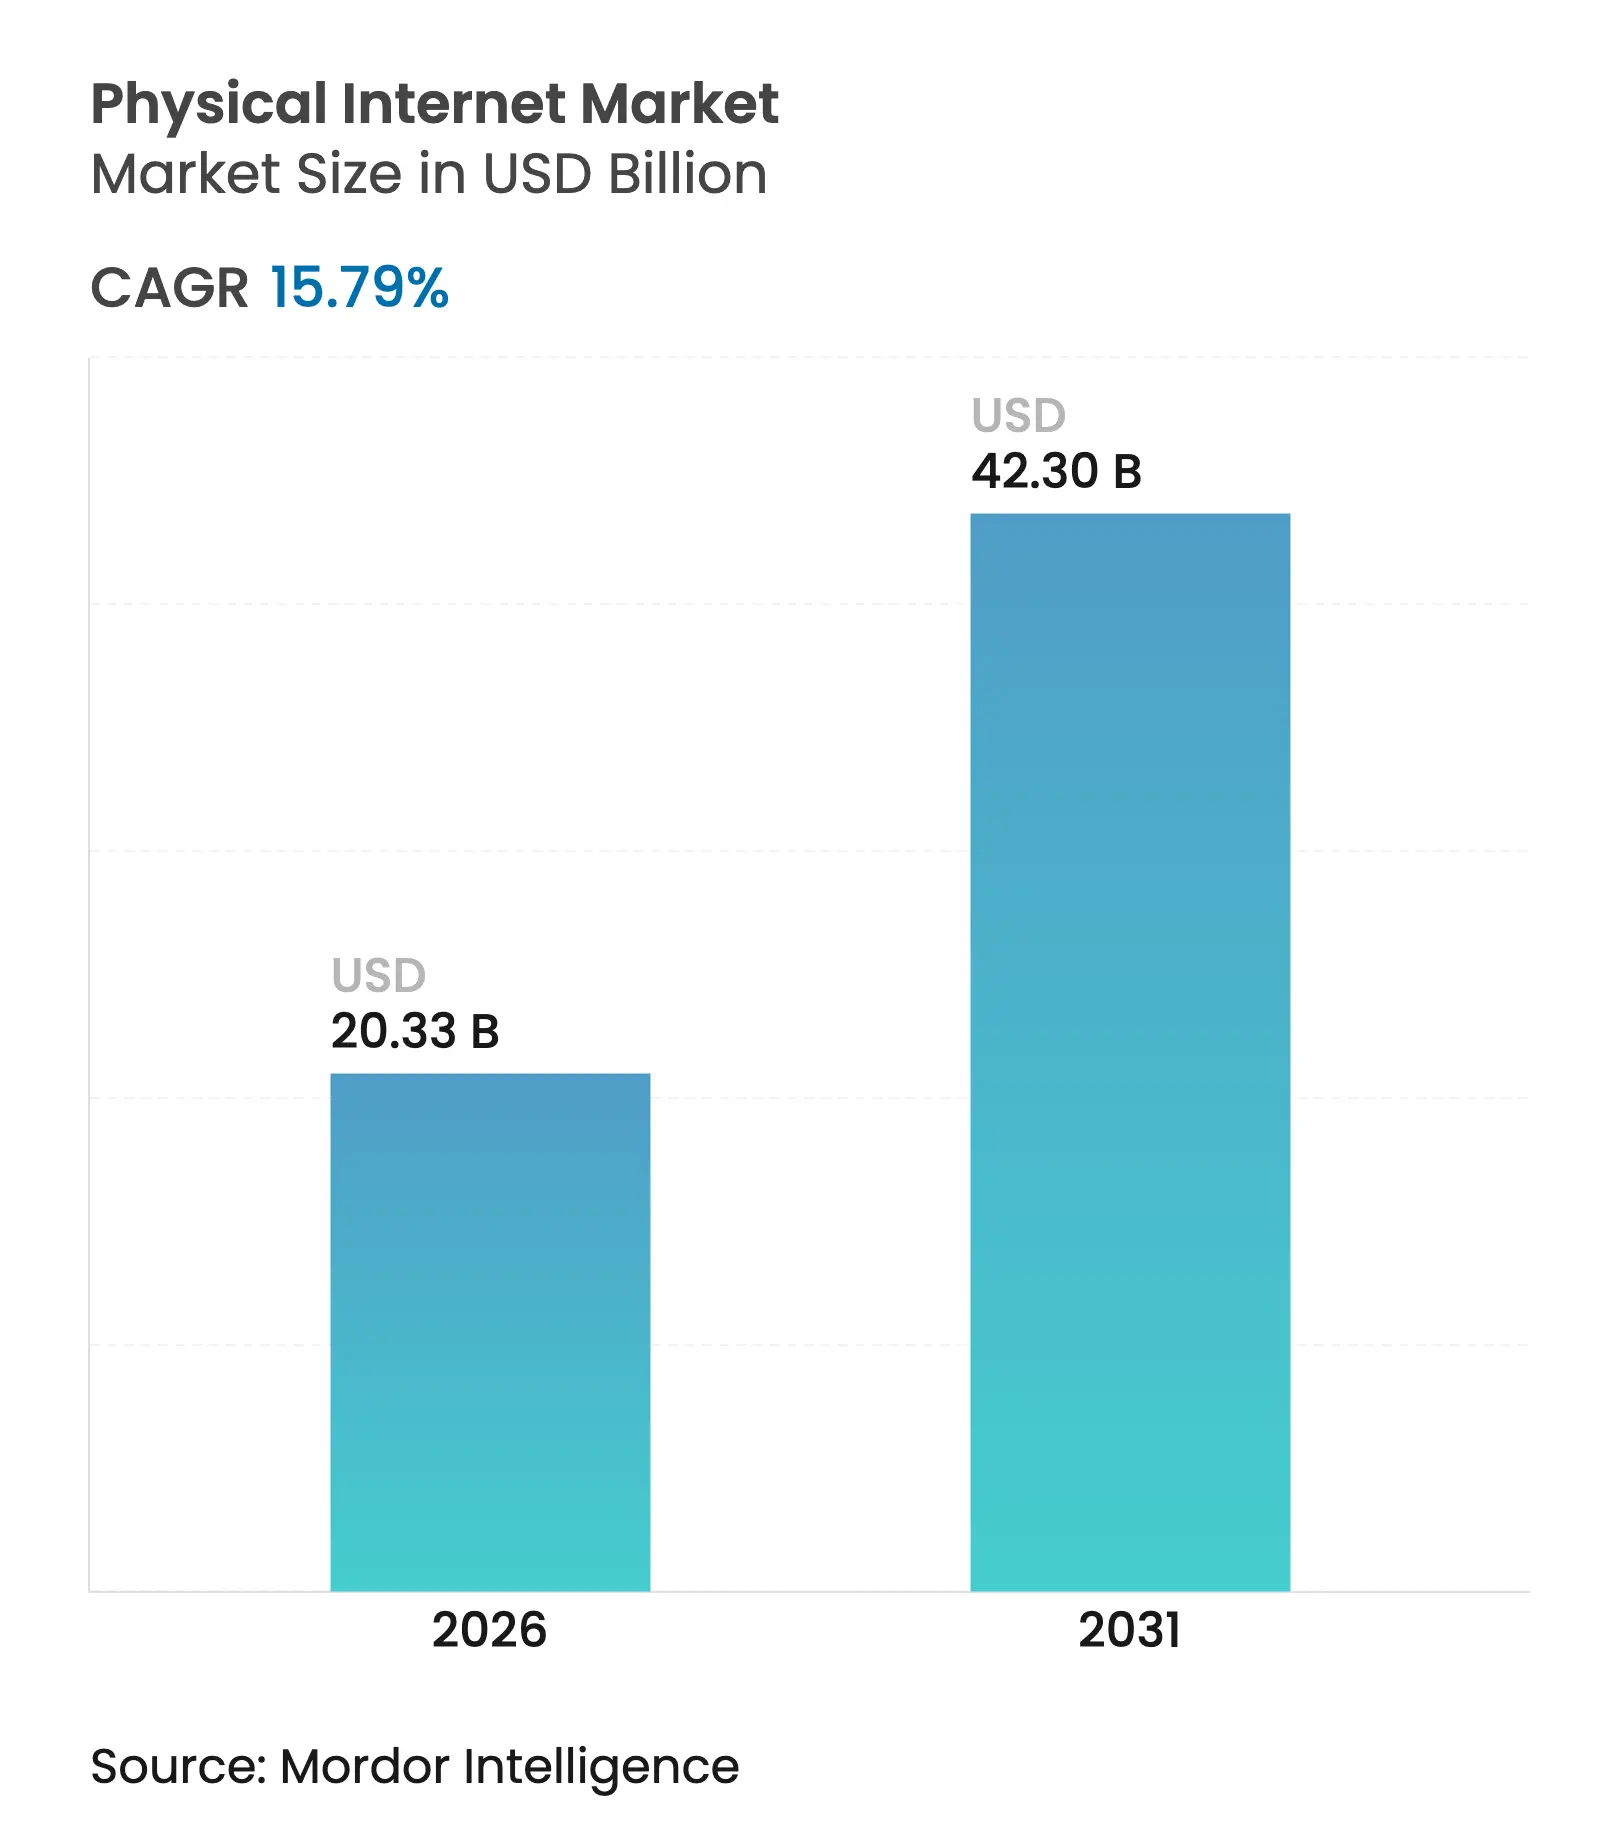
| Market Size (2026) | USD 20.33 Billion |
| Market Size (2031) | USD 42.3 Billion |
| Growth Rate (2026 - 2031) | 15.79 % CAGR |
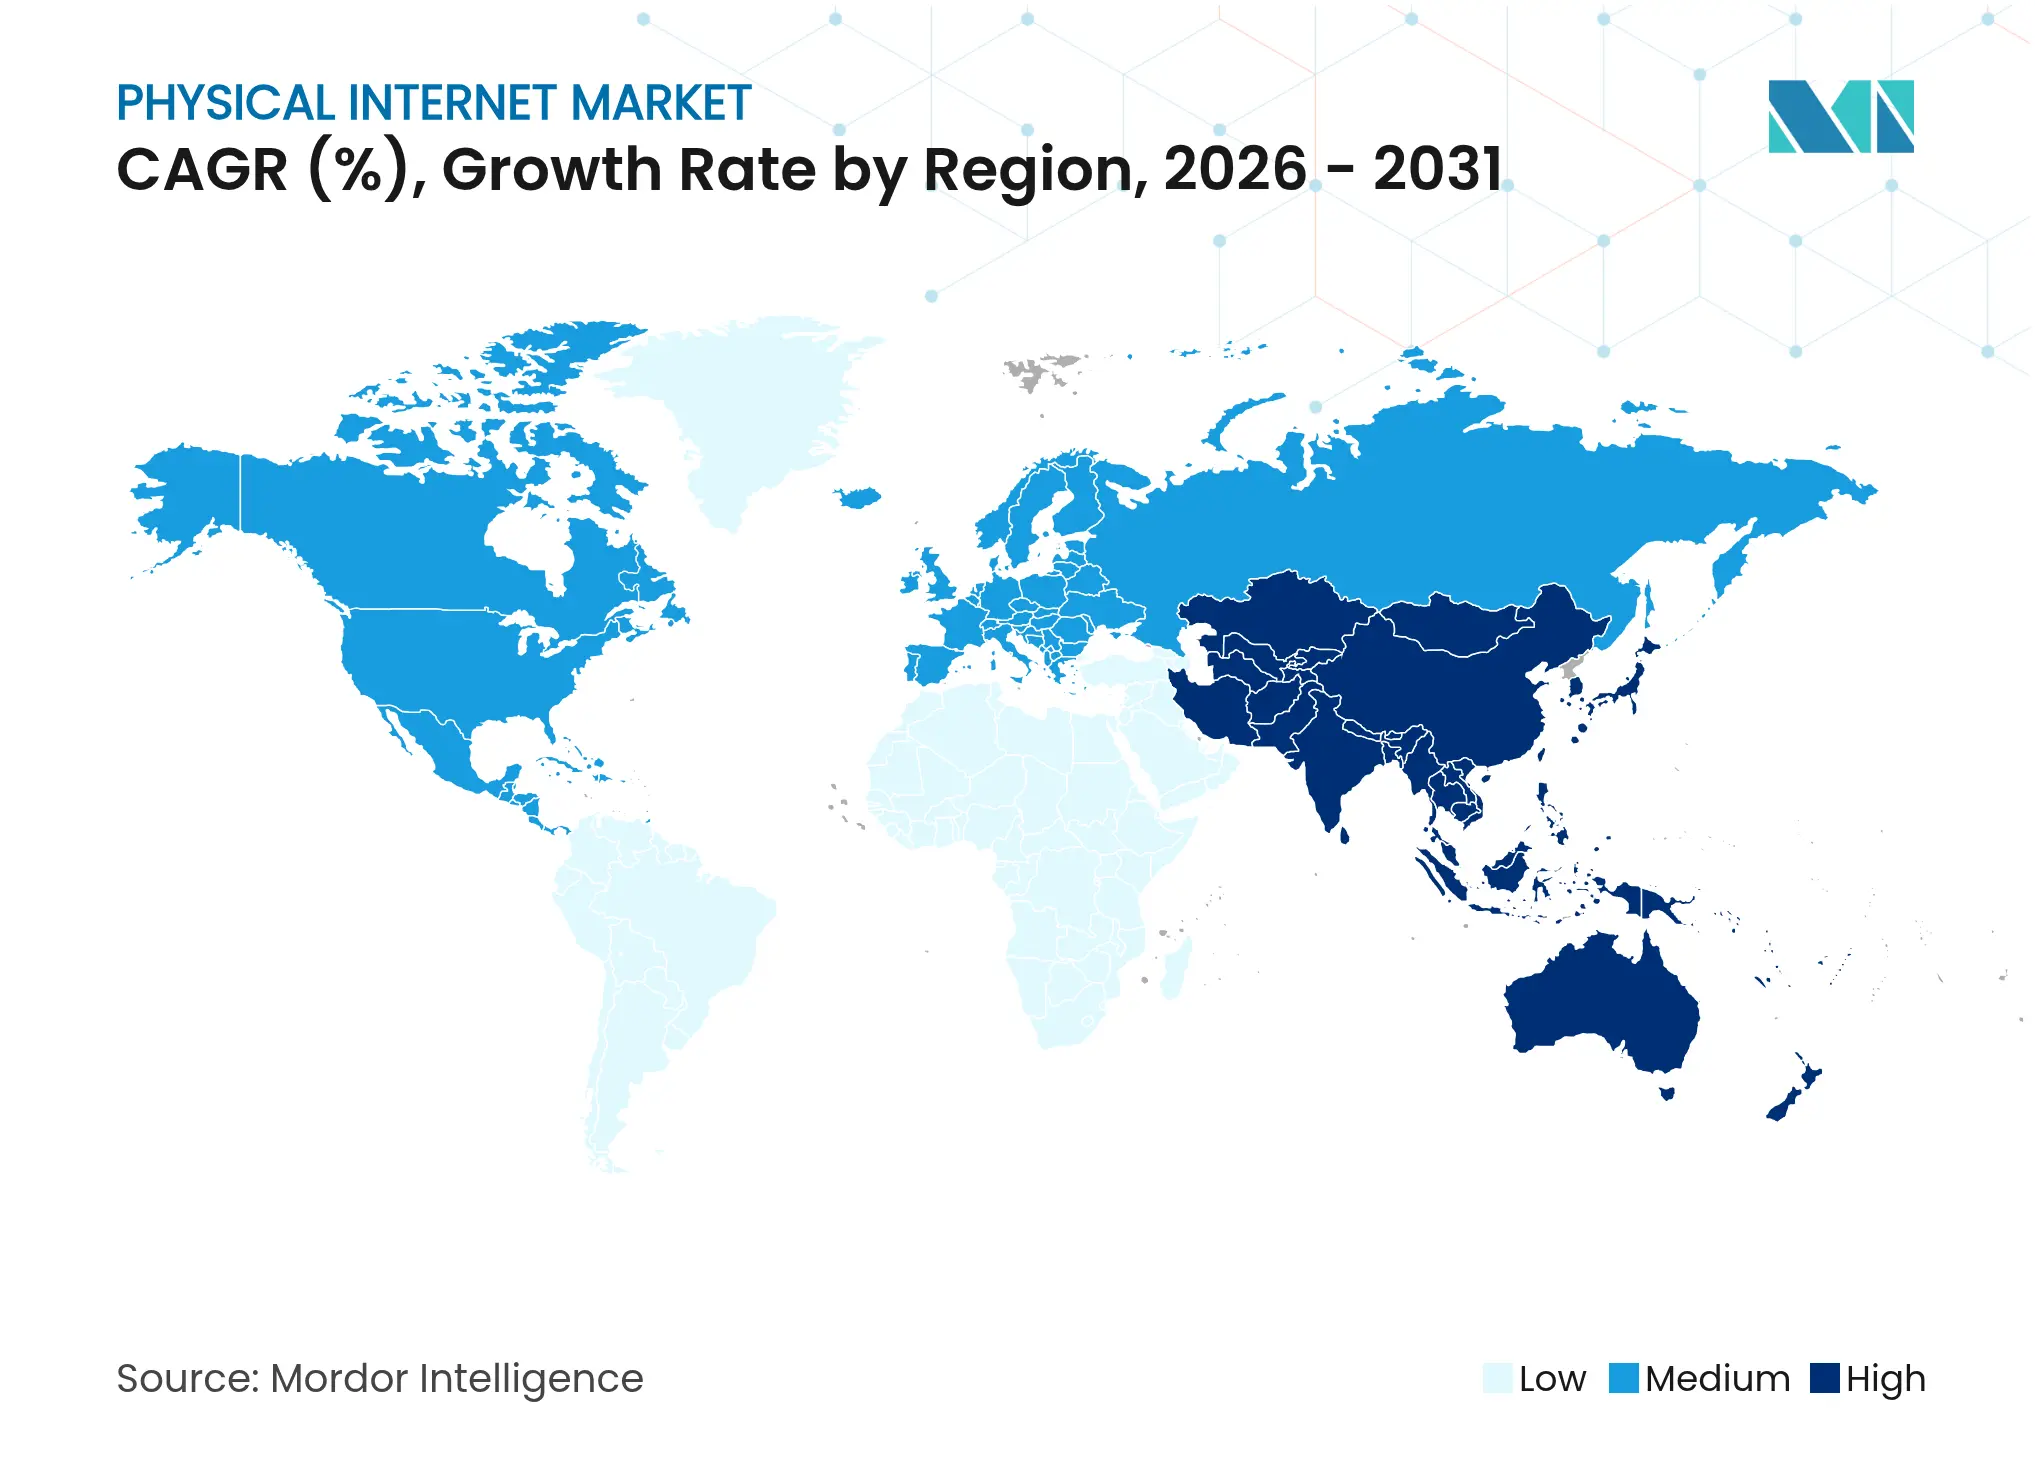
| Fastest Growing Market | Asia Pacific |
| Largest Market | Asia Pacific |
| Market Concentration | Medium |
Major Players *Disclaimer: Major Players sorted in no particular order. Image © Mordor Intelligence. Reuse requires attribution under CC BY 4.0. |
Strong demand for open, modular, and digitally orchestrated logistics networks is transforming global freight flows, mirroring the way data moves across the internet. Growing use of π-containers, AI-driven routing engines, and cloud-based orchestration platforms underpins the rapid scale-up. Companies view asset-sharing as a cost-efficient path to resilience, while regulators encourage multimodal freight solutions that cut emissions. Venture funding and consolidation signal confidence that platform economics will outweigh today’s fragmented operating models, setting the stage for a networked era where collaboration replaces duplication across supply chains.
Key Report Takeaways
Note: Market size and forecast figures in this report are generated using Mordor Intelligence's proprietary estimation framework, updated with the latest available data and insights as of 2026.
Drivers Impact Analysis
| Driver | (~) % Impact on CAGR Forecast | Geographic Relevance | Impact Timeline | |||
|---|---|---|---|---|---|---|
Growing support toward zero-emission logistics Growing support toward zero-emission logistics | 2.80% | Global with EU and California leading | Medium term (2-4 years) | (~) % Impact on CAGR Forecast:2.80% | Geographic Relevance:Global with EU and California leading | Impact Timeline:Medium term (2-4 years) |
Exponential growth in e-commerce Exponential growth in e-commerce | 3.20% | Global, strongest in Asia Pacific and North America | Short term (≤ 2 years) | |||
Government investments in multimodal freight corridors Government investments in multimodal freight corridors | 2.10% | North America, EU, China, India | Long term (≥ 4 years) | |||
Rapid adoption of digital freight platforms by 3PLs Rapid adoption of digital freight platforms by 3PLs | 2.50% | Global, accelerated in developed markets | Short term (≤ 2 years) | |||
| Source: Mordor Intelligence | ||||||
Growing Support Toward Zero-Emission Logistics
Regulations that target carbon neutrality are changing fleet strategies worldwide. The EU Green Deal requires 55% emission cuts by 2030, and California mandates zero-emission commercial vehicles by 2036. Logistics leaders respond with bold moves. DHL is working with Envision Group to reach a 30% Sustainable Aviation Fuel mix by 2030 while building Net Zero Industrial Parks powered by renewables[1]DHL Group, “Sustainable Aviation Fuel Partnerships,” dhl.com. CEVA Logistics added 23 electric trucks in Europe, eliminating 38,300 tons of CO₂ yearly. Shared electric fleets fit Physical Internet principles by boosting utilization, reducing idle time, and trimming total system cost. Saudi Arabia’s USD 266 billion gateway project merges renewables with cross-continental freight corridors. As transport electrifies, operators turn to network orchestration to balance charging, routing, and capacity allocation.
Exponential Growth in E-commerce
Demand for sub-24-hour delivery has outgrown hub-and-spoke economics. Amazon’s Project Juniper rolls out automated micro-fulfillment sites that store goods inside vending modules within city blocks. Southeast Asia’s online retail is projected at USD 186 billion, adding cross-border complexity that only interconnected networks can handle. Nimble secured USD 106 million from FedEx to scale autonomous fulfillment robots, showing investor confidence in software-defined logistics. More than 50% of spot truckloads now move through digital freight matching, slashing tendering friction. Physical Internet market participants leverage data standardization to synchronize inventory, carriers, and customer demand in real time.
Government Investments in Multimodal Freight Corridors
Public funding is laying new tracks, literal and digital, for the Physical Internet market. The US Infrastructure Investment and Jobs Act directs USD 550 billion to multimodal connectivity, while Japan is building a 310-mile automated conveyor belt freight link between Tokyo and Osaka. China’s Belt and Road Initiative embeds digital logistics protocols across dozens of partner economies. Nevada’s inland port and BNSF’s new Arizona hub point to public-private alignment around intermodal efficiency. Lower transfer costs and improved service reliability make networked logistics economically attractive at scale.
Rapid Adoption of Digital Freight Platforms by 3PLs
Third-party providers race to connect shippers, carriers, and tech partners through API-first architectures. GXO’s alliance with Blue Yonder brings advanced warehouse management across shared sites. Shippeo, backed by Toyota’s Woven Capital, tracks 90 million shipments in 150 countries. Robotics-as-a-Service models let firms deploy automated unloading without heavy capex, as shown by Yusen Logistics and Pickle Robot. Standard protocols from DCSA ease data exchange and sharpen visibility, essential for Physical Internet scale.
Restraints Impact Analysis
| Restraint | (~) % Impact on CAGR Forecast | Geographic Relevance | Impact Timeline | |||
|---|---|---|---|---|---|---|
Limited education & skill availability on Physical Internet Limited education & skill availability on Physical Internet | −1.7% | Global, most acute in emerging markets | Medium term (2-4 years) | (~) % Impact on CAGR Forecast:−1.7% | Geographic Relevance:Global, most acute in emerging markets | Impact Timeline:Medium term (2-4 years) |
Legacy infrastructure incompatibility with modular containers Legacy infrastructure incompatibility with modular containers | −2.1% | Asset-heavy developed markets | Long term (≥4 years) | |||
| Source: Mordor Intelligence | ||||||
Limited Education and Skill Availability on Physical Internet
Running a distributed, API-rich network calls for skills in AI, blockchain, and real-time data orchestration that most logistics curricula still omit. OECD finds that 72% of SMEs use data, but only 57% see generative AI as practical due to skill gaps. Amazon’s USD 1.2 billion upskilling plan for 300,000 employees by 2025 shows the effort required. Mid-market firms depend on external consultants, inflating deployment costs and delaying break-even periods. University–industry alliances remain limited, slowing the talent pipeline. This shortfall slightly tempers the growth trajectory but is unlikely to derail the long-term shift toward networked logistics.
Legacy Infrastructure Incompatibility with Modular Containers
Warehouses, ports, and rail yards were built for legacy container sizes, so upgrading for π-containers involves costly retrofits. Kuehne+Nagel’s USD 374 million Mantova site uses 700 robots and 12 miles of conveyors to handle omnichannel flows. Port modifications demand environmental approvals that can take three to five years. Diverse rail gauges and terminal designs hinder standardization. The conservative maritime sector, documented in academic studies, shows resistance to change. Retrofit expenses can equal 15–25% of original construction cost, a burden that slows adoption among asset-heavy incumbents.
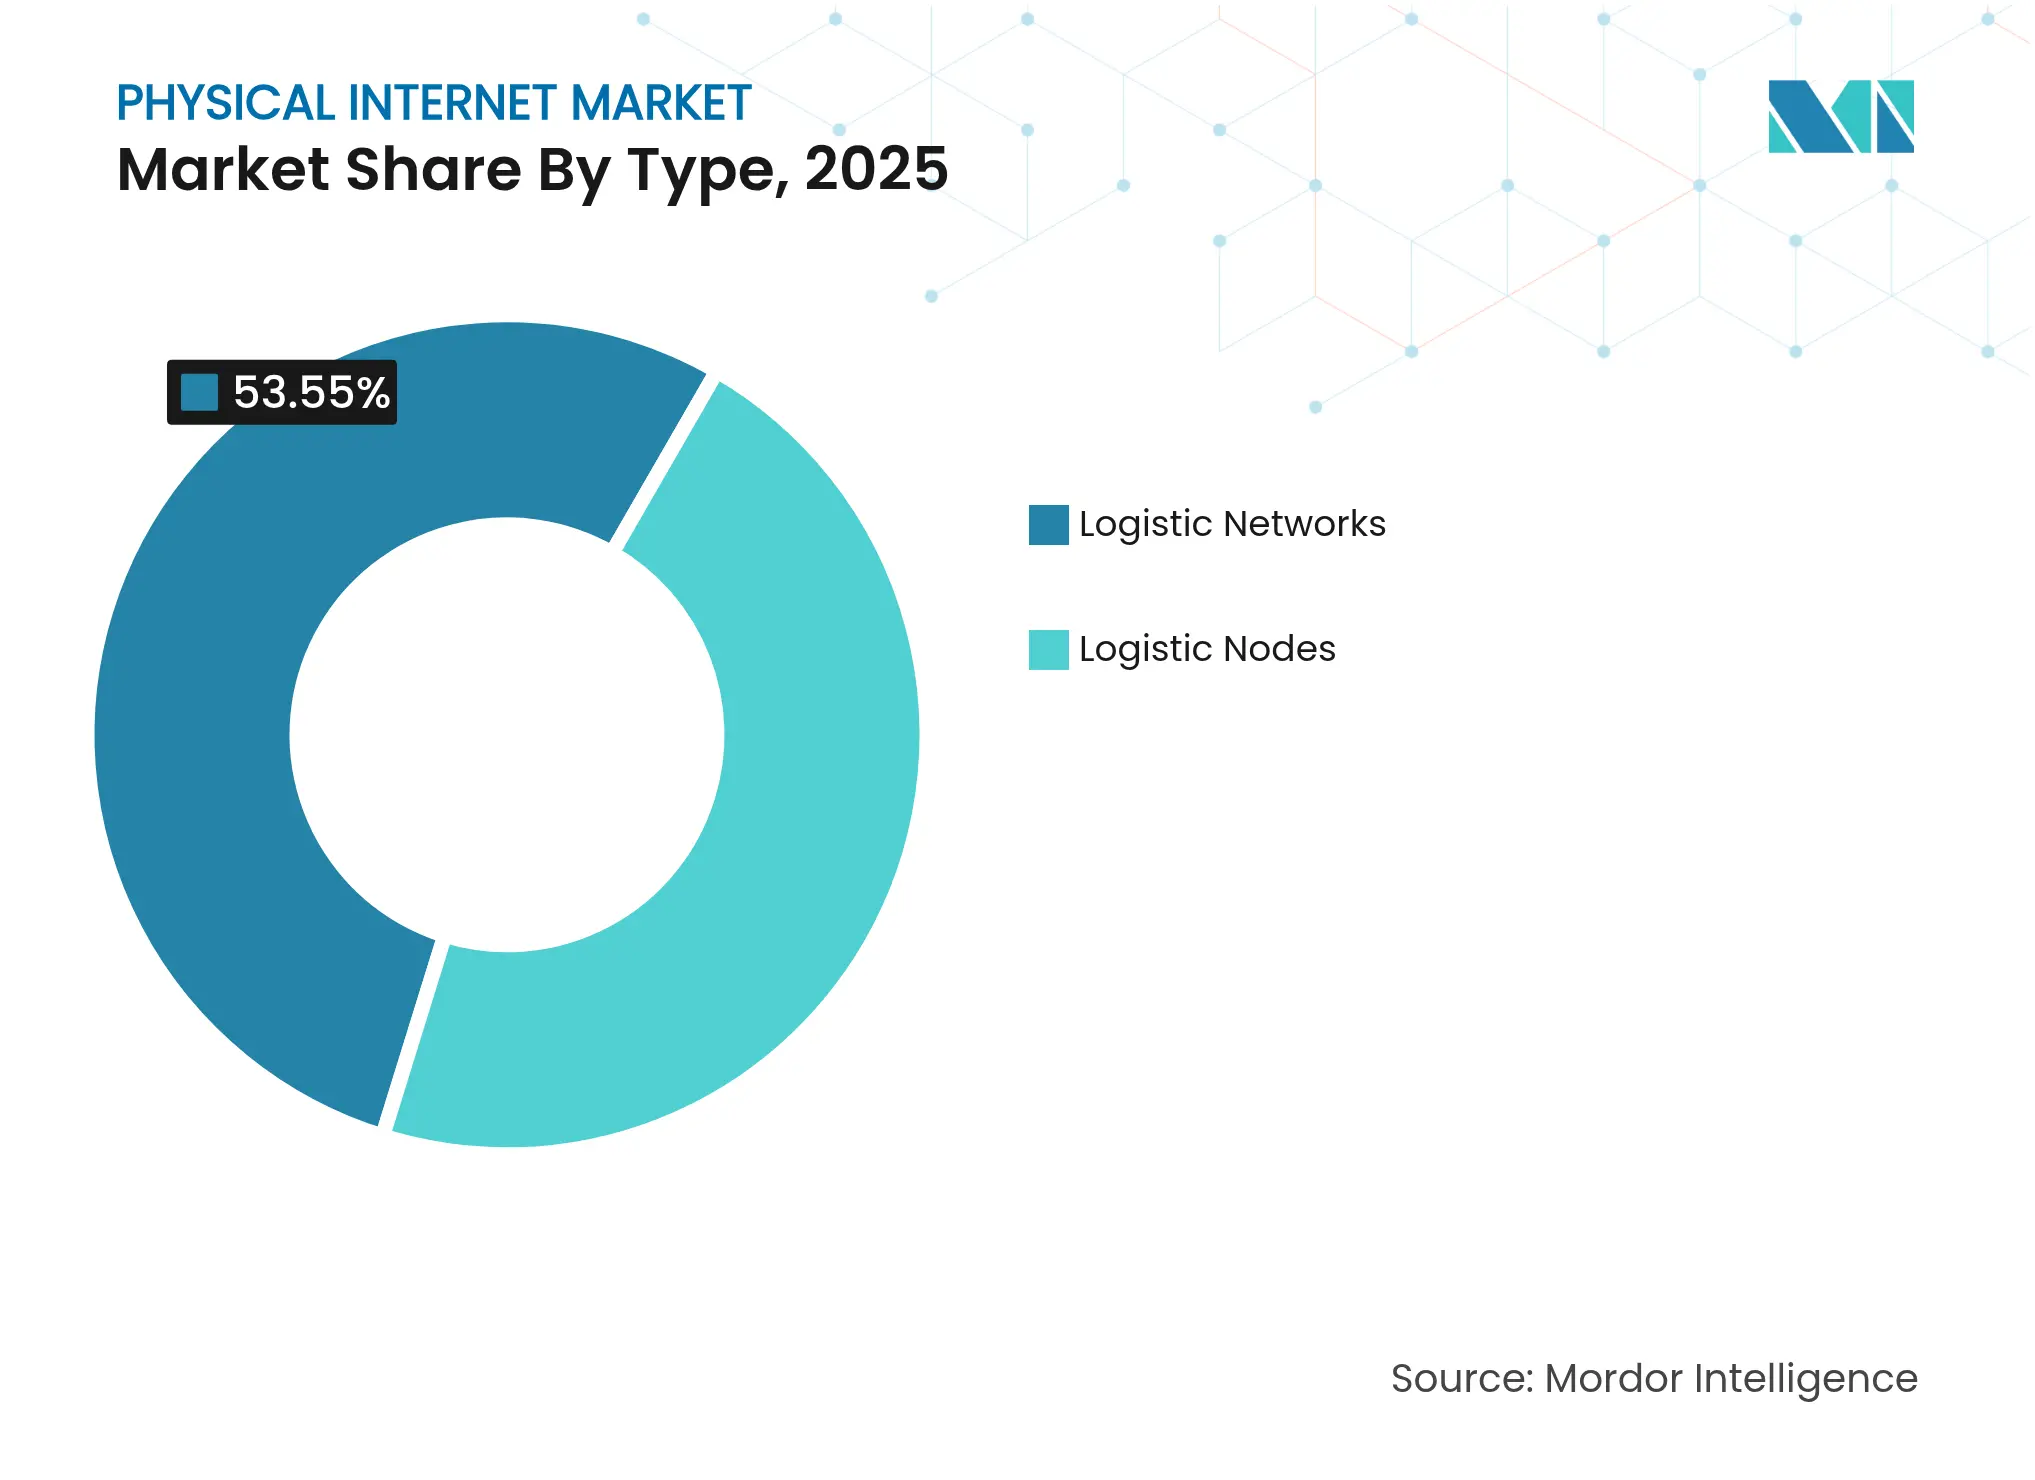
By Type: Networks Drive Orchestration Innovation
Logistic Nodes held 46.45% revenue in 2025, reflecting heavy investment in automated warehouses and cross-dock sites that shorten dwell time between modes. The Physical Internet market taps these nodes as the tangible anchor points of an increasingly software-defined ecosystem. Asset-standardization lowers handling time, enabling operators to cycle inventory faster and reduce detention fees. Companies integrate IoT sensors to track container location, temperature, and vibration, feeding data into AI models that anticipate disruptions.
Logistic Networks record the fastest 17.05% CAGR through 2031. Orchestration software layers sit above physical assets, sending routing instructions that balance cost, speed, and emissions. Generative AI inside dashboards suggests alternative lanes within seconds, informed by real-time traffic, weather, and capacity data. Amazon’s Logistics-as-a-Service strategy underscores how platform capabilities now outrank fleet size. Blockchain technology provides immutable ledgers that store multi-party transactions, building trust without central gatekeepers. As interoperability improves, the Physical Internet market expands through network effects: every new node raises the value of the entire system.
Note: Segment shares of all individual segments available upon report purchase
By Component: Services Accelerate Through Managed Complexity
Solutions stayed dominant at 57.35% in 2025 because organizations needed base platforms, modular containers, and routing engines before embracing advanced services. Early adopters invested in π-containers that click together like digital packets, reducing load consolidation time and shrinkage risk. Platforms coordinate arrival windows across several carriers, preventing line-haul bottlenecks. Edge-enabled scanners push data to the cloud in milliseconds, so human operators receive accurate ETAs without manual updates.
Services rise at a 17.55% CAGR as firms outsource complexity. Integration specialists knit legacy TMS and WMS tools into new orchestration suites. Managed logistics offerings expand subscription models where providers guarantee service-level adherence while absorbing software updates and security patching. DHL Supply Chain’s purchase of IDS Fulfilment adds 1.3 million sq. ft of space that small brands can access without long leases. Support teams tune routing algorithms weekly, reflecting fuel prices, lane congestion, and customer returns. As more shippers prefer opex over capex, service revenue captures a growing share of the Physical Internet market.
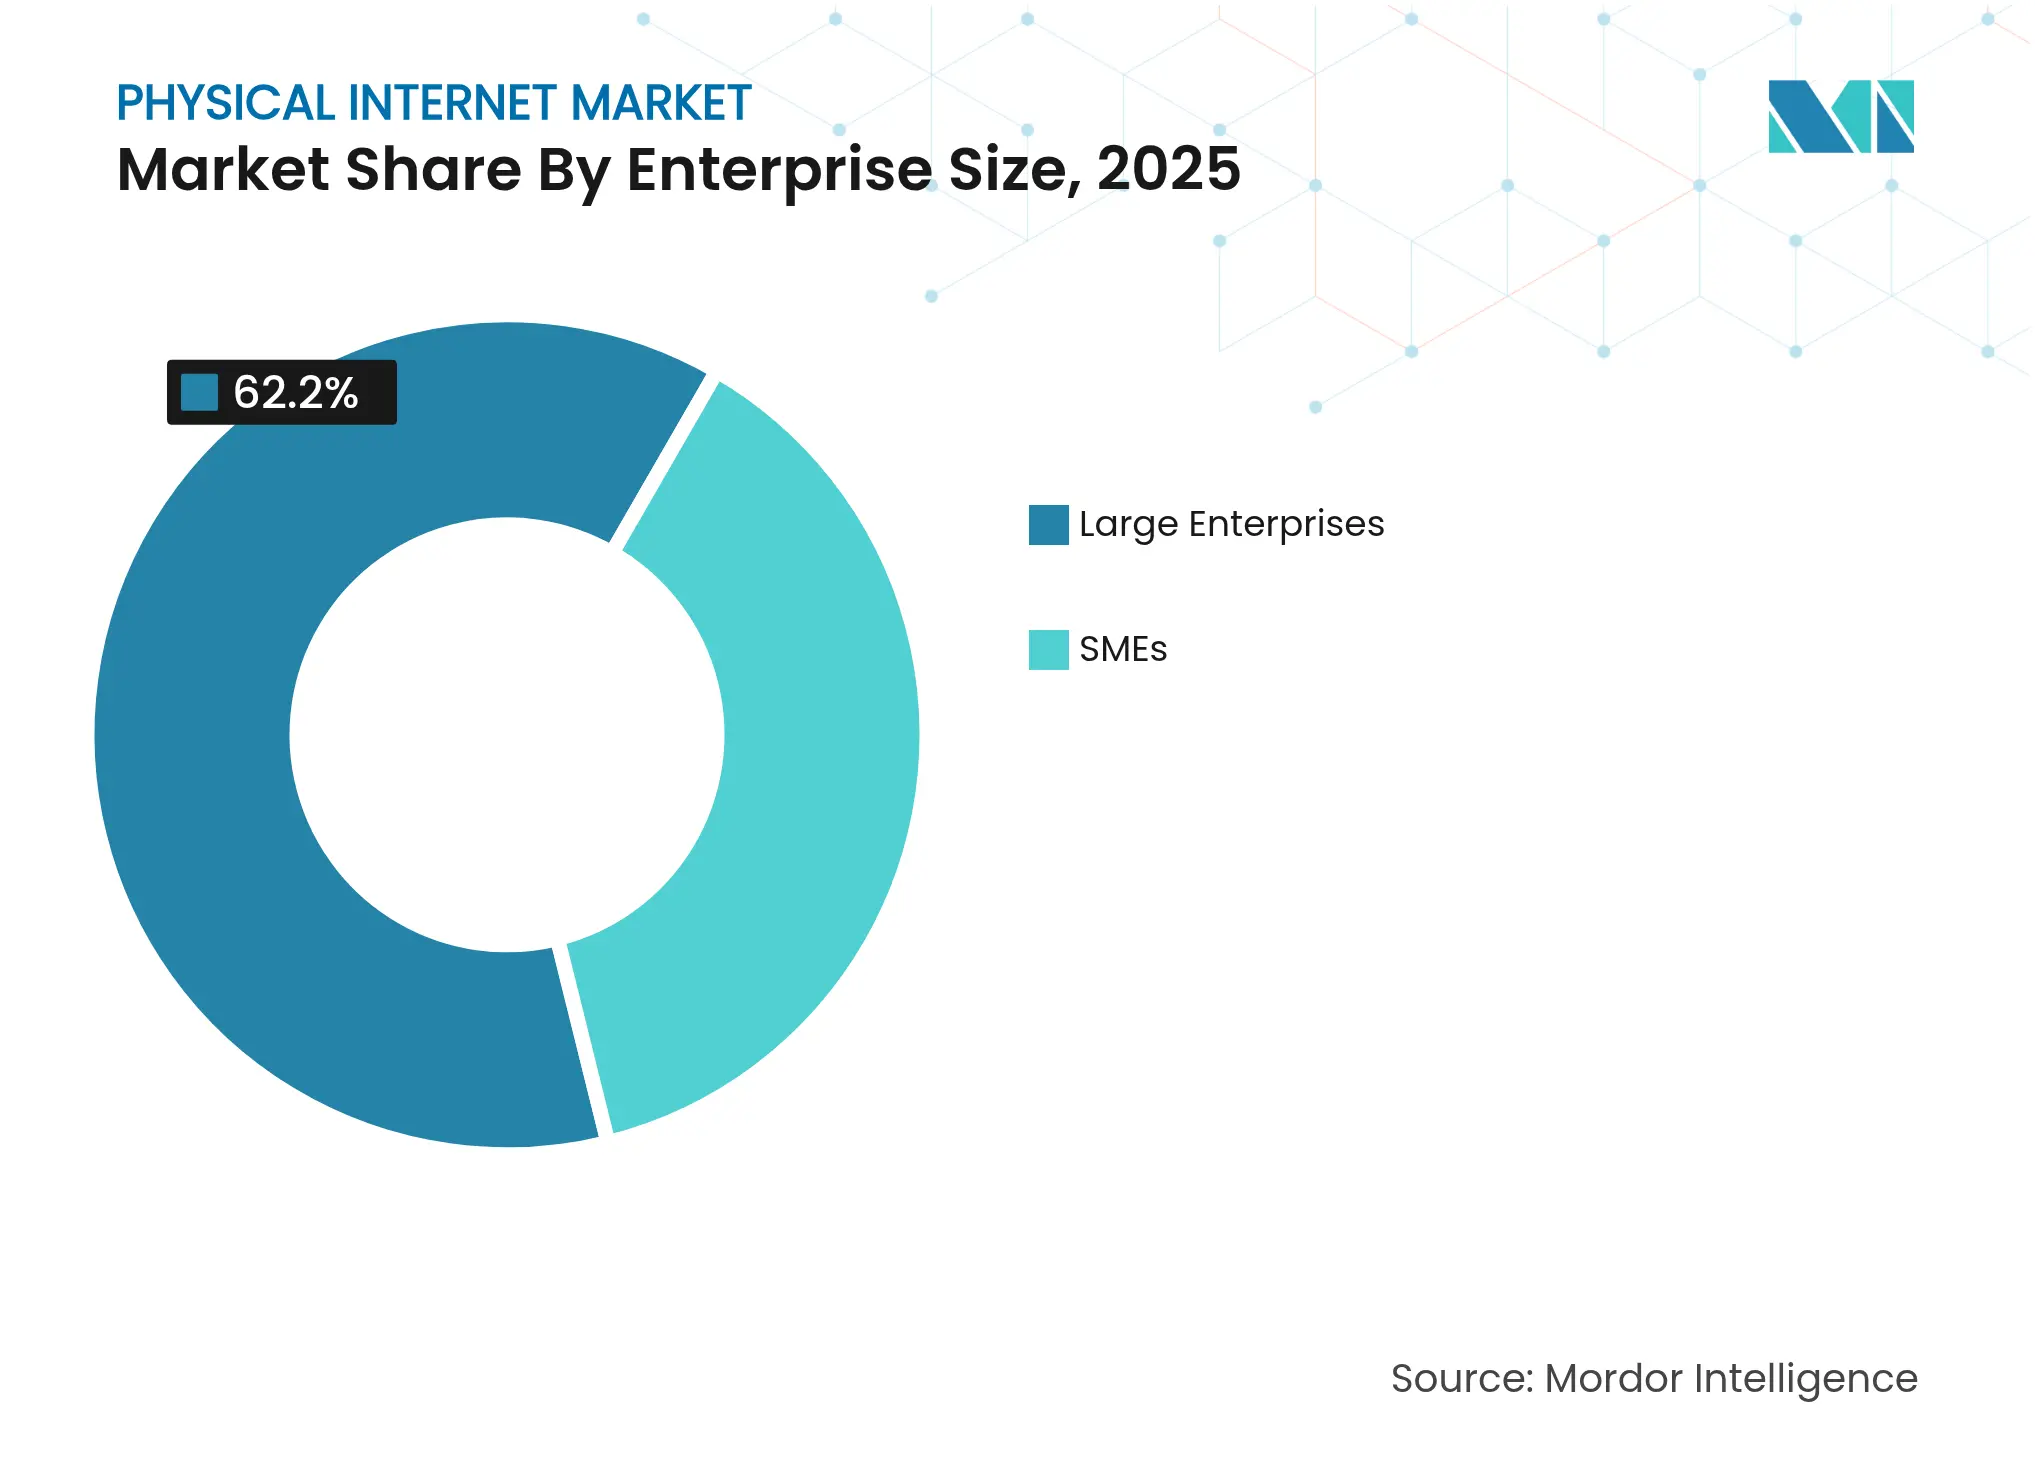
By Enterprise Size: SMEs Embrace Cloud-Native Platforms
Large Enterprises still command 62.20% revenue, using scale to negotiate carrier rates and deploy pilot projects. They consolidate buying power to secure volume discounts on robotics and sensor hardware. Complex global footprints push them to unify disparate regional systems, making them ideal early adopters of Physical Internet standards. Their pilot results from benchmarks that guide broader industry rollouts.
The SME segment, however, grows at an 17.74% CAGR. API-first platforms offer pay-as-you-go access to routing, booking, and label generation. Freight tech companies such as C.H. Robinson process 2,000 customer quotes daily by automating email ingestion. Cloud dashboards display multimodal capacity in one place, letting smaller firms compare rates typically reserved for high-volume shippers. Remote onboarding shortens time to value. Government digital voucher programs reduce subscription fees, nudging traditional exporters toward participation. The result is a broader adoption base that fuels volume growth for the Physical Internet market.
Note: Segment shares of all individual segments available upon report purchase
By End-User: Healthcare Drives Specialized Requirements
Retail & E-commerce led with 40.78% revenue in 2025 because consumers expect same-day deliveries during peak seasons. High order volumes push fulfillment centers to saturate urban areas, raising property costs. Physical Internet market logic helps by pooling micro-hubs across brands, so space utilization and labor productivity rise in tandem. Automated storage and retrieval systems reach 100+ picks per hour, keeping service levels high even during flash-sale rushes.
Healthcare shows the fastest 15.94% CAGR. Biologic drugs and personalized therapies require temperature control and chain-of-custody records. DHL invested EUR 2 billion in health-dedicated sites and purchased CRYOPDP to gain cryogenic expertise. IoT probes measure vial temperature every five seconds, with readings hashed to a blockchain for tamper-proof auditing. Regulators accept digital audit trails, reducing paperwork during customs clearance. Hospitals tap on-demand capacity to route urgent shipments through the nearest qualified node, bypassing time-consuming central storage. For stakeholders, Physical Internet market capabilities translate into better patient outcomes and lower spoilage rates.
Asia Pacific maintains the largest 36.70% revenue share and posts a 16.72% CAGR through 2031. Heavy infrastructure spending aligns with national digital agendas. China’s Belt and Road Initiative embeds logistics data layers into new ports, railways, and warehouses so cross-border documentation auto-populates, easing compliance. India’s 1,500 logistics startups, buoyed by USD 4 billion in funding, pilot AI-driven fleet management that reroutes trucks to avoid toll congestion and save fuel. Japan’s conveyor corridor between Tokyo and Osaka aims to replace 25,000 daily truck journeys, cutting highway wear and emissions. Regional governments sponsor sandbox programs where tech firms test API standards in live freight environments.
North America ranks second, leveraging mature e-commerce penetration and abundant venture capital. Digital freight matching handles the majority of spot truckloads, with platforms returning rate quotes in under two seconds. Ports such as Long Beach deploy autonomous yard tractors that feed telemetry into cloud analytics. Canadian and Mexican operators coordinate under USMCA rules that standardize documentation fields, shortening border wait times. The Physical Internet market size for this region benefits from early adoption of autonomous vehicles on select corridors, pending regulatory clearance.
Europe embraces sustainability as a strategic driver. The Starline high-speed rail initiative looks to integrate cargo coaches within 300–400 km/h passenger lines. Carbon pricing in the EU Emissions Trading System nudges shippers toward rail and inland waterways. Physical Internet market participants design algorithms that blend road, rail, and short-sea legs to optimize carbon cost per kilometer. Middle East & Africa and South America represent emerging growth arenas. Saudi Arabia invests USD 266 billion to build a hub that merges solar power with smart warehousing. Brazil, rich in agricultural exports, experiments with modular containers that move soy, corn, and beef through shared inland ports, cutting deadhead miles on return journeys.
Market Concentration
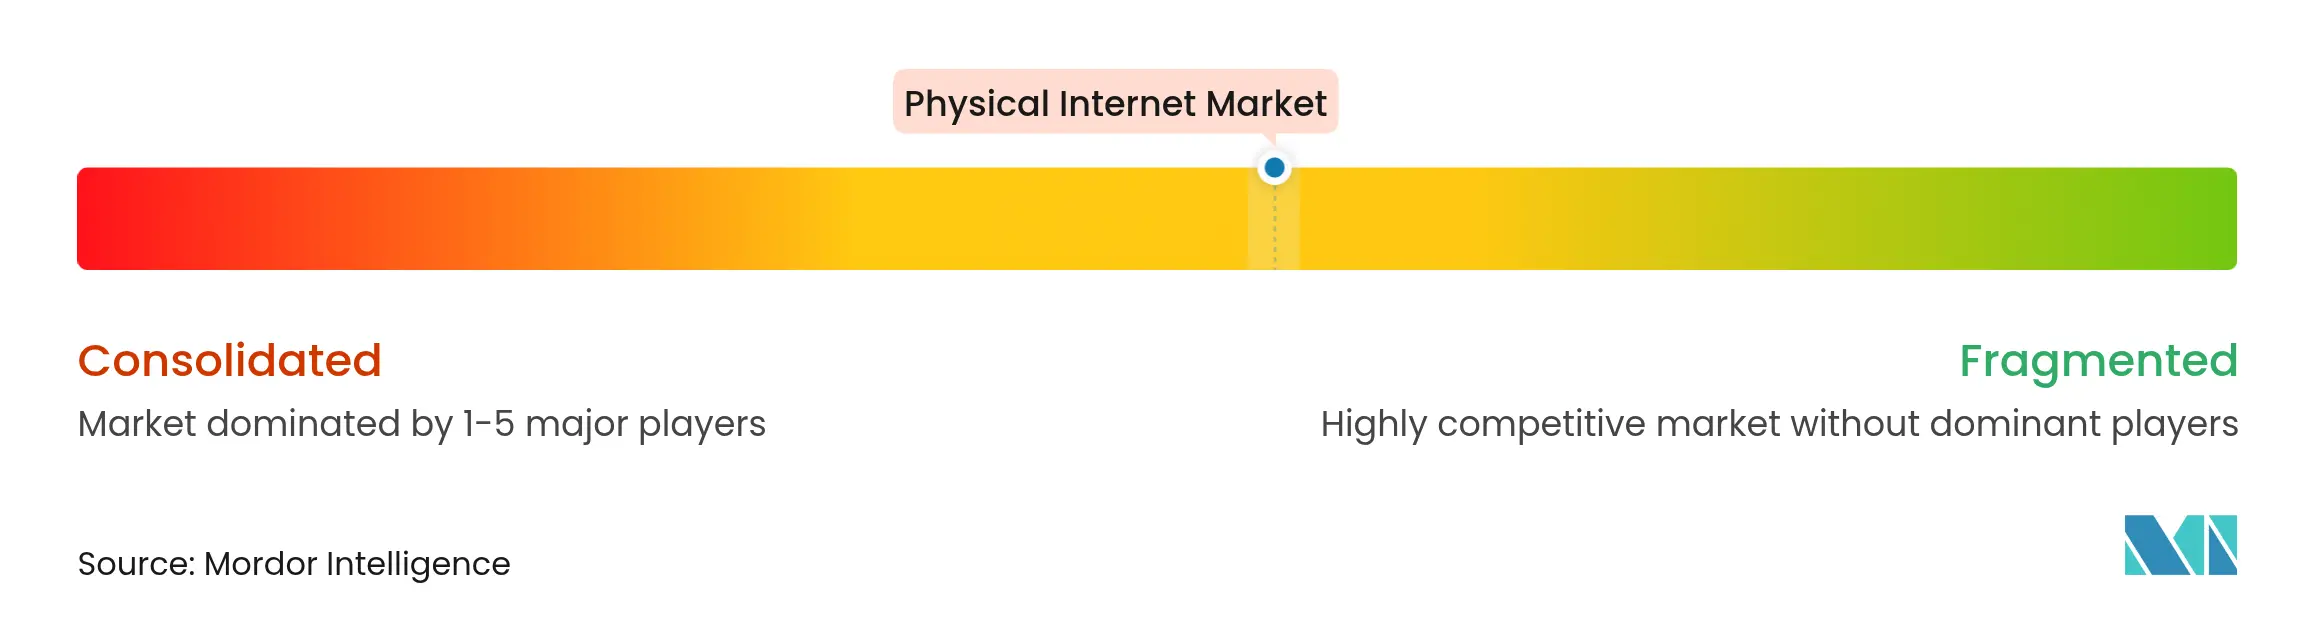
Competition is active yet dispersed. Global integrators such as DHL, DSV, and CEVA Logistics pursue scale through acquisitions, while tech specialists deliver orchestration software, visibility tools, and robotics. DSV’s EUR 14.3 billion acquisition of DB Schenker raises its worldwide headcount near 160,000, signaling a push to dominate mega-shipper contracts. Platform differentiation now hinges on AI models that crunch live data to predict exceptions and auto-rebook loads. Providers integrate cybersecurity modules to reassure clients who share capacity with former rivals.
Strategic partnerships multiply. NVIDIA pairs its Omniverse simulation stack with Alphabet’s cloud AI to shorten robot training cycles. Symbotic purchased Walmart’s robotics unit for USD 200 million, locking an order backlog worth USD 5 billion. Blue-chip retailers gain exclusive early access to patented technology, while robotics vendors secure steady deployment pipelines. Blockchain consortia focus on smart contracts that auto-release payments once IoT sensors confirm delivery, reducing receivables cycles.
The Physical Internet market awards speed to innovators who standardize interfaces. Open API guilds draft spec revisions every quarter, which smaller 3PLs adopt to stay eligible for contracts with Fortune 500 shippers. Early movers accumulate data that refines routing models, creating feedback loops that widen the performance gap. Incumbents without digital roadmaps face margin compression as freight becomes a commoditized capacity widget. Investors favor firms that bundle software with operational know-how, believing blended models will control the lion’s share of value creation.

*Disclaimer: Major Players sorted in no particular order
1. INTRODUCTION
2. RESEARCH METHODOLOGY
3. EXECUTIVE SUMMARY
4. MARKET LANDSCAPE
5. MARKET SIZE AND GROWTH FORECASTS (VALUE)
6. COMPETITIVE LANDSCAPE
7. MARKET OPPORTUNITIES AND FUTURE OUTLOOK
Market Definitions and Key Coverage
Segmentation Overview
Detailed Research Methodology and Data Validation
Primary Research
Desk Research
Market-Sizing & Forecasting
Data Validation & Update Cycle
Why Mordor's Physical Internet Baseline Proves Dependable
Benchmark comparison
| Market Size | Anonymized source | Primary gap driver | ||
|---|---|---|---|---|
USD 17.56 B (2025) | Mordor Intelligence | - | Anonymized source:Mordor Intelligence | Primary gap driver:- |
USD 16.12 B (2025) | Global Consultancy A | Omits service revenues from multi-tenant orchestration platforms | ||
USD 38.60 B (2024) | Trade Journal B | Adds broader connected-logistics software and legacy warehousing | ||
USD 4.25 B (2025) | Industry Association C | Counts only funded pilot nodes in three regions |
Pricing Strategy for Semiconductor Components
3 Min Read
Accelerating Additive Manufacturing Adoption in India
3 Min Read
Wealth Management Intelligence for the Middle East
4 Min Read
When decisions matter, industry leaders turn to our analysts. Let’s talk.