Used Tractors Market Size and Share
Market Overview
| Study Period | 2021 - 2031 |
|---|---|
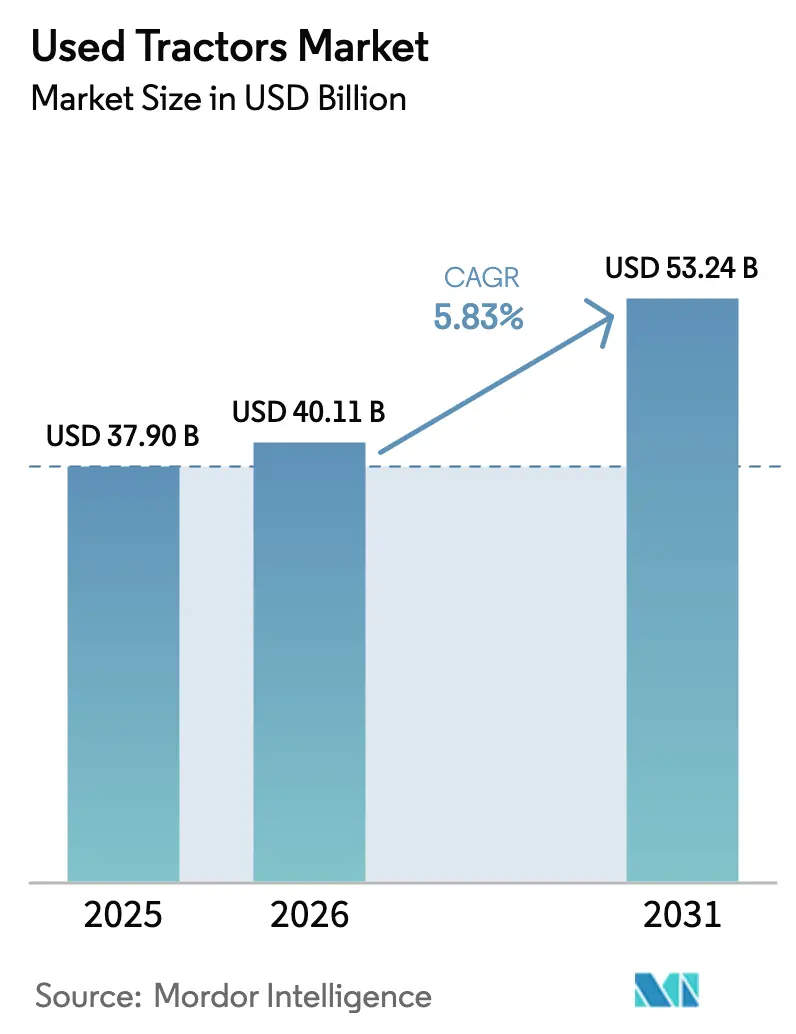
| Market Size (2026) | USD 40.11 Billion |
| Market Size (2031) | USD 53.24 Billion |
| Growth Rate (2026 - 2031) | 5.83% CAGR |
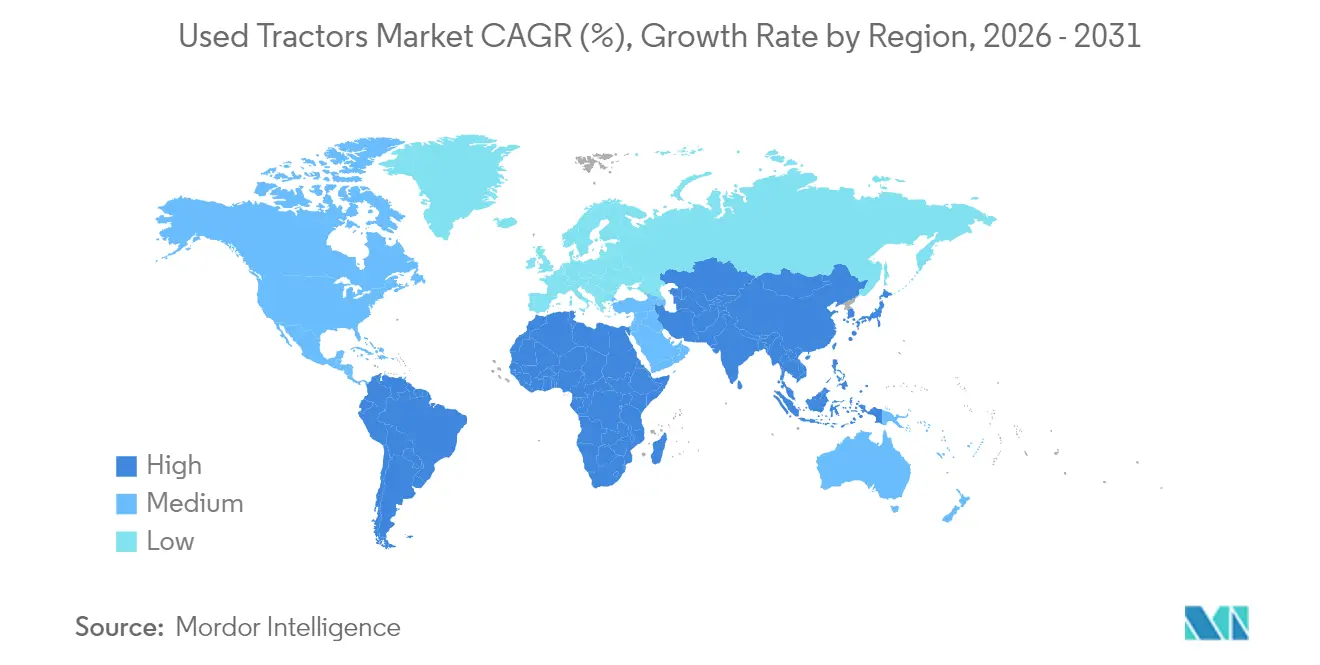
| Fastest Growing Market | Asia Pacific |
| Largest Market | Asia Pacific |
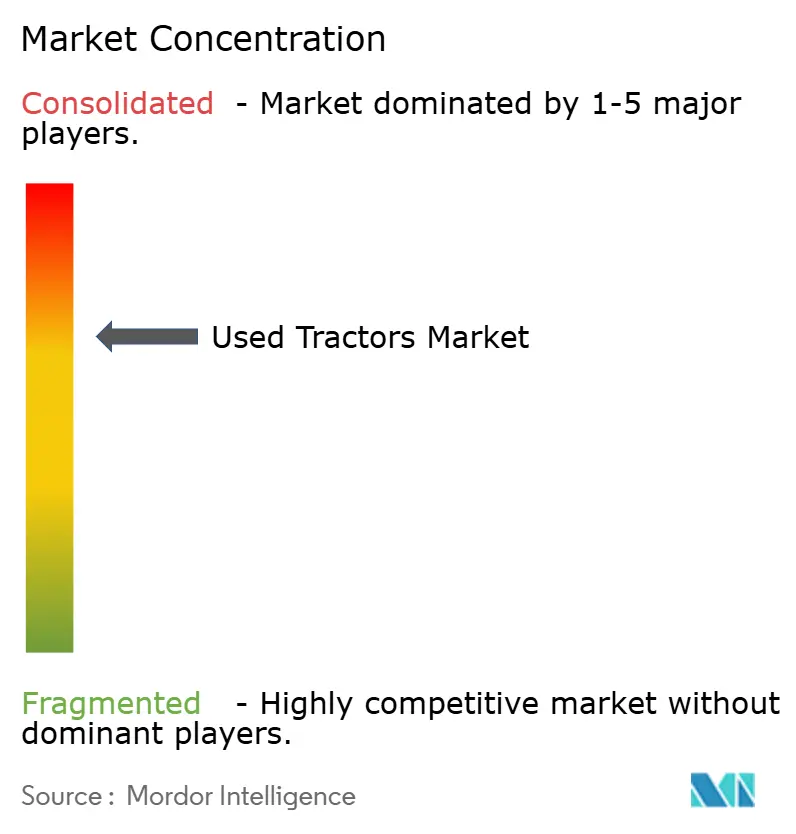
| Market Concentration | Medium |
Major Players *Disclaimer: Major Players sorted in no particular order Image © Mordor Intelligence. Reuse requires attribution under CC BY 4.0. | |
Used Tractors Market Analysis by Mordor Intelligence
The used tractor market size was valued at USD 37.9 billion in 2025 and estimated to grow from USD 40.11 billion in 2026 to reach USD 53.24 billion by 2031, at a CAGR of 5.83% during the forecast period (2026-2031). The increasing prices of new equipment and stricter farm credit requirements drive buyers toward pre-owned machinery. Farm consolidation provides a consistent supply of low-hour tractors, while certified pre-owned (CPO) programs address quality concerns and maintain resale values. Equipment dealers expand their market presence through online platforms, providing farmers in remote regions access to extensive inventories and transparent pricing. The Section 179 tax deduction of USD 1.25 million in 2025 reduces equipment acquisition costs, supporting regular fleet updates and strengthening the used tractor market.[1]Internal Revenue Service, “Section 179 Deduction and Bonus Depreciation,” irs.gov
Key Report Takeaways
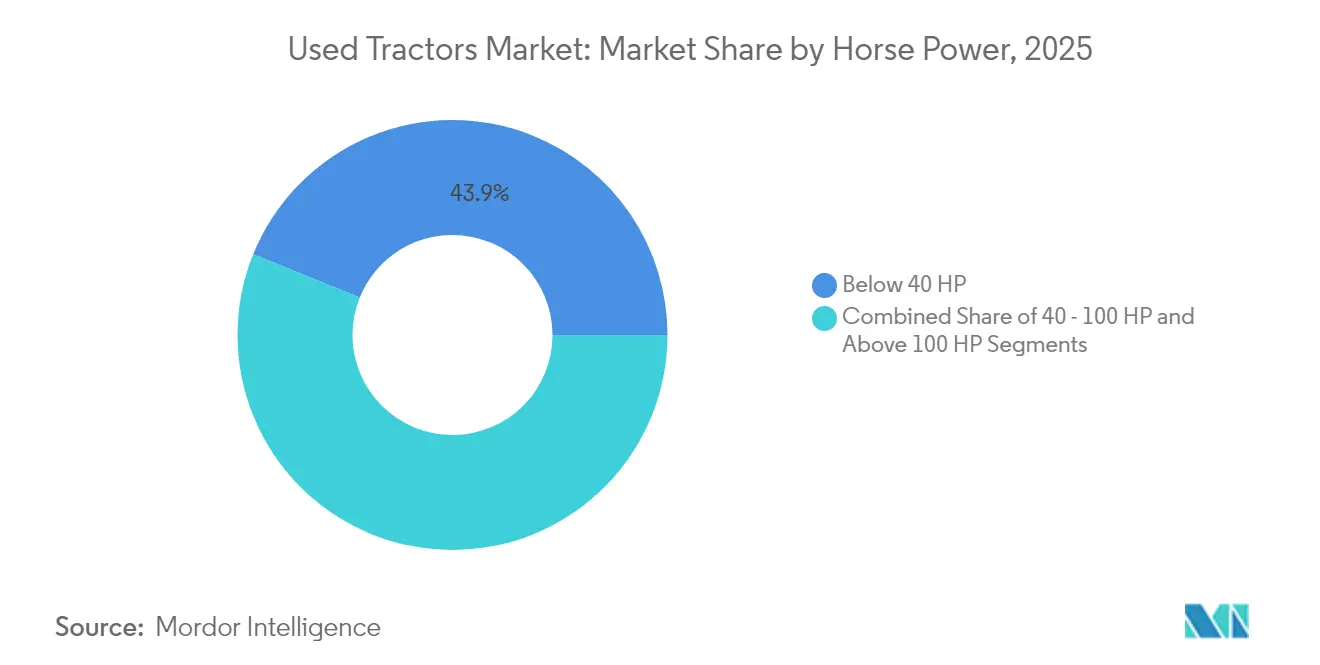
- By horsepower, below 40 HP tractors dominated with 43.88% market share in 2025, while the above 100 HP segment is anticipated to grow at a 7.15% CAGR through 2031.
- By drive type, 2-wheel drive tractors held 80.12% market share in 2025, while 4-wheel drive tractors are projected to grow at a 8.79% CAGR through 2031.
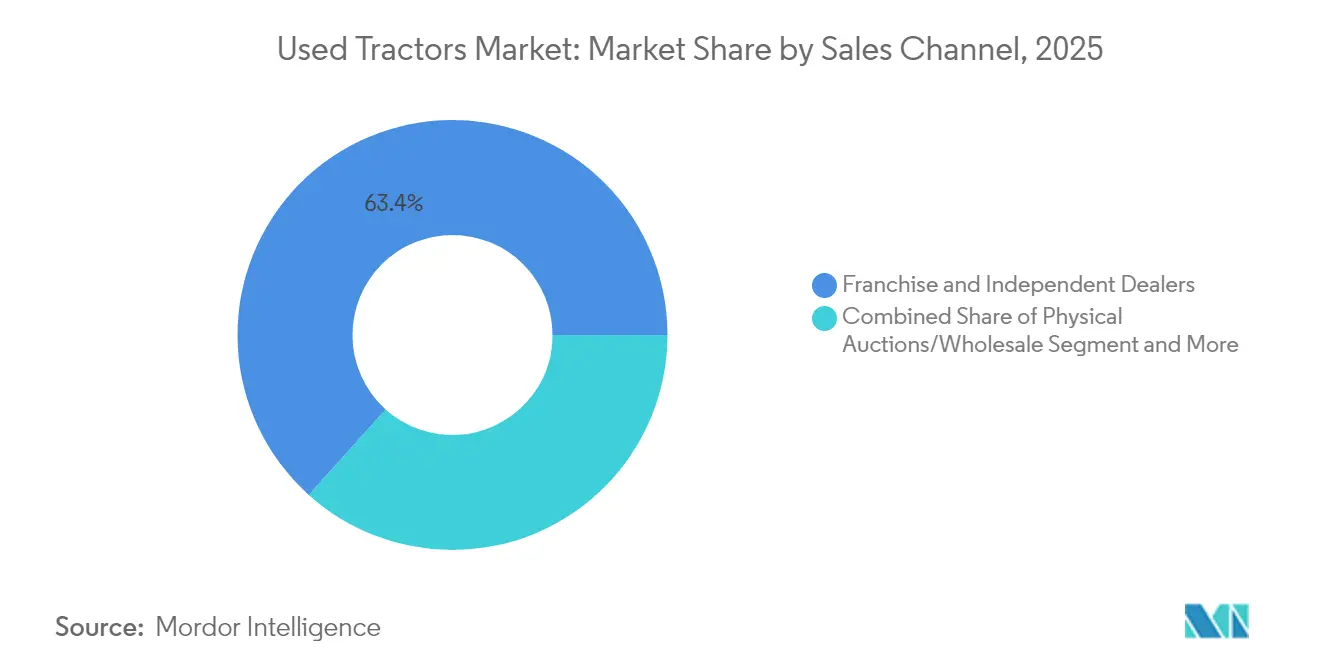
- By sales channel, franchise and independent dealers held 63.35% market share in 2025, while online marketplaces are projected to grow fastest at 13.05% CAGR through 2031.
- By tractor types, compact/utility models accounted for 47.05% of revenue in 2025, while row-crop tractors are forecast to grow at 7.36% CAGR during 2026-2031.
- By region, Asia-Pacific dominated the market with 45.02% share in 2025 and is projected to grow at 7.92% CAGR during 2026-2031.
- Deere & Company, CNH Industrial N.V., and AGCO Corporation held a combined 41.12% share of the used tractors market in 2025.
Note: Market size and forecast figures in this report are generated using Mordor Intelligence’s proprietary estimation framework, updated with the latest available data and insights as of 2026.
Global Used Tractors Market Trends and Insights
Drivers Impact Analysis*
| Driver | (~) % Impact on CAGR Forecast | Geographic Relevance | Impact Timeline |
|---|---|---|---|
| Expanding availability of digital auction platforms | +1.2% | Global, strongest in North America and Europe | Short term (≤ 2 years) |
| Certified pre-owned (CPO) programs gaining trust | +0.8% | North America and Europe core, expanding to Asia-Pacific | Medium term (2–4 years) |
| Escalating new tractor prices and high interest rates | +1.5% | Global, most pronounced in developed markets | Short term (≤ 2 years) |
| Accelerating farm consolidation | +0.9% | North America and Europe, emerging in Asia-Pacific | Long term (≥ 4 years) |
| Government subsidy spill-over to used tractors | +0.6% | Regional, policy-active markets | Medium term (2–4 years) |
| Sustainability focus-reuse over new manufacturing | +0.4% | Europe and North America, expanding globally | Long term (≥ 4 years) |
| Source: Mordor Intelligence | |||
Expanding Availability of Digital Auction Platforms
Mobile auction platforms have expanded equipment sales beyond geographic boundaries and enabled real-time price discovery. According to BigIron Auctions, approximately 70% of its equipment transactions are completed through smartphones, demonstrating farmers' adoption of digital bidding platforms. The increased number of bidders improves market liquidity, reduces time to sale, and decreases dealer margins that were previously based on local market knowledge. Detailed images, inspection reports, and equipment performance data enable buyers to make informed decisions without physical inspections, maintaining market activity during travel restrictions. The merger of digital auction platforms has increased market reach and supported stable pricing in the used tractor market.
Certified Pre-Owned (CPO) Programs Gaining Trust
Certified Pre-Owned (CPO) programs establish premium categories that reduce the perceived risk compared to new equipment. John Deere certifies only tractors less than 3 years old with under 1,500 operating hours after completing a 170-point inspection, and includes transferable warranties and service credits. Fendt provides two-year component coverage on inspected units, primarily sourcing from lease returns to ensure recent manufacturing specifications. While customers pay 15-20% more than non-certified equipment, they receive verified equipment condition and comprehensive after-sale support, which increases resale values across the used tractor market.
Escalating New Tractor Prices and High Interest Rates
Agricultural tractor manufacturers offer new high-horsepower tractors at prices exceeding USD 700,000, while late-model used combines maintain a market value of approximately USD 450,000. This price differential continues to expand, despite used equipment values experiencing a 40-60% increase since 2019. The substantial increase in farm-loan rates, currently approaching triple their 2019 levels, has influenced agricultural operators to select used tractors due to more favorable payback periods. Agricultural enterprises increasingly favor upgrades through recent pre-owned units rather than assuming new-equipment debt obligations, thereby strengthening market demand and expanding the segment for late-model used tractors.
Accelerating Farm Consolidation
The number of farms in the United States continues to decline while the average farm size increases. As farm owners retire, they sell their equipment fleets, which often have minimal usage hours, contributing to the used tractor market supply.[2]Farm Equipment, “North American Dealer Report 2025,” farmequipment.com Dealership consolidation follows a similar trend, with groups closing low-performing locations while increasing their total store count through acquisitions. Larger farming operations maintain detailed equipment maintenance records, which enhances transparency and enables higher resale values.
Restraints Impact Analysis*
| Restraint | (~) % Impact on CAGR Forecast | Geographic Relevance | Impact Timeline |
|---|---|---|---|
| Opaque equipment histories lowering residual values | -0.7% | Global, most acute in fragmented markets | Medium term (2–4 years) |
| Limited financing options for old tractors | -0.5% | Developing markets, selective in developed regions | Short term (≤ 2 years) |
| Rising maintenance-cost inflation on legacy models | -0.6% | Global, parts-availability driven | Long term (≥ 4 years) |
| Price variations between retail and auction markets | -0.4% | North America and Europe | Short term (≤ 2 years) |
| Source: Mordor Intelligence | |||
Opaque Equipment Histories Lowering Residual Values
Agricultural tractors lack standardized service documentation, unlike automobiles. Tractors without maintenance records sell at 20-30% lower prices compared to those with documented service histories, according to dealer surveys. The absence of standardized equipment identification and tracking systems, similar to vehicle identification numbers in automobiles, makes it difficult to maintain comprehensive equipment histories across ownership changes and regions. Potential buyers cannot access insurance claims histories that would provide information about equipment condition and usage patterns. These information gaps reduce market values and efficiency.
Rising Maintenance-Cost Inflation on Legacy Models
The rising cost of replacement parts and the decreasing number of technicians skilled in mechanical systems increase the lifetime repair expenses. Research indicates that repair and maintenance costs can reach 48.6% of the original purchase price at 12,000 operating hours, leading operators to replace rather than repair aging tractors.[3]American Society of Agricultural and Biological Engineers, “Repair-and-Maintenance Cost Benchmarking,” asabe.org The maintenance costs vary significantly among manufacturers and equipment models. While some manufacturers maintain consistent parts availability and service support for older equipment, others provide limited support for legacy products. This variation creates differences in long-term ownership costs, which buyers need to evaluate when purchasing used equipment.
*Our forecasts treat driver/restraint impacts as directional, not additive. The impact forecasts reflect baseline growth, mix effects, and variable interactions.
Segment Analysis
By Horsepower: Compact Dominance Amid High-Power Acceleration
Below 40 HP tractors account for 43.88% of 2025 revenue in the used tractor market, maintaining their dominant position through strong demand from small farms and landscaping operations. These units retain market appeal due to their low operating costs, transportation convenience, and compatibility with various attachments, despite declining new tractor sales. The Above 100 HP segment is projected to grow at a 7.15% CAGR, driven by large-scale grain and specialty-crop operations seeking to optimize efficiency with fewer, higher-capacity tractors. This segment shows the highest growth potential among all categories, supported by the increasing availability of certified pre-owned units and precision agriculture technology upgrades.
The compact tractor segment maintains stable inventory levels due to frequent turnover from lifestyle buyers. High-end tractors above 150 HP demonstrate rapid inventory turnover with strong profit margins. The planned introduction of autonomous retrofit technology in 2025 may increase equipment longevity and resale values, potentially accelerating the sale of conventional models by current owners.


By Drive Type: 2WD Stability Versus 4WD Innovation
Two-wheel-drive units accounted for 80.12% market share in 2025, primarily due to their simpler driveline architecture and lower acquisition costs. This configuration maintains high liquidity in the used tractor market. Four-wheel-drive configurations are projected to grow at 8.79% annually, driven by their ability to address soil-compaction issues and handle variable terrain. In row-crop operations requiring consistent power delivery under load, the increasing adoption of 4WD tractors indicates a transition toward technology-supported agronomic practices. The used tractor market for advanced-traction models is anticipated to expand as more late-model units complete their lease cycles.
While price premiums for 4WD tractors remain high, the yield advantages from reduced slippage support second-hand demand, particularly in regions where carbon-tillage programs offer incentives for improved fuel efficiency.
By Sales Channel: Digital Disruption Reshaping Distribution
Franchise and independent dealerships account for 63.35% of 2025 sales, while online marketplaces grow at a 13.05% CAGR, influencing equipment discovery and price negotiation patterns. The used tractor market operates through multiple channels, with buyers researching equipment online before conducting in-person inspections. Auction houses facilitate bulk sales, while rental fleet returns provide certified pre-owned (CPO) units with limited operating hours. Dealerships implementing virtual equipment tours and telematics-based maintenance records report faster sales cycles and expanded market reach.
Small-town dealerships are incorporating third-party auction platforms into their operations to manage inventory levels effectively and maintain competitive market positioning in the digital marketplace.
By Tractor Type: Utility Leadership Amid Row-Crop Momentum
Compact/utility tractors accounted for 47.05% of segment revenue in 2025, reflecting their versatility across applications. Sub-compact tractors are effective for estate maintenance, while orchard-specific models navigate narrow rows without damaging tree canopies. Row-crop tractors are anticipated to grow at a CAGR of 7.36%, driven by precision steering systems and variable-rate technology adoption. The extensive electronic components in these tractors have created a segmented resale market where equipment operational history through telematics is essential. Farmers implementing data-driven practices prefer row-crop tractors with ISOBUS compatibility, contributing to increased sales volumes and stable prices.
Geography Analysis
Asia-Pacific holds the largest market share at 45.02% in 2025 and is projected to grow at a CAGR of 7.92% during 2026-2031. India represents 36% of global tractor registrations, providing a substantial source of second-hand equipment. Domestic manufacturers such as Mahindra produce over 150,000 units annually, with excess inventory exported to Africa through established distribution channels. China's mechanization initiatives and government subsidies increase demand for quality used imports, while Japan's aging agricultural workforce creates regular machinery turnover. Although financing accessibility varies across the region, digital lending platforms are improving credit access for small-scale farmers, expanding the used tractor market.
North America maintains a significant market presence through high mechanization rates, financially stable agricultural operations, and developed dealer financing systems. The Canadian 4WD tractor segment remains strong despite overall market moderation, indicating sustained investment in agricultural expansion. Mexico's increasing mechanization and equipment flow from U.S. dealers creates new market opportunities despite varying financial frameworks.
Europe maintains a strong market position, with tractor registrations reaching 230,000 units in 2024, marking a ten-year peak. Germany and France continue as primary markets, while Italy and Poland demonstrate double-digit growth driven by Common Agricultural Policy (CAP) modernization funding European Union circular economy regulations emphasizing repair over replacement support Certified Pre-Owned (CPO) adoption, particularly for late-model Tier V-compliant equipment.

Competitive Landscape
The market shows moderate consolidation, with Deere & Company, CNH Industrial N.V., and AGCO Corporation holding a combined 41.5% market share in 2024. John Deere implements a comprehensive lifecycle model that integrates trade-ins, factory refurbishment, and extended warranties to maintain customer loyalty. CNH Industrial N.V. utilizes its extensive Case IH and New Holland dealership network to secure lease returns for certified pre-owned (CPO) programs. AGCO Corporation enhances residual values through extended telematics subscriptions across its Fendt and Massey Ferguson product lines, generating data-driven service revenue. These three companies managed 58% of CPO volume in 2024.
Online platforms such as BigIron Auctions and TractorHouse increase market transparency by providing real-time pricing information to buyers. Independent refurbishment companies serve areas with limited OEM dealer presence by accessing components through global salvage networks. Technology providers, particularly AGCO Corporation with its 2025 OutRun autonomous retrofit system, introduce new capabilities to existing fleets, increasing equipment longevity and maintaining resale values.
Market competition focuses on after-sales support, financing options, and software integration capabilities beyond mechanical specifications. Manufacturers offering over-the-air updates and open-format data sharing systems are well-positioned to capture significant market share in the used tractor segment.
Used Tractors Industry Leaders
Deere & Company
CNH Industrial N.V.
AGCO Corporation
Mahindra & Mahindra Ltd.
Kubota Corporation
- *Disclaimer: Major Players sorted in no particular order

Recent Industry Developments
- May 2025: Deere & Company committed USD 20 billion to expand U.S. capacity for 9RX high-horsepower tractors, a move likely to increase the secondary supply of earlier 9R series units.
- March 2025: AGCO Corporation launched OutRun autonomous retrofit kits, offering subscription-based driverless operation across mixed-brand fleets.
- August 2024: AGCO released four Fendt 600 Vario models (149–209 HP) aimed at mixed-crop farms seeking mid-range power with premium comfort
- July 2024: Mahindra & Mahindra Ltd. reported a 6% Y/Y rise in June domestic tractor sales to 45,888 units, while exports grew 28% to 1,431 units.


Research Methodology Framework and Report Scope
Market Definitions and Key Coverage
Our study defines the global used tractors market as the resale value generated when farm tractors with at least one prior owner return to field service. Transactions counted cover dealer trade-ins, lease returns, live or online auctions, and documented farmer-to-farmer sales. Values reflect the final price paid in US dollars.
Scope Exclusions: Industrial or construction tractors, detachable implements, and refurbishing-service revenue lie outside scope.
Segmentation Overview
- By Horsepower
- Below 40 HP
- 40 -100 HP
- Above 100 HP
- By Drive Type
- 2-Wheel Drive (2WD)
- 4-Wheel Drive (4WD)
- By Sales Channel
- Franchise and Independent Dealers
- Physical Auctions/Wholesale
- Online Marketplaces
- Rental and Lease Return Sales
- By Tractor Type
- Compact/Utility Tractors
- Row-Crop Tractors
- Orchard and Vineyard Tractors
- Garden/Sub-Compact Tractors
- By Geography
- North America
- United States
- Canada
- Mexico
- Rest of North America
- Europe
- Germany
- United Kingdom
- France
- Spain
- Italy
- Russia
- Rest of Europe
- Asia-Pacific
- India
- China
- Japan
- South Korea
- Australia
- New Zealand
- Rest of Asia-Pacific
- South America
- Brazil
- Argentina
- Rest of South America
- Middle East
- Turkey
- Saudi Arabia
- United Arab Emirates
- Rest of Middle East
- Africa
- South Africa
- Rest of Africa
- North America
Detailed Research Methodology and Data Validation
Primary Research
Mordor analysts next interview franchised and independent dealers, marketplace managers, auctioneers, and farm lenders in North America, Europe, India, and Brazil. Their notes on turnover cycles, discount ladders, and favored horsepower bands tighten assumptions and close gaps.
Desk Research
We map unit flows with USDA NASS fleet counts, Eurostat registrations, FAO trade tables, UN Comtrade codes, and Sandhills Global price indexes. National farm-income dashboards show buying power, while D&B Hoovers and Marklines enrich firm footprints. The sources named illustrate, not exhaust, the secondary base supporting our work.
Market-Sizing & Forecasting
A top-down build converts active-fleet and retirement curves into the yearly resale pool, then applies segment average selling prices. Sample dealer lots and web listings give a bottom-up sense check. Core drivers modeled include new-tractor price inflation, fleet age, farm net income, online marketplace reach, and the 40-100 HP share trend. Multivariate regression, back-tested on five years, produces the 2025-2030 view.
Data Validation & Update Cycle
Outputs pass two analyst reviews, an automated variance scan, and cross-checks with external shipment values. Reports refresh yearly, with mid-cycle tweaks when droughts, subsidy changes, or currency swings move the market.
Why Mordor's Used Tractors Baseline Holds Fast
Published estimates often diverge because firms pick different asset scopes, price anchors, and refresh rhythms. Gaps widen when others fold rental disposals or overlook low-value peer sales that our model captures.
Benchmark comparison
| Market Size | Anonymized source | Primary gap driver |
|---|---|---|
| USD 37.9 B (2025) | Mordor Intelligence | - |
| USD 33.7 B (2024) | Regional Consultancy A | Excludes online trades and Asia smallholder resales |
| USD 57.7 B (2024) | Global Consultancy B | Adds rental disposals and refurb revenue |
| USD 3.3 B (2025) | Industry Association C | Tracks only sub-100 HP diesel units in six nations |
These contrasts show how our clear scope, multi-source checks, and annual refresh give decision-makers a balanced, traceable baseline.


Key Questions Answered in the Report
What is the current size of the used tractor market?
The used tractor market is valued at USD 40.11 billion in 2026 and is projected to reach USD 53.24 billion by 2031.
Which horsepower segment leads the market?
Below 40 HP tractors lead with 43.88% revenue share, while Above 100 HP models grow the fastest at a 7.15% CAGR.
How are digital platforms influencing used-tractor sales?
Online auctions handle most of the secondary-equipment transactions, expanding buyer reach and improving price transparency.
What role do certified pre-owned programs play?
CPO schemes increase buyer confidence through multi-point inspections and warranty coverage, commanding 15–20% price premiums over non-certified units.
Which region is growing the fastest?
Asia-Pacific shows the highest growth rate, driven by India’s large tractor fleet, China’s mechanization push, and improving credit access for smallholders.
How do Section 179 incentives affect purchases?
U.S. buyers can deduct up to USD 1.25 million on qualifying equipment, lowering net costs and accelerating replacement cycles, including used assets.
Page last updated on:


