
Market Overview
| Study Period | 2021 - 2031 |
|---|---|
| Forecast Data Period | 2026 - 2031 |
| Base Year Market Size (2025) | USD 35 Billion |
| Market Size (2026) | USD 36.45 Billion |
| Market Size (2031) | USD 44.64 Billion |
| Growth Rate (2026 - 2031) | 4.14 % |
| Market Concentration | High |
Major Players *Disclaimer: Major Players sorted in no particular order Image © Mordor Intelligence. Reuse requires attribution under CC BY 4.0. | |
North America Agricultural Tractor Machinery Market Analysis by Mordor Intelligence
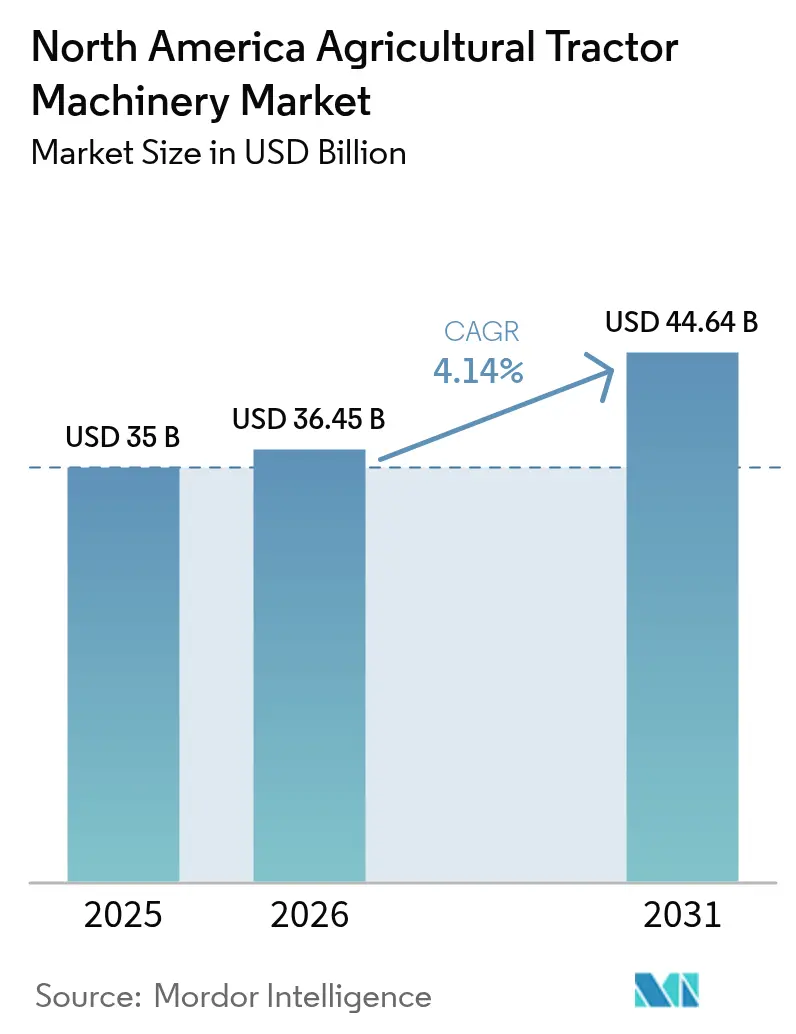
North America agricultural tractor machinery market size in 2026 is estimated at USD 36.45 billion, growing from 2025 value of USD 35 billion with 2031 projections showing USD 44.64 billion, growing at 4.14% CAGR over 2026-2031. The combination of labor shortages, climate-smart incentives, and the first commercially viable autonomous and electric tractor platforms is reshaping demand patterns. Growers are replacing aging fleets not to expand acreage but to raise productivity per acre amid tighter environmental compliance windows [1]Source: USDA Economic Research Service, “Farm Income and Wealth Statistics,” ERS.USDA.GOV. Federal and state cost-share programs that cover as much as 75% of the purchase price for low-disturbance equipment have shortened replacement cycles. Meanwhile, retrofit autonomy kits priced between USD 50,000 and USD 150,000 enable mid-sized farms to unlock supervised autonomy without purchasing new, seven-figure machines [2]Source: USDA Natural Resources Conservation Service, “Environmental Quality Incentives Program,” NRC.USDA.GOV. At the same time, rising steel costs and dealership consolidation threaten to slow adoption in price-sensitive segments, creating a bifurcated upgrade path in which large growers move quickly and smaller farms defer purchases.
Key Report Takeaways
- By product type, plowing and cultivating machinery led with a 37.56% market share of the North America agricultural tractor machinery in 2025, while sprayers are projected to grow at a 6.78% CAGR from 2026 to 2031.
- By geography, the United States commanded 63.02% market share of the North America agricultural tractor machinery in 2025, and Mexico is advancing at a 5.82% CAGR through 2031.
Note: Market size and forecast figures in this report are generated using Mordor Intelligence’s proprietary estimation framework, updated with the latest available data and insights as of 2026.
North America Agricultural Tractor Machinery Market Trends and Insights
Drivers Impact Analysis*
| Driver | (~) % Impact on CAGR Forecast | Geographic Relevance | Impact Timeline |
|---|---|---|---|
| Rising Retrofit Demand for Autonomous Tractor Retrofit Kits | +0.6% | United States and Canada, and early Midwest adoption | Medium term (2-4 years) |
| Government Carbon-Smart" Tillage Incentives Accelerating Equipment Upgrades" | +0.8% | United States, Canada, and Mexico | Short term (≤ 2 years) |
| Ongoing Labor Shortages Boosting Tractor-Implement Packages | +0.7% | United States, Canada, and Mexico export horticulture zones | Long term (≥ 4 years) |
| Electrification Pilots by OEMs (Original Equipment Manufacturers) Lowering Lifetime Operating Cost | +0.4% | California, Northeastern dairy, and peri-urban Mexico | Long term (≥ 4 years) |
| Resilient Grain Price Outlook Sustaining Farmer Cash-Flow for Machinery | +0.5% | United States Corn Belt, Canadian prairies, and Mexico feed-grain importers | Medium term (2-4 years) |
| Shift Toward Strip-Tillage Favors Higher-Horsepower Articulated Tractors | +0.5% | United States Midwest, Saskatchewan, and Alberta dryland | Medium term (2-4 years) |
| Source: Mordor Intelligence | |||
Rising Retrofit Demand for Autonomous Tractor Retrofit Kits
Aftermarket autonomy packages now allow growers to extend the useful life of tractors built as recently as 2015 for a fraction of the cost of factory-equipped autonomous units. Kits priced at USD 50,000–USD 150,000 bolt onto legacy 200- to 400-horsepower models and deliver supervised autonomy for tillage, planting, and spraying. Payback periods fall below three years when labor savings and longer operating windows are counted, especially in the 2,000- to 5,000-acre operations that dominate the United States Corn Belt [3]Source: AGCO Investor Presentation, “Quarterly Earnings and Strategic Updates,” AGCOCORP.COM. Deere’s 8R fully autonomous tractor, launched in production in 2024, retails above USD 500,000, underscoring the appeal of retrofit paths. Rapid kit adoption pressures OEMs (Original Equipment Manufacturers) to unbundle software from hardware and monetize autonomy as a subscription, a shift that could reshape long-term revenue models across the North America agricultural tractor machinery market.
Government Carbon-Smart" Tillage Incentives Accelerating Equipment Upgrades"
Federal and state cost-share programs covering up to 75% of equipment purchase prices have accelerated the shift from moldboard plows to vertical-tillage and strip-till tools. The United States Department of Agriculture disbursed USD 3.1 billion through the Environmental Quality Incentives Program (EQIP) in fiscal 2024, a large share of which financed low-disturbance tillage implements [4]USDA Natural Resources Conservation Service, “Environmental Quality Incentives Program,” NRC.USDA.GOV. Inflation Reduction Act provisions extend additional rebates for electric and hybrid tractors, and California’s Clean Off-Road Equipment Voucher Program can lower net costs by 40%–50% for qualifying models. Canada’s prairie provinces mirror these incentives through soil carbon credit schemes, while Mexico has begun including mechanization grants in Sembrando Vida. These overlapping subsidies compress replacement cycles from 10–12 years to as little as seven, offering OEMs (Original Equipment Manufacturers) near-term order visibility in the North America agricultural tractor machinery market.
Ongoing Labor Shortages Boosting Tractor-Implement Packages
Agricultural employment declined 3.2% year-over-year in 2024, and visa caps limit the availability of seasonal workers. Growers respond by pairing higher-horsepower tractors with wider implements such as 60-foot air seeders and 120-foot sprayers that let a single operator cover up to 1,000 acres per day. Canadian prairie farms averaging 1,800 acres amplify this trend, as do Mexican berry and avocado exporters where wages rose 25% since 2020 [5]Source: Statistics Canada, “Farm and Farm Operator Data,” STATCAN.GC.CA . Telemetry subscriptions bundled with new equipment deliver predictive maintenance and job analytics, easing the service burden when dealerships close or merge. These dynamics sustain demand for integrated tractor-implement packages across the North America agricultural tractor machinery market.
Electrification Pilots by OEMs (Original Equipment Manufacturers) Lowering Lifetime Operating Cost
OEM (Original Equipment Manufacturer) field trials between 2024 and 2025 show meaningful total cost of ownership gains in targeted use cases. CNH Industrial’s T6 180 compressed natural gas tractor achieved a 30% fuel saving at a California dairy, while AGCO’s Fendt e100 Vario pilot cut maintenance bills in half by removing diesel aftertreatment systems. Department of Energy forecasts put battery pack costs below USD 100/kWh by 2027, at which point 75- to 150-horsepower electric tractors reach purchase-price parity after tax credits. Although battery weight and rural charging gaps confine electric units to orchards, dairies, and vegetable farms today, road-mapped density improvements could see compact and utility electrics capture 10%–15% of segment revenue by 2030 within the North America agricultural tractor machinery market.
Restraints Impact Analysis*
| Restraint | (~) % Impact on CAGR Forecast | Geographic Relevance | Impact Timeline |
|---|---|---|---|
| High Up-Front Cost of Tier 4 Final / Stage V Compliant Engines | –0.7% | United States, Canada, and phased Stage V in Mexico | Short term (≤ 2 years) |
| Dealer Network Consolidation Limiting Service Accessibility in Rural Belts | –0.4% | United States Great Plains, Appalachia, and Canadian prairies | Medium term (2-4 years) |
| Volatile Steel Prices Squeezing OEM (Original Equipment Manufacturer) Margins and Inflating Sticker Prices | –0.5% | North America-wide, and greatest impact on domestic manufacturers | Short term (≤ 2 years) |
| Data-Ownership Concerns Slowing Adoption of Sensor-Integrated Implements | –0.3% | United States Corn Belt, and Canadian prairies | Long term (≥ 4 years) |
| Source: Mordor Intelligence | |||
High Up-Front Cost of Tier 4 Final / Stage V Compliant Engines
Tier 4 Final compliance adds 12%–15% to sticker prices for new tractors above 75 horsepower, hiking a 200-horsepower model from USD 180,000 in 2014 to USD 210,000–USD 220,000 in 2025 [6]Source: U.S. Environmental Protection Agency, “Nonroad Diesel Engines – Exhaust Emission Standards,” EPA.GOV. Manufacturers unable to spread R&D costs across high volumes, such as Buhler Industries, face higher engine sourcing expense, shrinking margins. Mexican growers import used Tier 3 units from the United States ahead of Stage V rules, undermining new-equipment demand. Although supplier scale should temper after-treatment costs after 2027, price premiums will persist, limiting growth for price-sensitive slices of the North America agricultural tractor machinery market.
Dealer Network Consolidation Limiting Service Accessibility in Rural Belts
Full-service locations in rural North America fell 15% since 2020, with drive times exceeding 90 minutes in some counties. Deere cut 8% of its dealer points between 2022 and 2024, with similar reductions at CNH Industrial. Longer service travel inflates downtime risk: a single lost planting day can cost a grower USD 10,000-USD 20,000 in unrealized yield. Farmers stockpile parts and advocate for right-to-repair rules, but mid-sized operations lacking in-house mechanics still face service gaps, damping replacement demand across the North America agricultural tractor machinery market.
*Our forecasts treat driver/restraint impacts as directional, not additive. The impact forecasts reflect baseline growth, mix effects, and variable interactions.
Segment Analysis
By Product Type: Precision Tillage Leads, Sprayers Accelerate
Plowing and cultivating machinery accounted for 37.56% of the North America agricultural tractor machinery market share in 2025, underscoring its role in seedbed preparation across more than 200 million acres of row crops. Within this segment, conservation-oriented vertical-tillage and strip-till tools are displacing moldboard plows, with state and federal incentives reinforcing adoption patterns. The North America agricultural tractor machinery market size for sprayers is projected to expand at a 6.78% CAGR as variable-rate application and the Global Positioning System (GPS) section control minimizes herbicide drift and meets buffer-zone mandates in California and Minnesota .
Planting equipment forms the second-largest slice, with down-force automation and singulation sensors raising germination uniformity. Haying and forage machinery caters to beef and dairy operations; declines in Northeastern dairy herds offset gains in Pacific Northwest forage exports. Drone-generated prescription maps are boosting demand for high-clearance sprayers, a trend projected to keep chemical application equipment the fastest-growing segment of the North America agricultural tractor machinery market through 2031.




Geography Analysis
The United States captured 63.02% of the North America agricultural tractor machinery market in 2025 due to vast corn, soybean, and wheat acreage. Nevertheless, unit sales slipped 13.4% year-over-year in November 2024 as elevated interest rates and inventory destocking weighed on demand. Federal climate-smart outlays and right-to-repair legislation in Colorado and Minnesota affect regional purchasing. California and New York have been early adopters of electric tractors, supported by substantial rebate programs, contributing to the growth of the North American agricultural tractor machinery market.
Mexico is forecast to grow 5.82% annually from 2026 to 2031, the fastest in the region, driven by export horticulture, smallholder mechanization grants, and the United States-Mexico-Canada Agreement (USMCA) tariff exemptions. Large northern vegetable farms demand high-capacity sprayers, while compact tractors dominate in the south. Stage V engine phase-in and gray-market used imports will shape competitive positioning in the North America agricultural tractor machinery market.
Canada is experiencing growth, driven by prairie wheat, canola, and pulse producers increasingly utilizing high-horsepower articulated tractors and air seeders to manage large farm sizes. The short growing seasons emphasize the importance of equipment reliability, while dealership consolidation follows patterns observed in the United States. The rest of North America, including Central America and the Caribbean, shows steady growth, supported by the expansion of sugarcane, coffee, and banana cultivation areas.
Regulatory Landscape
Regulation across North America is centered on emissions and safety compliance for off-road agricultural equipment. In the United States, EPA nonroad diesel engine requirements, including CO2 compliance provisions such as 40 CFR 1036.108 for tractor-designated engines, continue to shape OEM powertrain choices and total cost of ownership. This reinforces the shift toward Tier 4 Final-compliant platforms in higher-horsepower segments. Safety compliance also remains material in Canada at the province level, for example Ontario requirements for ROPS and operator protection, which can affect how quickly fleets of older tractors are replaced in mixed operations.
Policy and trade actions in 2026 also added near-term catalysts for purchases and service demand. In February 2026, the US EPA advanced farmers right-to-repair, and in March 2026 it issued guidance aimed at reducing repair friction for agricultural equipment maintenance. The guidance aligns with grower concerns around diagnostics access and downtime. On trade, a US presidential proclamation published in June 2026 reduced Section 232 tariff rates on imported agricultural equipment from 25% to 15% effective June 8, 2026 through December 31, 2027. The same proclamation set a 10% tariff rate for qualifying capital equipment with at least 85% US-sourced steel or aluminum by weight, influencing OEM sourcing strategies and import pricing windows.
Competitive Landscape
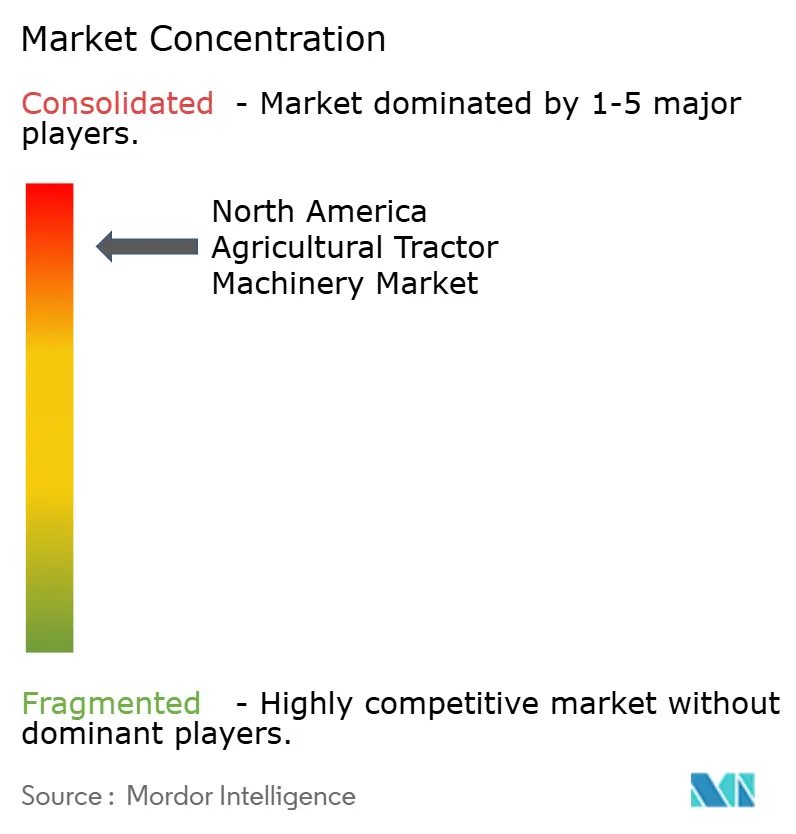
The North America agricultural tractor machinery market is highly concentrated, with the top manufacturers dominating the revenue share. Deere & Company’s significant share derives from vertically integrated engines, transmissions, and early autonomy offerings like the 8R. CNH Industrial and AGCO Corporation hold a major share combined through brands such as Case IH, New Holland, Fendt, and Massey Ferguson. Kubota Corporation and Mahindra&Mahindra Ltd. gain traction in sub-200-horsepower niches by pricing 15%–20% below premium competitors and focusing on simplicity.
Agtech startups offering retrofit autonomy kits threaten to commoditize hardware and force OEMs (Original Equipment Manufacturers) toward software-as-a-service models. Electric and hybrid tractors remain niche but represent a strategic white space. Colorado’s right-to-repair law of 2024 marks a regulatory shift that could dilute OEM (Original Equipment Manufacturer) aftermarket revenue streams, which account for 30%–40% of total profitability.
Competitive responses include dealer consolidation, direct-to-farmer sales portals, and partnership announcements such as AGCO Corporation’s sourcing agreement with SDF for sub-85-horsepower tractors, freeing engineering capacity for autonomous and electric platforms.
North America Agricultural Tractor Machinery Industry Leaders
Deere & Company
AGCO Corporation
CNH Industrial N.V.
Kubota Corporation
Mahindra&Mahindra Ltd.
- *Disclaimer: Major Players sorted in no particular order

Market Opportunities and Future Outlook
Electrification, retrofit upgrades, and compliance-driven replacement are converging into a more tangible opportunity, supported by active public funding and OEM product roadmaps. In May 2026, the Minnesota Department of Agriculture issued an FY2026 Electric Farm Equipment Grant RFP funded by the federal Inflation Reduction Act, focused on replacing diesel equipment with electrified alternatives. Programs of this type broaden the addressable market for electric-capable tractors and implements in orchard, dairy, and municipal-adjacent use cases where duty cycles and charging access are more manageable, building on the state-level incentive environment referenced in the broader market context.
A second opportunity is the shift of agricultural equipment from one-time purchases toward recurring upgrade and service revenue tied to precision, automation, and dealer-independent support models. OEM actions in 2026, including John Deere model-year updates that include precision upgrade automation packages for older machinery, and product launches that embed connectivity and monitoring (such as New Holland Speedrower 1 Series windrowers with connectivity and yield monitoring announced in July 2026), indicate a pathway for farms to modernize capabilities without replacing the entire tractor fleet. The June 2026 reduction in Section 232 tariffs on imported agricultural equipment through 2027 also creates more room for procurement in price-sensitive segments, while motivating manufacturers and dealers to sharpen value propositions around warranties, parts availability, and software-enabled productivity given tighter service accessibility in rural belts.
Recent Industry Developments
- June 2026: John Deere expanded updates to its Model Year 2027 8 Series tractors (250-410 hp), including an integrated 3-year/1,500-hour limited PowerGard extended warranty in the US market. The product update bundles service assurance into the machine offer, supporting dealer retention and lowering perceived risk for farms managing longer travel times to full-service locations.
- September 2025: AGCO introduced the Fendt 1000 Vario Gen4 tractor and the Fendt Optimum planter as part of its North America-focused portfolio refresh. The paired tractor and planter offering reinforces the move toward integrated tractor-implement packages and precision-enabled workflows for large-acreage growers.
- August 2024: AGCO brought new high-horsepower offerings to North America, including the Massey Ferguson 9S Series tractor and the Fendt 600 Vario series. These launches broadened choice in the premium segment and increased competitive pressure on incumbents to differentiate through cab technology, efficiency, and precision-readiness.


Research Methodology Framework and Report Scope
Market Definition and Coverage
For this methodology, the market includes revenue generated from farm tractor-linked field equipment sold for crop production work across North America, where the equipment directly supports land preparation, planting, crop protection, and forage operations.
Scope exclusions: We exclude non-agriculture tractors and off-highway equipment meant mainly for construction, mining, landscaping, and other non-farm uses.
Segmentation Overview
- By Product Type
- Plowing and Cultivating Machinery
- Plows
- Harrows
- Rotovators and Cultivators
- Other Equipment
- Planting Machinery
- Seed Drills
- Planters
- Spreaders
- Other Planting Machinery
- Sprayers
- Haying and Forage Machinery
- Mowers and Conditioners
- Balers
- Other Haying and Forage Machinery
- Other Types
- Plowing and Cultivating Machinery
- By Geography
- United States
- Mexico
- Canada
- Rest of North America
Data Sources, Market Sizing, and Validation
Desk Research
Desk research was used to set the market structure and anchor the inputs to steady public data. We referred to sources such as USDA (including NASS) for acreage, farm equipment context, and farm income signals, and Statistics Canada for agricultural production and farm operating conditions.
To cross-check supply-side movement, we also used public trade and policy data such as USITC trade statistics, and select Canadian trade tables, which help spot import and export swings that can influence dealer availability and pricing. Additional grounding came from sources such as FAO datasets for broad output direction, peer-reviewed journals on mechanization and application practices (for example, spraying and planting intensity), and public patent databases to see which implement technologies are being prioritized. We also reviewed company filings, earnings call transcripts, and association and dealer publications for mix shifts, promotions, and replacement timing notes, and we used a paid subscription for company financials and intelligence to sanity check regional exposure. The sources listed here are illustrative, and many other public references were also used for data collection, validation, and clarification during the work.
Primary Interviews and Surveys
Primary work focused on confirming what equipment categories are being purchased with tractors and how pricing and discounting behave at the dealer level. We spoke with a mix of OEM-side managers, dealer and distributor leaders, and large farm fleet decision-makers across the United States, Canada, and Mexico so that replacement cycles, financing conditions, and inventory patterns could be checked before totals were finalized.
Distribution of primary research fieldwork respondents
| Company type | Respondent position |
|---|---|
| Top tier: 28% | CXOs: 12% |
| Mid tier: 57% | Functional/Unit leaders: 32% |
| Smaller Players: 15% | Managers: 56% |
Market-Sizing & Forecasting
Market sizing was built using a top-down and bottom-up mix, where the main structure starts from North America equipment demand pools tied to crop acreage, mechanization intensity, and replacement cycles, and then gets reconciled with supplier and channel checks. The top-down view uses indicators like planted and harvested acreage, crop mix shifts, farm income expectations, and credit conditions to estimate purchasing appetite, which is then translated into equipment volumes by category.
Those volumes are priced using observed average selling price ranges and mix assumptions for plowing and cultivating equipment, planting machinery, sprayers, and haying and forage machinery, followed by an adjustment for dealer incentives when they were reported in interviews. Selective bottom-up approximations were used to keep totals grounded, such as rolling up sampled dealer throughput, checking manufacturer regional splits from disclosures, and using a simple ASP times volume cross-check where reliable ranges were available. Where product-level inputs were patchy, gaps were handled by using adjacent equipment categories as proxies and then tightening them with primary feedback on share and utilization.
For forecasting, we leaned on scenario analysis supported by a light multivariate regression check, where drivers included expected acreage direction, the equipment age profile that shapes replacement pressure, the effect of input costs on farmer spending, and the pace of adoption for precision-ready implements that can change attachment and upgrade rates. Assumptions were kept consistent across countries, and then localized for known differences in farm size and crop profiles.
Data Validation & Update Cycle
Model outputs were validated through several passes, starting with checks on year-over-year movement, pricing progression, and category share stability. We compared the results with independent signals such as dealer inventory tone, tractor and implement shipment commentary, and key agriculture indicators so that unrealistic jumps could be flagged early.
When variances were outside expected ranges, the inputs were revisited and, if required, experts were re-contacted to confirm whether the driver was real or just a modeling artifact. Before sign-off, another analyst reviews the calculations and scope alignment so arithmetic and definition issues are caught. Reports are refreshed annually, with interim updates triggered by material events such as sharp rate changes, demand shocks, or major pricing resets, and a final pre-delivery pass is completed so clients receive the latest updated view.
Mordor Intelligence's North America Agricultural Tractor Machinery Market Size Compared Against Other Published Estimates
Different published numbers for this market are common because authors do not always count the same equipment and they also choose different base years and price treatments. Geography coverage can look similar, yet the included product set and how replacement demand is translated into annual sales can still create a wide spread.
The main gap comes from whether the number covers tractors only or the wider set of tractor-towed and tractor-mounted farm machinery, and Mordor Intelligence keeps the total tied to implement categories like tillage, planting, spraying, and haying, and then validates the pricing mix through dealer discounting checks instead of applying a single inflation factor.
Benchmark comparison
| Source | Market Size | Gaps in Research Methodology |
|---|---|---|
| Mordor Intelligence | USD 35 B (2025) | |
| Industry Publisher A | USD 5.59 B (2024) | Uses a tractor-only definition with different inclusions by power class, and it does not represent the added value of planting, spraying, tillage, and forage implements that move with tractor fleets. |
| Industry Publisher B | USD 19.3 B (2024) | Tracks tractors across broader use cases and applies a different outlook profile, but it still excludes multiple implement categories and can treat pricing progression as a single blended uplift rather than category-level mix. |
The table shows that scope is the biggest driver of the spread, because tractor-only totals will sit well below machinery-inclusive totals even when the region is the same. Once the equipment set and pricing steps are aligned, the remaining differences mostly come from replacement timing and how discounting is reflected in average selling prices, which we can pressure test through channel feedback.


Key Questions Answered in the Report
How big is the North America agricultural tractor machinery market in 2026?
The market stands at USD 36.45 billion in 2026 and is projected to reach USD 44.64 billion by 2031 at a 4.14% CAGR.
Which product segment is growing fastest?
Sprayers are forecast to grow at a 6.78% CAGR because variable-rate technology cuts chemical use and meets drift regulations.
Why is Mexico recording the highest growth rate?
Government precision-equipment subsidies and export horticulture expansion push Mexico’s CAGR to 5.82% through 2031.
What impact do autonomous retrofit kits have on equipment demand?
Kits priced at USD 50,000–USD 150,000 let farms extend tractor life and unlock supervised autonomy, shortening payback periods to under three years.
Are electric tractors commercially viable today?
They work best in dairy and orchard settings with short duty cycles, and battery costs are projected to reach parity with diesel models by 2027.
Page last updated on:


 Your data is secure and never sold or shared.


