Agriculture Drones Market Size and Share
Market Overview
| Study Period | 2021 - 2031 |
|---|---|
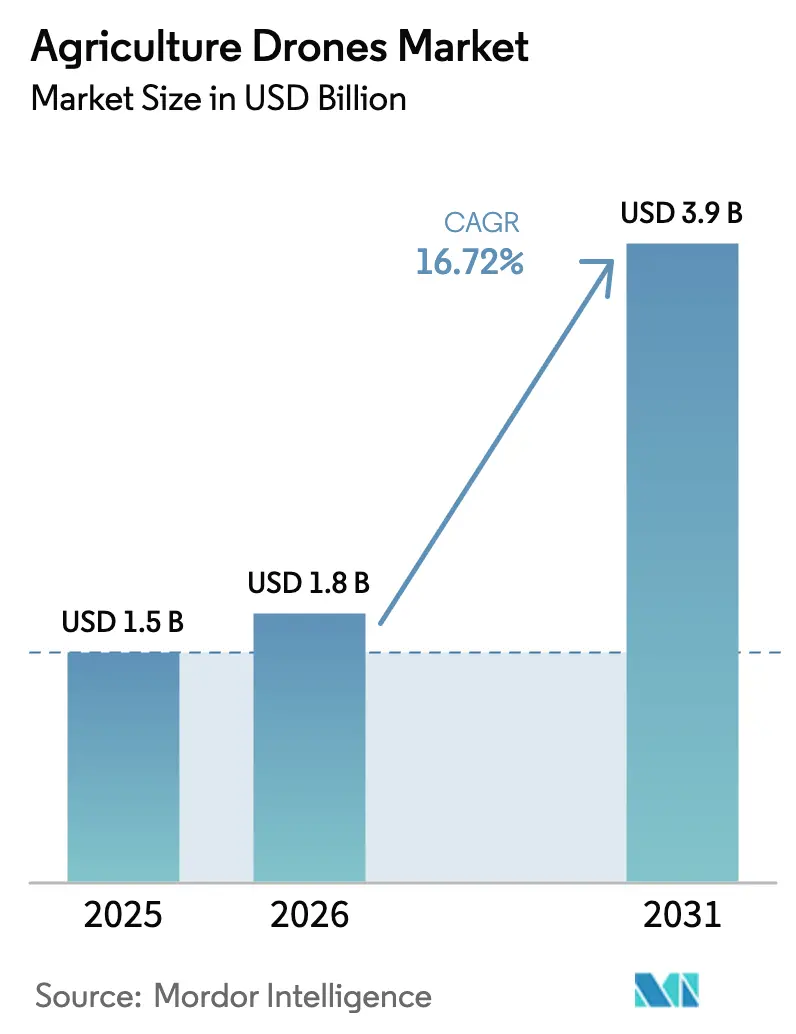
| Market Size (2026) | USD 1.8 Billion |
| Market Size (2031) | USD 3.9 Billion |
| Growth Rate (2026 - 2031) | 16.72% CAGR |
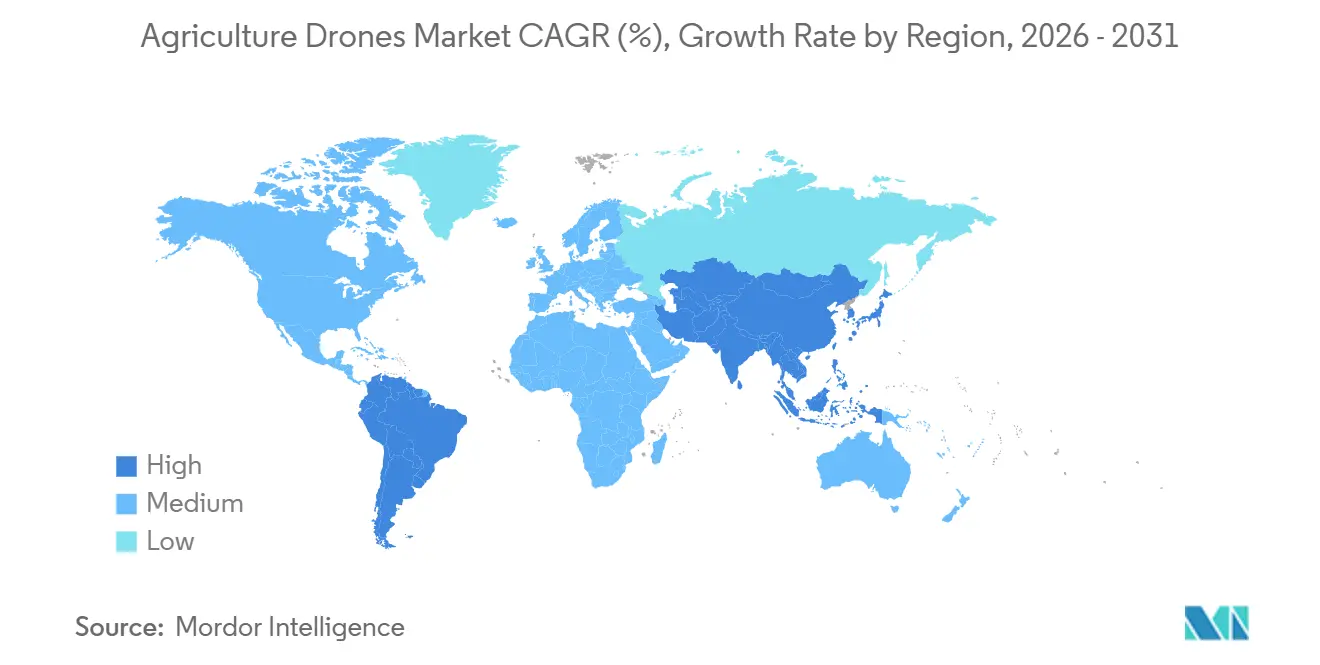
| Fastest Growing Market | Asia Pacific |
| Largest Market | North America |
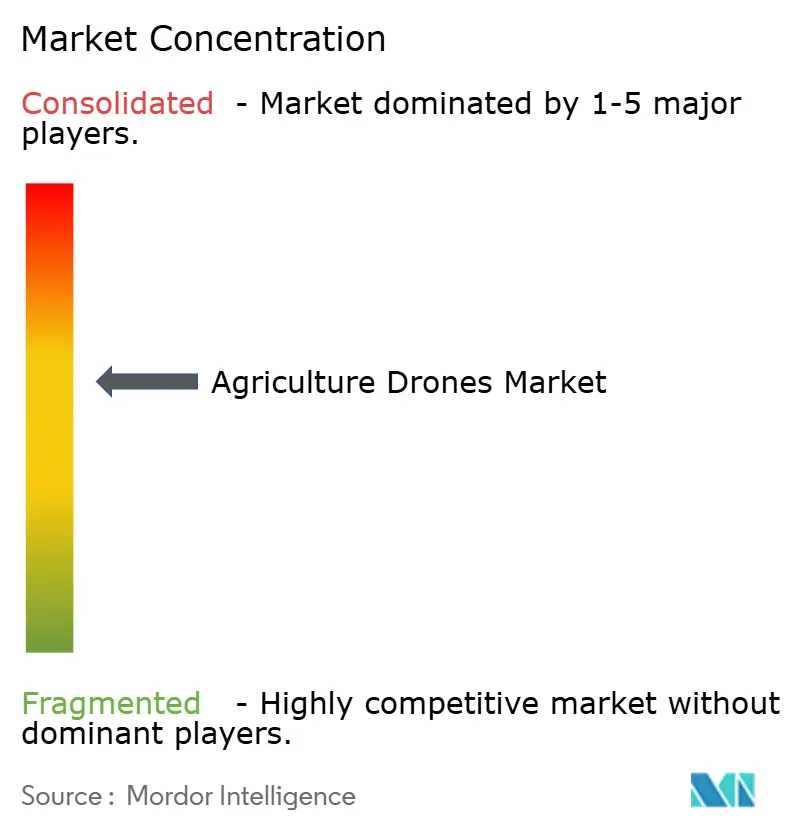
| Market Concentration | Medium |
Major Players *Disclaimer: Major Players sorted in no particular order Image © Mordor Intelligence. Reuse requires attribution under CC BY 4.0. | |
Agriculture Drones Market Analysis by Mordor Intelligence
The agriculture drones market size was valued at USD 1.5 billion in 2025 and estimated to grow from USD 1.8 billion in 2026 to reach USD 3.9 billion by 2031, at a CAGR of 16.72% during the forecast period (2026-2031). Hardware prices continue to fall, while fertilizer and pesticide costs rise, prompting growers to adopt sensor-guided spraying, which reduces chemical use by up to 35.0%. National subsidy programs in the United States, India, Australia, and the United Kingdom are redirecting public funds toward aerial platforms, confirming that drones can simultaneously ease labor gaps and mitigate climate risks[1]Source: United States Department of Agriculture, “Direct Farm Ownership Loans,” USDA Farm Service Agency, usda.gov. Rotary-wing models currently dominate fleet counts, yet hybrid vertical-takeoff designs are gaining traction because they meet the extended endurance needs of large-scale estates. Parallel growth in edge artificial intelligence (AI) and fifth-generation (5G) farm connectivity compresses the time between image capture and variable-rate application, making in-field decision cycles almost immediate.
Key Report Takeaways
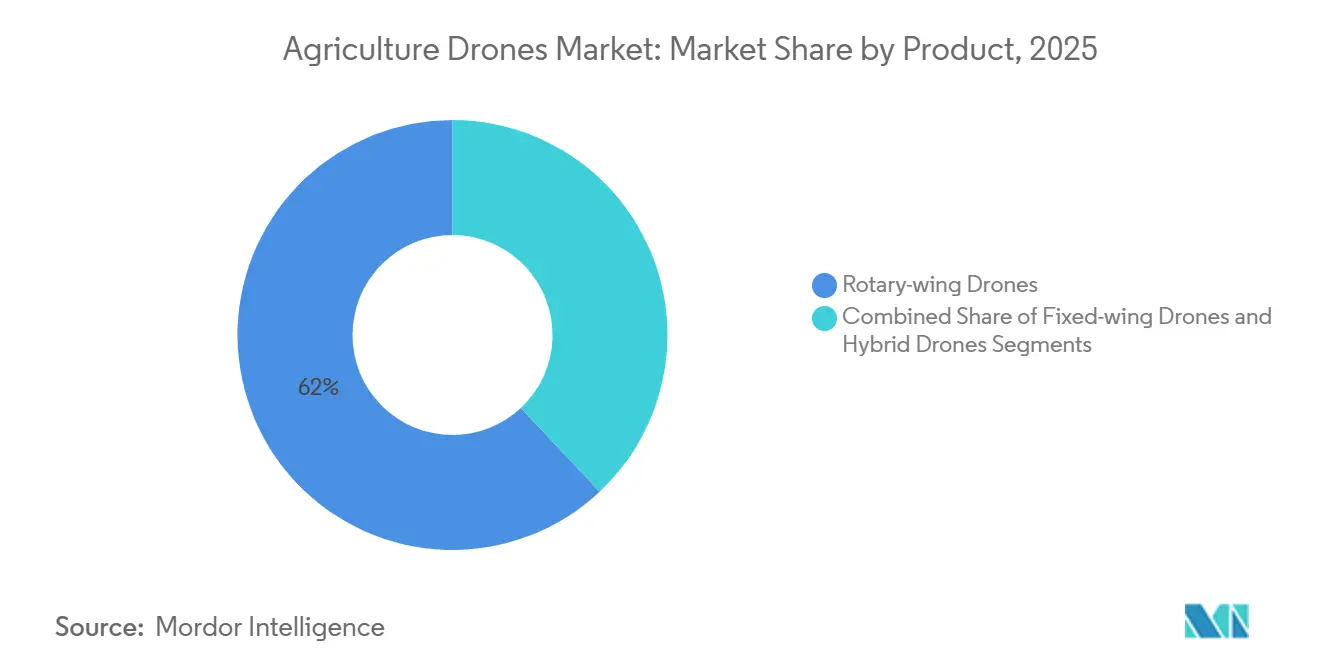
- By product category, rotary-wing drones led with 62.0% of the agriculture drones market share in 2025, whereas hybrid designs are forecast to expand at an 18.9% CAGR through 2031.
- By component, hardware accounted for 55.0% of the agriculture drones market size in 2025, while services are projected to advance at a 17.8% CAGR to 2031.
- By application, crop monitoring accounted for a 48.0% share of the agriculture drones market size in 2025, and crop spraying is projected to rise at an 18.4% CAGR through 2031.
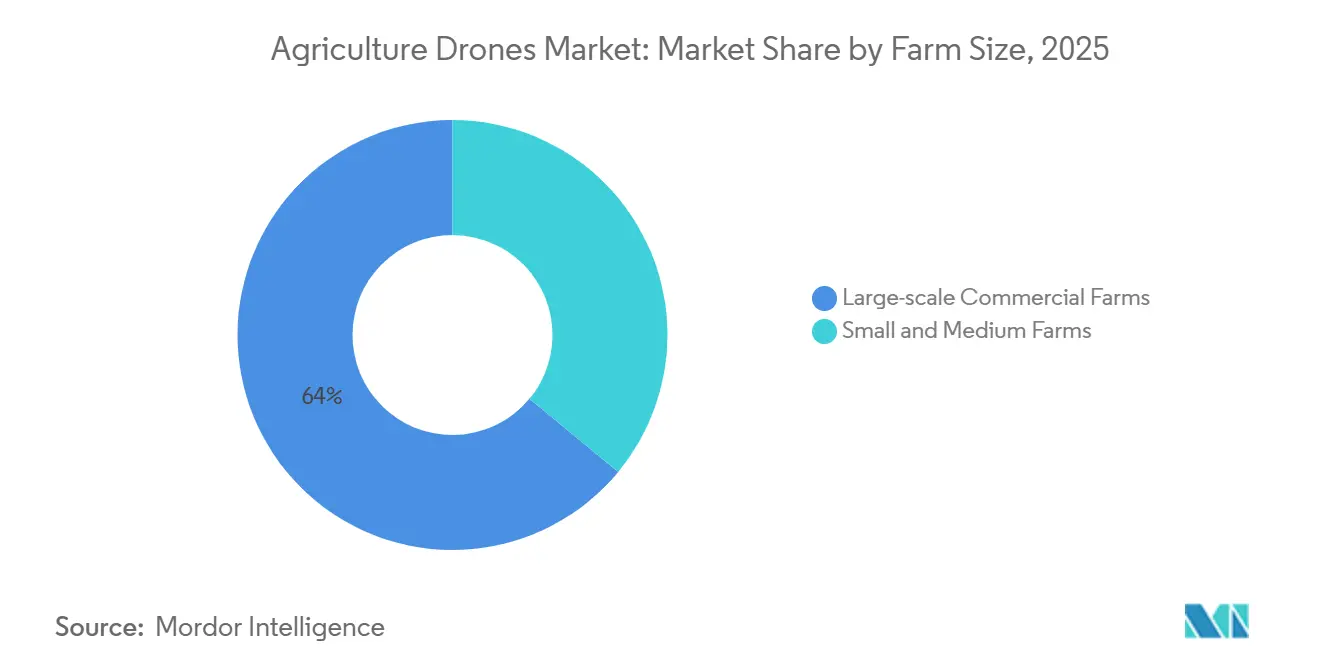
- By farm size, large-scale commercial farms captured 64.0% of the agricultural drones market share in 2025, while small and medium farms are anticipated to grow at a 17.6% CAGR to 2031.
- By geography, North America accounted for a 36.0% share of the revenue in 2025, and Asia-Pacific is projected to register an 18.5% CAGR through 2031.
Note: Market size and forecast figures in this report are generated using Mordor Intelligence’s proprietary estimation framework, updated with the latest available data and insights as of January 2026.
Global Agriculture Drones Market Trends and Insights
Drivers Impact Analysis*
| Driver | (~) % Impact on CAGR Forecast | Geographic Relevance | Impact Timeline |
|---|---|---|---|
| Rapid decline in drone hardware prices | +3.0% | Global, with strongest uptake in Asia-Pacific and South America | Short term (≤ 2 years) |
| Expansion of 5G and edge-AI enabling real-time analytics | +2.8% | North America and Europe lead deployment, Asia-Pacific scaling rapidly | Medium term (2-4 years) |
| Government subsidies for precision agriculture | +3.2% | North America, Europe, Asia-Pacific (India, China), emerging in Africa | Short term (≤ 2 years) |
| Rising agro-chemical cost pushing variable-rate spraying demand | +2.9% | Global, particularly acute in North America, Europe, and Brazil | Medium term (2-4 years) |
| Climate-change driven need for crop stress monitoring | +2.6% | Global, with heightened urgency in drought-prone regions (Middle East, Africa, Australia) | Long term (≥ 4 years) |
| Carbon-credit markets rewarding low-input farming | +1.8% | North America and Europe early adopters, pilot programs in South America | Long term (≥ 4 years) |
| Source: Mordor Intelligence | |||
Rapid Decline in Drone Hardware Prices
Entry-level agricultural drones now retail for USD 2,000-4,000, down from USD 14,500 in 2016, allowing smallholder cooperatives to justify ownership[2]Source: South China Morning Post, “Chinese Agricultural Drone Prices Fall as Market Matures,” scmp.com. Mid-range platforms, priced at USD 8,000-15,000, include obstacle avoidance and automated mission planning features, which were once reserved for enterprise models topping USD 20,000. Modular airframes support payload swaps, extending the useful life and improving the return on investment. Subsidies in India and Australia eliminate up to 80.0% of the purchase cost, accelerating fleet turnover[3]Source: Australian Government Department of Agriculture, “On Farm Connectivity Program,” agriculture.gov.au. Hardware margins are stabilizing even as unit prices fall, signaling a maturing supply chain.
Expansion of 5G and Edge-AI Enabling Real-Time Analytics
Fifth-generation networks reduce latency to below twenty milliseconds, allowing drones to transmit imagery and receive prescription maps during a single flight. Trials on United States corn farms demonstrate that onboard convolutional networks can classify stress with 94.0% accuracy, thereby removing cloud-upload bottlenecks. Private 5G installations on large estates coordinate swarms of ten or more drones, providing daily coverage of over 1,000 acres. Edge processing also addresses privacy worries because raw images never leave the farm. Module prices under USD 500 are anticipated by 2027, opening the technology to mid-size growers.
Government Subsidies for Precision Agriculture
The United States Department of Agriculture (USDA) routed USD 300 million in Direct Conservation loans during 2025 toward aerial platforms. Australia’s On Farm Connectivity Program reimburses 50.0% of qualifying purchases up to AUD 30 million (USD 20 million) nationwide. India’s Namo Drone Didi plan allocates INR 800,000 (USD 9,600) to 15,000 women-led groups, forming community spraying networks[4]Source: Ministry of Agriculture and Farmers Welfare, “Namo Drone Didi Scheme,” agricoop.nic.in. The United Kingdom offers GBP 43 (USD 54) per hectare annually for camera-guided application, driving sustained fleet renewal.
Rising Agro-Chemical Cost Pushing Variable-Rate Spraying Demand
Fertilizer and pesticide price inflation, driven by natural gas feedstock costs and supply chain disruptions, has increased input expenses by 15.0-25.0% since 2024. This has prompted growers to optimize application rates using precision spraying. Variable-rate technology (VRT), enabled by drones, reduces chemical usage by 20.0-35.0%, saving USD 15-30 per acre for high-value crops such as grapes, almonds, and vegetables. Autonomous flight planning software integrates prescription maps, adjusting nozzle flow rates in real time. This is valuable in Brazil's sugarcane sector, where pest pressure varies across large estates. Regulatory pressure also supports the adoption of variable-rate technology (VRT), with the European Union's Sustainable Use of Pesticides Directive and the United States Environmental Protection Agency's (EPA) stewardship programs promoting precision methods.
Restraints Impact Analysis*
| Restraint | (~) % Impact on CAGR Forecast | Geographic Relevance | Impact Timeline |
|---|---|---|---|
| Air-traffic integration hurdles | -2.1% | Global, with acute bottlenecks in North America and Europe due to dense airspace | Medium term (2-4 years) |
| Data-privacy concerns among farmers | -1.3% | Europe (GDPR enforcement), North America (state-level fragmentation), emerging in Asia-Pacific | Short term (≤ 2 years) |
| Short battery endurance for large acreage | -1.7% | Global, particularly constraining in North America, South America, and Australia with broad-acre farms | Medium term (2-4 years) |
| Fragmented regulatory standards across countries | -1.5% | Global, with highest compliance costs for multinational OEMs operating across North America, Europe, and Asia-Pacific | Long term (≥ 4 years) |
| Source: Mordor Intelligence | |||
Air-Traffic Integration Hurdles
Unmanned Traffic Management systems for integrating agricultural drones into controlled airspace are under development, delaying Beyond Visual Line of Sight operations essential for large farms. The Federal Aviation Administration's 2024 Notice of Proposed Rulemaking for Beyond Visual Line of Sight remains unresolved, leaving operators reliant on waivers. The European Union's U-space regulation mandates the implementation of U-space airspace by 2027, but the timing of implementation varies. Remote identification requirements add USD 100-300 per unit in hardware costs. Until the infrastructure matures, drones remain limited to visual line-of-sight operations, covering 50-100 acres per flight.
Short Battery Endurance for Large Acreage
Lithium-polymer batteries in rotary-wing drones provide 15-30 minutes of flight, limiting daily coverage to 50-150 acres. Large farms of 1,000-5,000 acres in regions such as North America and Australia find multi-rotor platforms to be inefficient. Fixed-wing drones offer flight times of 45-90 minutes but lack hovering capabilities for precision tasks. Hybrid vertical takeoff and landing platforms, such as AeroVironment's Quantix Recon, can cover 400 acres in 45 minutes but cost over USD 15,000, which limits their adoption. Solid-state batteries promise 50-100% energy density gains but remain 3-5 years away and cost 200-300% more than lithium-polymer batteries. Endurance constraints force operators to prioritize high-value crops, leaving routine monitoring to satellites or ground scouts.
*Our forecasts treat driver/restraint impacts as directional, not additive. The impact forecasts reflect baseline growth, mix effects, and variable interactions.
Segment Analysis
By Product: Hybrid Platforms Bridge Endurance Gap
Rotary-wing drones held a 62.0% market share in the agricultural drones market in 2025, dominating crop spraying and livestock monitoring due to their hovering capability and maneuverability, despite having endurance limitations. Hybrid drones are projected to grow at a 18.9% CAGR through 2031, driven by demand for platforms that combine vertical takeoff with fixed-wing cruise efficiency. AeroVironment's Quantix Recon offers 45-minute flight times and 400-acre coverage per sortie, addressing productivity gaps in broad-acre estates. Fixed-wing drones, with an endurance of 45-90 minutes, are commonly used in mapping and surveying, but they lack the precision required for variable-rate spraying. Regulatory approvals for Beyond Visual Line of Sight (BVLOS) operations will benefit hybrid and fixed-wing drones due to their extended range.
Rotary-wing platforms dominate the sub-USD 10,000 segment, with manufacturers such as SZ DJI Technology Co., Ltd. and XAG Co., Ltd. offering feature-rich models. Hybrid platforms are gaining traction due to their versatility in spraying, scouting, and irrigation management, particularly in regions such as India and Southeast Asia, where smallholder farmers cultivate multiple crops.


By Component: Services Segment Disrupts Capital Model
In 2025, hardware accounted for 55.0% of the agricultural drones market size, including airframes, sensors, batteries, and ground control stations. However, the services segment is projected to grow at a CAGR of 17.8% through 2031. Drone-as-a-Service (DaaS) models reduce upfront capital requirements and transfer operational risks to specialized providers. Companies such as DroneDeploy, Inc. and PrecisionHawk, Inc. offer subscription-based analytics platforms that bundle flight operations, data processing, and agronomic insights for USD 5-15 per acre per season, making precision agriculture accessible to farms that cannot justify investments of USD 10,000-30,000 in hardware.
Software components, such as flight planning, image stitching, and machine learning inference, are increasingly delivered via cloud platforms, creating recurring revenue streams and improving vendor margins. Services such as pilot training, maintenance contracts, and regulatory compliance support are particularly valuable in regions like India and Africa, where technical expertise is limited.
By Application: Autonomous Spraying Reshapes Input Economics
Crop monitoring accounted for 48.0% of the application share in 2025, utilizing multispectral and thermal imaging to detect stress, disease, and nutrient deficiencies before visible symptoms appear. Crop spraying is anticipated to rise at an 18.4% CAGR through 2031, driven by autonomous platforms that reduce chemical usage by 20.0-35.0%. Companies like XAG Company Limited and SZ DJI Technology Company Limited lead this segment with platforms such as the XAG P100 and DJI Agras T50, featuring precision nozzle control and automated flight planning. Field mapping supports pre-season planning and post-harvest analysis, generating prescription maps for spraying and fertilization.
Livestock monitoring is a niche field, primarily focused in Australia and South America, where drones are used to locate animals and assess pastures. Irrigation management is increasing in water-scarce regions, with the use of thermal sensors to identify leaks and uneven distribution. Soil analysis is expanding with the use of affordable hyperspectral sensors that detect organic matter and pH, aiding in tillage strategies. Regulatory approvals for pesticide use via drones remain fragmented, with agencies such as the United States Environmental Protection Agency (EPA) and the European Food Safety Authority (EFSA) imposing restrictions. Autonomous spraying and real-time analytics are enabling drones to detect stress, generate prescriptions, and execute treatments in a single flight, thereby reducing decision cycles.
By Farm Size: Cooperatives Unlock Smallholder Access
Large-scale commercial farms held a 64.0% market share by farm size in 2025, leveraging economies of scale to justify investments of USD 20,000 to USD 50,000 in multi-drone fleets and dedicated pilot staff. Small and medium farms are adopting drone technology at a CAGR of 17.6% through 2031, supported by cooperative ownership models and government subsidies that reduce per-farm capital requirements. Australia's On Farm Connectivity Program offers USD 20,000 (AUD 30,000) rebates, helping mid-sized farms deploy connectivity infrastructure and precision tools, including drones.
Small and medium farms face barriers such as limited technical expertise, fragmented landholdings, and skepticism about return on investment. Training programs by equipment manufacturers and agricultural extension services address skill gaps, while smartphone-based ground control stations simplify operations.
Geography Analysis
The Asia-Pacific region is projected to grow at an 18.5% CAGR during 2026-2031, driven by China's extensive manufacturing capabilities and government-supported agricultural modernization initiatives. These programs position drones as essential tools for enhancing food security. The region faces labor shortages and rising wages, making automation a viable investment. SZ DJI Technology Co., Ltd. leverages its expertise in consumer drones to offer the Agras T50, T40, T25, and T10 series, priced between USD 5,000 and USD 27,000, targeting both smallholder and commercial farming segments.
North America accounted for the largest market share, holding 36.0% in 2025, supported by a well-established precision agriculture infrastructure. The United States Department of Agriculture's (USDA) USD 300 million Direct Conservation Loan Program prioritizes aerial platforms and sensor networks. The Federal Aviation Administration's (FAA) Part 107 regulation, along with incremental beyond visual line of sight (BVLOS) waivers, facilitates the deployment of multi-drone fleets on large-scale commercial farms.
Europe's growth is constrained by the European Union Aviation Safety Agency's (EASA) U-space airspace integration timelines and the General Data Protection Regulation (GDPR) 's data privacy requirements, which slow the adoption of drone services. Germany, France, and the United Kingdom lead the region's deployment efforts. In South America, Brazil's large-scale sugarcane, soybean, and corn operations benefit from variable-rate spraying, while Argentina's grain and cattle sectors adopt drones for crop monitoring and pasture management. Africa and the Middle East face infrastructure gaps, including limited 4G/5G coverage and inadequate pilot training programs, which slow adoption compared to developed regions.

Competitive Landscape
The agriculture drones market demonstrates moderate concentration. In 2025, the top five companies accounted for the majority of the revenue, while analytics software and regional service delivery remained fragmented. SZ DJI Technology Co., Ltd. and XAG Co., Ltd. vertically integrate component sourcing and direct retail, delivering price leadership across product tiers. Yamaha Motor Co., Ltd. leverages four decades of unmanned helicopter know-how to hold a premium share in Japan’s rice paddies.
Start-ups like Hylio Inc. and Kray Technologies LLC are addressing market gaps with modular payloads and high-speed spraying solutions. Intellectual property activity around autonomous navigation continued to accelerate through 2024-2025, underscoring sustained innovation and a growing strategic focus on flight autonomy and decision-making intelligence. Meanwhile, subscription analytics firms like DroneDeploy Inc. and PrecisionHawk Inc. are pivoting toward Drone-in-a-Box systems, which raise utilization but demand hefty capital.
Competitive priorities focus on battery endurance, 5G connectivity, and carbon-credit data services that monetize sustainability metrics. Vendors blending open interfaces with proprietary AI pipelines position themselves to ride the next upgrade wave as regulatory clarity and edge computing converge.
Agriculture Drones Industry Leaders
SZ DJI Technology Co., Ltd.
XAG Co., Ltd.
Yamaha Motor Co., Ltd.
PrecisionHawk, Inc.
Parrot S.A.
- *Disclaimer: Major Players sorted in no particular order

Recent Industry Developments
- December 2025: Connecticut, United States, enacted Public Act 25-152, allowing expanded use of drones for seeding, spraying, and crop surveying. This legislation modernizes regulations for agricultural Unmanned Aerial Vehicles (UAVs) and facilitates broader adoption by farms, subject to compliance with the Federal Aviation Administration's and certification requirements.
- August 2025: Terra Drone Corporation entered into a sales partnership with PT. Yanmar Diesel Indonesia, a subsidiary of Yanmar Co., Ltd., to distribute Terra’s G20 and E16 agricultural drones to rice and field crop farmers in Indonesia, thereby enhancing its regional market presence.
- July 2025: SZ DJI Technology Co., Ltd. introduced the Agras T100, T70P, and T25P agricultural drone series globally. These drones offer enhanced payload capacity, autonomous spraying and spreading capabilities, and lifting functions, designed to improve precision farming operations worldwide.
- May 2025: Hylio Inc. opened a 40,000-square-foot agricultural drone manufacturing facility in Texas, increasing production capacity in the United States by approximately fivefold to an estimated 5,000 units annually, thereby strengthening domestic precision agriculture Unmanned Aerial Vehicle (UAV) manufacturing.


Research Methodology Framework and Report Scope
Market Definitions and Key Coverage
Our study treats the agriculture drones market as the sale and leasing of unmanned aerial vehicles, integrated cameras or spray payloads, plus onboard software that are purpose-built for field mapping, crop scouting, variable-rate input application, and livestock observation across all cultivated crops worldwide.
(Scope exclusions) Ground robots, satellite imagery services, and consumer hobby drones that are occasionally flown over farms are outside our coverage.
Segmentation Overview
- By Product
- Fixed-wing Drones
- Rotary-wing Drones
- Hybrid Drones
- By Component
- Hardware
- Software
- Services
- By Application
- Field Mapping and Surveying
- Crop Spraying
- Crop Monitoring/Field Surveillance
- Livestock Monitoring
- Irrigation Management
- Soil and Field Analysis
- By Farm Size
- Large-scale Commercial Farms
- Small and Medium Farms
- By Geography
- North America
- United States
- Canada
- Rest of North America
- South America
- Brazil
- Argentina
- Rest of South America
- Europe
- Germany
- United Kingdom
- France
- Russia
- Rest of Europe
- Asia-Pacific
- China
- India
- Japan
- Australia
- Rest of Asia-Pacific
- Middle East
- Saudi Arabia
- United Arab Emirates
- Rest of Middle East
- Africa
- South Africa
- Kenya
- Rest of Africa
- North America
Detailed Research Methodology and Data Validation
Primary Research
We spoke with agronomists, drone service providers, regional regulators, farm-management platform vendors, and growers in North America, Europe, Asia-Pacific, and Latin America. Their insights confirmed average acres per mission, common service fee structures, adoption hurdles, and likely refresh cycles, letting us validate secondary numbers and close information gaps before finalizing assumptions.
Desk Research
Mordor analysts began with public datasets from bodies such as USDA ERS, FAOSTAT, Eurostat, and the International Civil Aviation Organization, which reveal the hectares under precision farming, drone flight approvals, and certified pilot counts. Trade association white papers, peer-reviewed journals on aerial spraying efficacy, and patent filings on multispectral sensors further helped us benchmark technology diffusion and cost curves.
Company 10-Ks, investor decks, customs shipment records, and news feeds from paid files like Dow Jones Factiva and D&B Hoovers provided selling prices, shipment volumes, and recent regulatory events that move demand. Many other open and subscription sources were referenced; the list above is only illustrative.
Market-Sizing & Forecasting
A top-down demand pool was first estimated by overlaying arable land area with precision-farming penetration and allowable drone flight hours, which are then multiplied by the average number of units required per thousand hectares. Results were cross-checked through selective bottom-up supplier roll-ups and sampled average selling price multiplied by unit sales to fine-tune totals. Key variables in the model include farm size distribution, flight exemption counts, agrochemical price index movements, average spraying cost per hectare, sensor penetration rates, and battery energy density improvements. Forecasts to 2030 draw on multivariate regression fitted to these drivers and scenario analysis agreed upon by our interview panel. Where bottom-up gaps appeared, regional analogs and channel checks were used to adjust volumes conservatively.
Data Validation & Update Cycle
Outputs pass variance checks against independent acreage data, hardware import trends, and service hours logged on national registries. An analyst peer reviews anomalies, after which the report is signed off. We refresh figures every twelve months and trigger interim updates when material regulations or technology breakthroughs surface.
Why Mordor Intelligence's Agriculture Drones Baseline Commands Reliability
Published estimates rarely match because firms differ on what counts as a farm-grade platform, which revenue streams are included, and how currency conversions are timed. Our disciplined scope, yearly refresh, and dual-track modeling create a dependable reference point.
Key gap drivers involve whether refurbished units are counted, how aggressively future hardware price drops are baked in, and if leasing revenue is added to hardware sales.
Benchmark comparison
| Market Size | Anonymized source | Primary gap driver |
|---|---|---|
| USD 5.40 B (2025) | Mordor Intelligence | - |
| USD 2.01 B (2024) | Global Consultancy A | Excludes Drone-as-a-Service revenue and counts only hardware shipments |
| USD 2.74 B (2024) | Industry Association B | Uses historical unit sales without adjusting for falling ASPs or currency inflation |
In sum, Mordor's numbers rest on transparent variables, balanced assumptions, and a repeatable audit trail, giving decision-makers a solid footing when planning investments in aerial farm technology.


Key Questions Answered in the Report
How fast is the agriculture drones market growing between 2026 and 2031?
The sector is projected to post a 16.72% CAGR, taking value from USD 1.8 billion in 2026 to USD 3.9 billion by 2031.
Which platform type is gaining the most ground?
Hybrid vertical-takeoff drones show the highest momentum, advancing at an 18.9% CAGR through 2031 as they merge hover precision with fixed-wing endurance.
What is driving demand for drone-based crop spraying?
Rising fertilizer and pesticide costs make variable-rate spraying attractive, saving 20.0-35.0% on inputs while meeting tightening environmental rules.
How are small farms accessing drone technology?
Cooperative ownership, government subsidies such as India’s Namo Drone Didi, and pay-per-acre Drone-as-a-Service models lower capital barriers.
Which region holds the strongest growth outlook?
Asia-Pacific leads with an 18.5% CAGR through 2031, supported by China’s manufacturing scale and aggressive subsidy programs across India, Japan, and Australia.
What regulatory change could unlock larger acreage coverage?
Broad deployment of U-space corridors in Europe and streamlined BVLOS approvals by the FAA would allow extended-range flights, boosting productivity for broad-acre farms.
Page last updated on:


